Poxton, Anthony, Longstaff, Andrew P., Barrans, Simon, Myers, Alan, Fletcher, Simon and Pislaru,
Crinela
Simulation of the structural elements of a three axis VMC for machine tool error compensation
Original Citation
Poxton, Anthony, Longstaff, Andrew P., Barrans, Simon, Myers, Alan, Fletcher, Simon and Pislaru,
Crinela (2008) Simulation of the structural elements of a three axis VMC for machine tool error
compensation. In: Proceedings of Computing and Engineering Annual Researchers' Conference
2008: CEARC’08. University of Huddersfield, Huddersfield, pp. 2327. ISBN 9781862180673
This version is available at http://eprints.hud.ac.uk/id/eprint/3674/
The University Repository is a digital collection of the research output of the
University, available on Open Access. Copyright and Moral Rights for the items
on this site are retained by the individual author and/or other copyright owners.
Users may access full items free of charge; copies of full text items generally
can be reproduced, displayed or performed and given to third parties in any
format or medium for personal research or study, educational or notforprofit
purposes without prior permission or charge, provided:
•
The authors, title and full bibliographic details is credited in any copy;
•
A hyperlink and/or URL is included for the original metadata page; and
•
The content is not changed in any way.
For more information, including our policy and submission procedure, please
contact the Repository Team at: [email protected].
Simulation of the Structural Elements of a Three Axis VMC
for Machine Tool Error Compensation
A.J.Poxton1, A.P.Longstaff1, S.M.Barrans1, A.Myers1, S.Fletcher1, C.Pislaru1 1
University of Huddersfield, Queensgate, Huddersfield HD1 3DH, UK
ABSTRACT
Great interest is being made by manufacturers and end users in the reduction of inherent errors which occur in the design and manufacture of machine tools. This paper describes offline methods used for simulation and analysis of a three axis vertical machining centre (VMC) for the reduction and compensation of non-rigid errors. Models of the kinematic linked structural elements are described and the methods used for verification of results.
Keywords: FEA, machine tool non-rigid errors, offline simulation, spatial resolution
1 INTRODUCTION
In today’s highly competitive manufacturing environment industry demands reductions in rework, scrap and warranty costs together with tighter manufacturing tolerances to improve product reliability and interchangeability of parts. This places an ever increasing requirement on machine tool manufacturers to increase the accuracy and production rates of the machine tools (Blake 1995) and yet to remain competitive, machine tool builders have to reduce design and build times and manufacturing costs. If the anticipated trend for in-process measurement increases, then the machine tool is used for measuring the component and must be of an even higher order of accuracy.
It has been recognised for many years that all machine tools contain errors and previous work (Wang et al 2006) determined that total machine errors comprised of geometric or rigid body errors, thermal errors, non-rigid body errors and dynamic effects.
Etotal = erigid + ethermal + enon-rigid + edynamic (1)
Numerous researchers (Ramesh et al (2000), Liang et al (1997) and Chen (1995)) indicate that geometric and thermal effects make the largest contribution to machine tool errors and so concentrate the greatest efforts for research. (Fletcher et al) quote the use of error compensation to achieve a 97% reduction of rigid errors, from 65 microns to 2 microns. This indicates that rigid errors can be rendered negligible but, as tighter manufacturing tolerances are imposed and developments made in materials and cutting technologies a greater emphasis is being placed on compensation of non-rigid errors, cutting forces and dynamic effects.
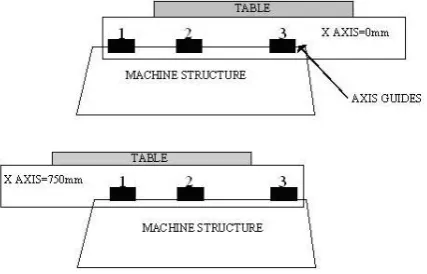
Non-rigid effects occur due to deformation of the structural elements caused by applied loads and gravitational effects as the structural elements are moved through the working volume of the machine. The moving elements are incremented along their axes and online measurement used to obtain the combined geometric and non-rigid error components using laser interferometery with static data capture at each position. Figure 1 shows the layout of the linear motion guide carriages of a Beaver 3 axis VMC (Longstaff et al (2005)), the effect on variation in loading of the carriages and hence displacement of the table can be seen as the saddle is moved along its axis. The non-rigid effects on ‘x’ axis linear positioning errors obtained via online measurement are shown in figure 2. This indicates a 55 micron error due the kinematic linking effects of the movement of the table and saddle. The effects of the ‘z’ axis have been neglected as, due to the machine configuration, it imposes no kinematic linking effect on the ‘x’ and ‘y’ axes.
Dependant on the machine size and configuration an extensive amount of online, non-productive machine downtime may be required for measurement of the 21 standard geometric error components of 3 axis VMC (Blake 1995). Additional time is then required for interpretation of the results and installation and calibration of the error compensation system. However the pressures on manufacturing schedules dictate that time required for installation and calibration of the error compensation must be reduced.
methodology required using commercial FEA software as an offline technique to provide an efficient method to determine the spatial resolution for online measurement and as an effective platform for analysis and reduction of machine tool non-rigid errors.
2 SIMULATION
The investigations are being carried out on a Cincinnati 500x500x500mm three axis VMC. Initially the mass and position of the component, work holding fixtures, cutting forces and dynamic effects have been neglected as this allows direct verification of the results with online measurement of the combined geometric errors and non-rigid effects.
For the simulation to be useful for error compensation each error component must be determined by incrementing the table, saddle and spindle carrier through their working axis. Abaqus CEA version 6.7-1 was selected to carry out the analyses due its ability to automate multiple analyses using scripting language, coupled with improvements in the solid modelling user interface. Due to the potential large number of analyses required, several stages of simplification or idealisation of the table, saddle, base, column and spindle carrier have been created to reduce the analysis run time and quantify their significance on the non-rigid error components.
The models were discretised (meshed) using the Abaqus auto-generation mesh and the analyses carried out using a 2.4GHz 64 bit Quad core processor with 4Gb RAM. Figure 3 shows the model of the table containing the maximum amount of manufacturing detail. Manufacturing drawings were used to remove unnecessary details such as drilled and tapped holes, fillets and fine machined details, however a large amount of detail has been retained including weight reduction pockets, internal ribs, table overhang and tee slots. Figure 4 shows how the manufacturing detail has been reduced to form a channel section, the section properties were proportioned in relationship to the second moment of inertia of the ‘as made’ table and the overall length reduced to that of the tee slots. To ensure the mass distribution of the machine was retained through the working volume the material density was modified to retain the overall table mass.
A sub-assembly of the base was constructed from instances of individual models of the base, saddle and table using 3D tetrahedral elements. Linear motion guide ways were modelled and manual techniques used to align and increment the moving elements in relationship to the actual machine axes. Whilst cutting forces and dynamic effects have been neglected in the initial analyses, the table and saddle ball screws were included in the model using beam elements as this allows the applied forces to be transferred along their line of action in subsequent analyses.
Partitioning and node sets have been used to force nodes at discrete points and ensure node numbers remain unchanged as the moving elements are incremented. Nodes were created for attachment of the linear motion guide carriages and to determine the deformation at the points of interest on the table, the node sets being dimensioned to ensure that efforts required for scripting are minimised when moving the elements along their axes.
Figure 5 shows the discretised model of the sub-assembly of the base saddle and table with the table incorporating the manufacturing detail. Initial analysis indicates a vector sum of +16 micron non-rigid error with machine axis components of x = +0.14 microns, y = -0.13 microns, z = -14 microns at the modelled coordinates. Idealised models can be analysed later to allow informed choices to be made to quantify the relative significance of manufacturing details on the non-rigid error components and computer processing time.
During previous work (Widiyarto (2006)) the base was mounted on six legs which were fully constrained on an infinitely stiff ground. It was considered that the mounting feet have a negligible effect on the magnitude of the non-rigid error components and, to reduce its complexity and processing time, they have been omitted from the model. The fixed constraints were subsequently added to the mounting plate fixing holes which allows for flexing of the mounting brackets.
not of interest and its inclusion only contributes to additional processing time, therefore the motor mass was applied as a pressure load, smeared over the motor mountings.
Figure 6 shows the solid model of the column and spindle carrier assembly used to confirm the modelling principles of the linear motion guide carriages and ball screws. The spindle carrier was incremented along the vertical ‘z’ axis to define the methods required to write the output data in a format for error compensation. Preliminary values were used for the material properties, ball screw and guide carriage stiffness to check the constraints and behaviour of the model. Using these preliminary values the model behaviour was as predicted and a vector sum of +34.0 micron was obtained for the non-rigid error with components of x = -0.86 microns, y = -19.9 microns, z = -28.0 microns. Following online validation of the simulation, the refinement of constraints and properties will be reviewed.
3 VERIFICATION
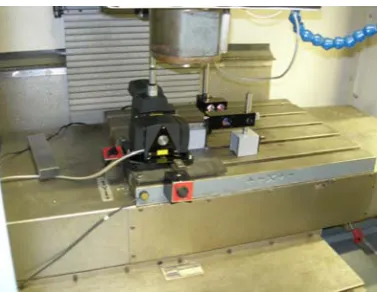
To corroborate validity of the simulated results, online measurement of moving axes with static data capture is being carried out throughout the working volume of the machine using current state-of-the-art technology laser interferometer and additional standard metrology equipment as shown in figure 7. This equipment provides the standard 21 geometric error components for the three axis VMC from which the non-rigid effects can be determined and a direct correlation made to the offline simulated data.
4 CONCLUSION
Methods have been developed using Abaqus CAE v6.7-1 for offline simulation of a three axis VMC to manually increment the structural elements along their axes to determine the non-rigid error components. Methodologies have been developed to determine the significance of manufacturing details, stiffness of linear motion guide ways and ball screws on non-rigid error components and further work is being carried out to refine the simulation of the ball screws.
The simulation indicates a vector sum of 16 microns for the table displacement and 34 micron displacement of the spindle carrier, the magnitude of these errors now becomes significant when rigid errors are being compensated and controlled to within 2 microns.
Generated data files have been extracted for use in error compensation and further work is being carried out to automate the simulation process for multiple analyses throughout the working volume.
A number of manufacturers of state-of-the-art laser interferometer equipment have been investigated for online measurement and verification of the simulated data. At present this technology is proving to be time consuming for practical use in a manufacturing environment which further emphasises the need for offline simulation.
Validation of the simulated data is yet to be made and the next stage in the analysis is to combine the two sub-assembly models to form the simulation of the machine assembly and increment the tables, saddle and spindle carrier through the working volume to determine the ‘x’, ‘y’, ‘z’ displacement at the points of interest along the table and tool point. Later work will also include applied cutting loads, component mass and position, applied fixture loads and dynamic effects, all of which can readily be applied to the existing models.
REFERENCES
[1] BLAKE, M.D., Investigation into load effects on machine tool accuracy, M.Phil. thesis, (1995) [2] WANG S.M., YU, H.J., LIAO, H.W., A new high-efficiency error compensation system for CNC
multi-axis machine tools, Chung Yuan University, Taiwan, R.O.C., Int. J. Adv. Manuf. Technol, (2006), 28: 518-256,
DOI 10.1007/s00170-004-2389-8,
[3] RAMESH, R., MANANNA, M.A., POO, A.N., Error compensation in machine tools – A review, Pt 1: Geometric, cutting force induced & fixture dependant errors, Internal Journal of Machine Tools & Manufacturers, (40) (2000), 1235-1256.
[4] LIANG, J.C., LI, H.F., YUAN, J.X., NI, J., A comprehensive system for correcting geometric, thermal & cutting force induced errors, Int. J.Adv. Manuf. Technol, (1997) 13: 708-712
[6] FLETCHER, S., LONGSTAFF, A.P., Non-rigid errors in Beaver 3 axis VMC, University of Huddersfield, Internal report.
[7] LONGSTAFF, A.P., FLETCHER, S., MYERS, A., FORD D.G., “Volumetric compensation of machine tools makes geometric errors negligible”, 3rd International Congress on Precision Machining, pp209-216, (2005)
[8] WIDIYARTO, M.H.N., Modelling & passive correction of vibration induced machining errors on CNC machine tools, Ph.D. Thesis, (2006)
[image:5.595.190.404.178.315.2]Fig 1. Beaver VMC variation of ‘y’ axis guide loading due to change in ‘x’ axis position [1]
Fig. 2 Non-rigid errors Beaver 3 axis VMC [2]
Fig. 3 Table with manufacturing details 0
100 200 300 400 500 00 6 700
0 200
60
400 0 10 20 30 40 50
Positioning error (microns)
X axis position (mm) Y axis
position (mm) Non-rigid effect on X axis linear positioning
[image:5.595.183.416.374.515.2]Fig. 4 Idealised table
Fig. 5 Table, saddle and base assembly
Fig. 6 Assembly of column and spindle carrier
[image:6.595.204.393.454.600.2]