2017 2nd International Conference on Information Technology and Management Engineering (ITME 2017) ISBN: 978-1-60595-415-8
Phishing Website Detection Using C4.5 Decision Tree
Xiang YANG*, Li YAN, Bo YANG and Ying-fang LI
School of Engineering Technology, Honghe University, Mengzi, 661100, China*Corresponding author
Keywords: Phishing website, C4.5, Classification.
Abstract. Among various anti-phishing solutions, Machine Learning techniques are considered to be promising. The purpose of this study was to evaluate the effect of C4.5 decision tree algorithm on phishing website detection. In the experiment, C4.5 had learned two models using two phishing website datasets respectively, which were PWD and PWD2, the latter was obtained through dimensionality reduction on the former. Under 10-fold cross-validation, various metrics indicated that the two models all done very well. The results of the corrected paired t-test under the significance of 0.05 (two tailed), shown that accuracy and recall metrics of the model based on PWD is not statistically significantly different to those of PWD2. According to the better model, the one based on PWD2, which had the lower complexity and the similar performance compared with the one based on PWD, the top 5 key features for classification were obtained.
Introduction
Phishing is the attempt to obtain sensitive information such as usernames, passwords, and credit card details, often for malicious reason, by masquerading as a trustworthy entity in an electronic communication [1, 2]. According to the 2013 Microsoft Computing Safety Index Report [3], the annual worldwide cost of trouble on phishing is as high as $2.4 billion USD.
Phishing is typically carried out by email spoofing or instant messaging, and it entices victims to enter personal information at a fake website (phishing website) whose look and feel are almost identical to the legitimate one. In addition, phishing websites also often are infected with malware, which make the victims more vulnerable.
There are any anti-phishing solutions that are divided into user training approaches and software classification approaches:
User training approaches. User training approaches aim to educate end-users to better understand the nature of phishing attacks, and then they can correctly identify phishing and legitimate websites. An evaluation [4] of different educational materials (include Microsoft Online safety, OnGuardOnline phishing tips, National Consumer League Fraud tips, Anti-Phishing Phil and PhishGuru Cartoon) is presented, and it shows that user training approaches are promising. It should be pointed out that user training approaches often lead to lower TN rate.
Software classification approaches. Software classification approaches aim at classifying phishing and legitimate, which include blacklists, rule-based heuristics, visual similarity and machine learning-based classifiers. Generally, blacklists have lower FP rate than heuristics [5]; however, its performance on against zero-hour phishing attacks is not satisfactory [5], but heuristics is effective in this regard. Visual similarity achieve the similar characteristics to heuristics (i.e., higher FP rate than blacklists, effectiveness on against zero-hour phishing attacks, and higher computational cost), and it can be effective additions in larger classifiers. Machine learning techniques can construct classification models by analyzing dataset. Machine learning-based classifiers can achieve very high classification accuracy [6, 7] while maintaining the ability to against zero-hour phishing attacks.
In this paper, we propose a decision tree by using C4.5 algorithm, which is use to classify phishing and legitimate websites. As one of the important techniques in machine learning, we analyze and evaluate the performance of C4.5 algorithm on detecting phishing websites. According to the features of C4.5, we also can get the top key features of website category.
Correlative Theories
C4.5 Decision Tree Algorithm [9]
A decision tree looks like a flowchart, where each non-leaf node denotes a test on an attribute, each branch represents an outcome of the test, and each leaf node holds a class label.
Given a tuple with class label unknown, to predict its class label, a path is traced from the root to a leaf node, which holds the class prediction for the tuple.
C4.5 is used to construct decision tree through the learning from class-labeled training tuples; it adopts a greedy, top-down recursive divide-and-conquer, approach to construct decision trees.
Attribute selection is a key problem in constructing decision tree, which determines which attribute to be split (i.e., as a non-leaf node of decision tree). The attribute selection measure provides a ranking for each attribute according to the training tuples. The attribute with the best score for the measure is chosen to be the splitting attribute. In C4.5, gain ratio is used as the attribute selection measure.
Let D be a training set of class-labeled tuples, Ci(for i = 1, ... , m) is the class label of a tuple, the
entropy of D is given by
= − ∑ log, (1)
where pi is the probability that a tuple in D belongs to class Ci. Let Ci,D be the set of tuples of class
Ci; let |Ci,D| and |D| denote the number of tuples in Ci,D and D, respectively; then pi can be estimated
by |Ci,D|/|D|. The entropy of D represents the “amount” of information needed to classify a tuple in
D.
After the tuples in D have been partitioned by attribute A having v distinct values, the more information needed to arrive at exact classification can be measured by
= ∑||× , (2)
where Dj is the subset of D; the tuples in Dj all have the jth value on A.
The information gain of attribute A is
!"# = − . (3)
Ideally, each partition would be pure (i.e., all the tuples in a partition belong to the same class). So, the attribute with the maximum information gain is chosen as the splitting attribute.
The information gain is biased toward attribute with many outcomes (e.g., ID). So, the gain ratio is applied in C4.5 to overcome this bias, it is
!"%!&"# =*+,-.)/0'()1, (4) where
23"& = − ∑||× log4||5. (5)
Because of the noise or outliers in training dataset, many branches of decision tree reflect this kind of anomalies in fact, in other words, the decision tree is over-fitted. Tree pruning methods used to address over-fitting by remove the least-reliable branches.
Classifier Performance Evaluation
After a classifier is derived using training dataset, the classifier’s performance should be evaluated on test set.
Let TP, TN, FP, FN, P, N be the number of true positive, true negative, false positive, false negative, positive, and negative tuples, respectively; there are some measures: accuracy (or recognition rate, equal to 67869789 ), error rate (or misclassification rate, equal to :78:9789 ), sensitivity
(also known as true positive rate or recall, equal to 67
7), specificity (or true negative rate, equal to 69
9), precision (equal to 67
678:7), and Fβ (weighted harmonic mean of precision and recall which
assigns β times as much weight to recall as to precision, equal to 8;;<×+=>?@0)8=>?(,,<×+=>?@0)×=>?(,,, where β is
a non-negative real number). The measures are all between 0 and 1; among them, error rate the smaller the better, the others the bigger the better. Generally, the accuracy works best when dataset classes are evenly distributed; other measures are better suited to imbalance problem.
Receiver operating characteristic (ROC) curve is a visual tool that also often evaluates the performance of a classifier. An ROC curve can show the trade-off between the true positive rate and the false positive rate (equal to :7
9, which is 1 – specificity). The ROC curve is closer to the upper
left, the better the model; in other words, the area under the curve (AUC or ROC area) will be 1.0 for a perfect model.
Data Selection and Description
The phishing websites dataset (PWD) used in this study can be obtained from UCI Machine Learning Repository [10].
Maybe because of the deficiency of the agreement on the definitive features those characterize phishing websites, it is difficult to shape a dataset that covers all possible features. So, PWD uses some important features that have proved to be sound and effective in detecting phishing websites, which are partitioned to 4 classes: address bar based features (12 features), abnormal based features (6 features), HTML and JavaScript based features (5 features), and domain based features (7 features).
There are 30 features in PWD which are all nominal; there is no missing value for each feature on the dataset. Most of the features’ values for a tuple are obtained through domain knowledge or experience, take the feature of URL_length as an example:
A%B,>)C-D = E
legitimate mark as 1 A%B 3OP&ℎ < 54 suspicious mark as 0 54 ≤ A%B 3OP&ℎ ≤ 75 phishing mark as − 1 A%B 3OP&ℎ > 75
It should be pointed out that the rules like this are only judgments based on domain knowledge or experience, which is why construct classification model.
Each tuple in PWD represents a website that is labeled as phishing (mark as -1) or legitimate (mark as 1) website. There are 11055 tuples, among them, 4898 (44%) are labeled as phishing, and 6157 (56%) are labeled as legitimate; it can be considered that the classes distribution of PWD have slight imbalance.
feature along with the degree of redundancy between them; to search the space of attribute subsets, an approach of greedy hillclimbing augmented with a backtracking facility is used. After dimension reduction processing, there are 9 features in PWD2. In section “Experimental Results”, PWD and PWD2 are used to construct decision tree respectively to evaluate the dimension reduction through comparing the decision tree models.
Experimental Results
[image:4.612.112.500.288.407.2]By applying C4.5 algorithm on PWD, the obtained confusion matrix is shown in Table 1, the decision tree has 169 leaves, the size of the tree is 297 (in other words, the tree has 297 nodes). By breadth-first traversal of the top 3 levels of the decision tree, obtained the list of features is SSLfinal_State, Prefix_Suffix, URL_of_Anchor, URL_of_Anchor, URL_of_Anchor, Prefix_Suffix, web_traffic, URL_Length, and their levels are 1, 2, 2, 2, 3, 3, 3 and 3, respectively. To evaluate the decision tree model, 10-fold crass-validation is used, and the results are show in Table 2; note that, in Table 2, the metrics for each class is the mean of 10 folds (e.g., for class -1, the TP rate, 0.942, is the mean of 10 folds).
Table 1. Confusion matrix on PWD.
Classified as -1 Classified as 1
-1 4615 283
1 173 5984
Table 2. Relational metrics on PWD.
Class TP rate FP rate Precision Recall F1 ROC area
-1 0.942 0.028 0.964 0.942 0.953 0.984 1 0.972 0.058 0.955 0.972 0.963 0.984 Weighted avg. 0.959 0.045 0.959 0.959 0.959 0.984
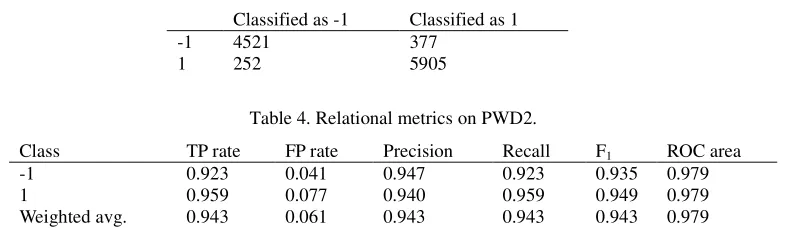
Using the same method to process PWD2, the confusion matrix and the relational metrics see Table 3 and Table4, respectively. The decision tree has 80 leaves, and the size of the tree is 125. Using breadth-first traversal on the top 3 levels of the decision tree, the list of features is SSLfinal_State, Prefix_Suffix, URL_of_Anchor, URL_of_Anchor, URL_of_Anchor, Prefix_Suffix, web_traffic, having_Sub_Domain, and their levels are 1, 2, 2, 2, 3, 3, 3 and 3, respectively.
Table 3. Confusion matrix on PWD2.
Classified as -1 Classified as 1
-1 4521 377
[image:4.612.109.504.511.628.2]1 252 5905
Table 4. Relational metrics on PWD2.
Class TP rate FP rate Precision Recall F1 ROC area
-1 0.923 0.041 0.947 0.923 0.935 0.979 1 0.959 0.077 0.940 0.959 0.949 0.979 Weighted avg. 0.943 0.061 0.943 0.943 0.943 0.979
respectively, which are 0.92 and 0.01 on PWD2 respectively; the true positive rate on PWD compares to the one on PWD2 is not statistically significantly different.
Discussions
Performance of C4.5
The following discussion is about class -1 (phishing) on PWD.
The TP rate (0.942), can be thought of as a measure of completeness, is very closer to 1.0, this show that the proportion of positive tuples that are correctly identified is very high; the FP rate (equal to 1 – specificity) is 0.028 and very closer to 0.0, which shows that the proportion of negative tuples that are incorrectly identified is very low. ROC curve can show the trade-off between TP rate and FP rate; the ROC area (0.984) is very closer to 1.0, it proves the fact that the high TP rate with the low FP rate by using C4.5.
The very high precision (0.964) shows the high exactness by using C4.5. The trade-off between the precision and the recall, F1 (0.953), is very closer to 1.0, which proves the fact that the high recall with the high precision by using C4.5.
Through the above statement, it can be considered that the performance of C4.5 is very good for class -1 on PWD. Through the discussions those are about class 1 on PWD, class -1 on PWD2, class 1 on PWD2 respectively by the similar approach, similar conclusions can be obtained, i.e., in general, the performance of C4.5 algorithm on PWD and PWD2 are all very good according to various evaluation measures.
In addition, an end-user careless accesses to a phishing website, will give him a huge loss; so, recall measure is very import to phishing detection problem. The experimental results show that the recall measures for class -1 are all very high, not only on PWD, but also on PWD2.
Selection of Dataset
Experimental results show that the size of the decision tree for PWD is 297 with 169 leaves, and the size of the decision tree for PWD2 is 125 with 80 leaves; it show that the factor, the features in PWD (30) are much more than the features in PWD2 (9), lead to the decision tree for PWD is much more complex than the decision tree for PWD2. Obviously, more features on dataset will lead to the more computational cost. It is well-known that a model with highly complex and computational cost is detrimental to applying.
After repeat 10 times 10-fold cross-validation on PWD and PWD2 respectively, the standard deviations of accuracy are 0.0054 and 0.0069 for PWD and PWD2 respectively; the standard deviations of recall are all 0.01 for PWD and PWD2; it shows that the accuracy and the recall of C4.5 are all very stable, not only on PWD, and also on PWD2. Through the corrected paired t-test under the significance of 0.05 (two tailed), it shows that the accuracies on PWD and PWD2 are not statistically significantly different, the recalls on PWD and PWD2 are also like this; in other words, the performance of C4.5 on the two dataset is the same, at least the accuracy and the recall, more important measures for phishing website detection problem.
In summary, the decision tree based on PWD2 is better than the one based on PWD.
Key Features for Classification
In C4.5, the feature with the maximum gain ratio is selected as the splitting feature, it lead to the resulting partitions at each branch are as pure as possible. A pure partition means that all the tuples in it belong to the same class. So, the feature that is closer to the root of a decision tree is more conducive to classification.
Conclusions
C4.5 has very good classification ability and high stability, not only on PWD, but also on PWD2. The model based on PWD2 is better than the one based on PWD because: 1) the two models are not statistically significantly different on performance, and 2) compare to PWD, the less features on PWD2 can decrease the complexity of model and computational cost.
Based on the characteristic of the selection of splitting feature in C4.5, the key features for classification can be obtained using the decision tree. In our problem, the key features for phishing website detection are SSLfinal_State (1), Prefix_Suffix (2), URL_of_Anchor (2), web_traffic (3) and having_Sub_Domain (3) (The values in parentheses indicate importance, a smaller value means more important). It should be noted that it is not enough to achieving accurate classification just based on the key features, but this makes sense.
The dataset used in this study has been preprocessed by experts using domain knowledge and experience, plus the development of phishing technology is fast; selecting appropriate features and preprocessing them is a very challenging work.
Acknowledgement
We thank the anonymous reviewers for their valuable suggestions which improved the presentation of the paper. This work was financially sponsored by Honghe University of China (Project No. JJJG151004).
References
[1]Z. Ramzan, Phishing Attacks and Countermeasures, in: Handbook of Information and Communication Security, Springer Berlin Heidelberg, 2010, pp. 433-448.
[2]A. V. D. Merwe, M. Loock, M. Dabrowski, Characteristics and responsibilities involved in a Phishing attack, Proceedings of International Symposium on Information & Communication Technologies Wisict’, 2005, pp. 249-254.
[3]Microsoft Corporation. 2013 Microsoft Computing Safety Index WorldWide Report. http://go.microsoft.com/?linkid=9843176, accessed November 2016.
[4]S. Sheng, M. Holbrook, P. Kumaraguru, et al., Who falls for phish?: a demographic analysis of phishing susceptibility and effectiveness of interventions, Proceedings of the SIGCHI Conference on Human Factors in Computing Systems. ACM, 2010: 373-382.
[5]S. Sheng, B. Wardman, G. Warner, et al., An empirical analysis of phishing blacklists, Proceedings of Sixth Conference on Email and Anti-Spam (CEAS), 2009.
[6]C. Whittaker, B. Ryner, M. Nazif, et al., Large-Scale Automatic Classification of Phishing Pages, network and distributed system security symposium, 2010.
[7]A. Bergholz, J. De Beer, S. Glahn, et al., New filtering approaches for phishing email, Journal of computer security, 18(1) (2010) 7-35.
[8]M. Khonji, Y. Iraqi, A. Jones, Phishing detection: a literature survey, IEEE Communications Surveys & Tutorials, 15(4) (2013) 2091-2121.
[9]J. R. Quinlan, C4. 5: programs for machine learning, Elsevier, 2014.