2017 2nd International Conference on Information Technology and Management Engineering (ITME 2017) ISBN: 978-1-60595-415-8
Improved Dynamic RSSI-TDOA Weighted Fusion Indoor
Localization Algorithm
En-su ZHOU, Qi WANG, Nai-yu WANG, Liang HU and Jian-feng CHU*
College of Computer Science and Technology, Jilin University, Changchun 130000, China *Corresponding author
Keywords: Indoor positioning, Time difference of arrival, Received signal strength indication, Weighted data fusion.
Abstract. Due to physical factors like unstable AP signal strength and complex indoor environment, there are problems in conventional difference of time arrival (TDOA) algorithm such as inaccurate positioning, large impact on positioning accuracy caused by abnormal data. After analyzing TDOA algorithm and RSSI algorithm, this paper proposed RSSI-TDOA weighted fusion indoor localization algorithm. In order to obtain a more accurate estimate of the position, this algorithm combines improved dynamic RSSI algorithm with TDOA algorithm through two layers of data fusion. The MATLAB simulation result shows that, by using data fusion, compared to the conventional TDOA algorithm, this algorithm has a higher accuracy. Compared to conventional RSSI algorithm, it eliminates measurement errors caused by RSSI singular values.
Introduction
With the continuous development of science and technology, users’ demand for real-time positioning services is getting higher and higher. The location service is divided into two parts: one is outdoor positioning, mainly based on satellite positioning system such as: the U.S. global positioning system (GPS), Chinese Beidou navigation system, and positioning system based on cellular data networks including base station positioning services provided by mobile operators and assisted GPS(A-GPS); the two is indoor positioning, due to various obstructions, satellite signal is disturbed, and the base station location service lacks necessary altitude information, it cannot meet the requirements of precision. So GPS/AGPS is not suitable for indoor environment. Therefore, research institutions and scholars have proposed some indoor positioning methods, such as positioning system based on Bluetooth, infrared, Wi-Fi, wireless sensor networks. But Bluetooth and infrared positioning system require additional equipment, and have laying difficulty and high cost of hardware. What’s more, in shopping malls, office buildings and other crowded areas, it is easy to be disturbed by non-line-of-sight (NLOS) and multipath propagation. So it does not apply.
Since the IEEE 802.11 series agreement and the standard of wireless local area network (WLAN) came out, WLAN access points have been rapidly deployed indoors. Currently there are various localization algorithm based on different principles, such as received signal strength indication (RSSI) [1], angle of arrival (AOA)[2], time of arrival (TOA)[3] and time of arrival difference (TDOA)[2].But because of the complex wireless communication environment, single positioning algorithms can’t achieve the desired positioning accuracy and efficiency. Thus multi-algorithms, multi-data fusion research is the future trend of indoor positioning algorithms. After studying the existing localization algorithm, we proposed improved dynamic RSSI-TDOA weighted fusion algorithm.
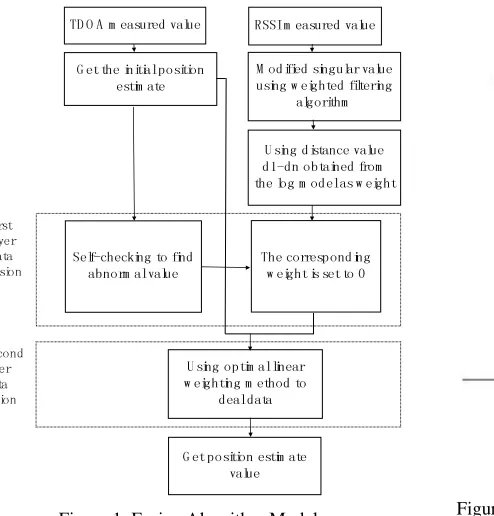
Improvement Dynamic RSSI-TDOA Weighted Fusion Algorithm
between the mobile device and the base stations involved in the calculation provided by RSSI algorithm asweight value of initial position estimation value. Use linear normalization, fuse initial estimation value and obtained weight value to get final estimation value.
TD O A m easured value RSSI m easured value
G et the initial position
estim ate M odified singular value using w eighted filtering algorithm
U sing distance value d1-dn obtained from the log m odel as w eight
U sing optim al linear w eighting m ethod to
deal data
The corresponding w eight is set to 0
G et position estim ate value Self-checking to find
abnorm al value First
layer data fusion
Second layer data fusion
Figure 1. Fusion Algorithm Model. Figure 2. Positioning diagrammatic drawing for TDOA
algorithm.
TDOA Algorithm. In this algorithm, through measuring the time difference between the Wi-Fi signals arriving to the two APs, the TDOA value could be obtained. If we have three APs, the mobile terminal is located on the intersection point coordinates of the hyperbola. With more than three APs, we can get multi hyperbolic equation, if the communication process and the measuring process are in the ideal state, the multi hyperbolic equation will intersect at one point, and the intersection point will be the coordinates of the mobile terminal.
From theoretical point of view, the more the base station, the higher positioning accuracy will be. However, too many base stations will lead to an increase of calculation amount and error, so that the system complexity will increase[4]. Thus the selection of the base station should take coordination as first, not the quantity.
As shown in Figure 2, N(x, y) is unknown node, AP is the base station. As long as arbitrary three APs are involved in the calculation, a pair of hyperbolic can be obtained, and the intersection is the estimated position of the unknown node.
Improved Dynamic RSSI Algorithm. In this paper, the improved dynamic RSSI algorithm includes two parts: the filter algorithm and the signal attenuation model. The filtering algorithm also contains two steps: the correcting singular value and the weighted filtering method.
1. Correcting singular value
(1) Measure the minimum hop of each anchor node.
Each AP will broadcast the data packet containing its own position information and the initial value of hop value as 0 to the entire network. Each AP selects the smallest hop in all the packets received, and then adds the hop value by 1 to the neighbor node. Through this method, all APs will obtain the minimum hop count and position information of other APs.
(2) The calculation and broadcasting of the correction value.
The anchor node calculates the average hop distance to other APs according to the hop information of other APs. The flooding method is used to broadcast the average hop distance in the whole network. Each AP retains only one correction value and will not receive other data pocket any more.
[image:2.612.92.339.108.366.2]The unknown node updates its data sheet by using the average hop distance of the whole network.
(4) Least Square Method.
At present, the least square method is commonly used to calculate the error of the whole positioning system according to the measured distance deviation among anchor nodes [5], and the error compensation is performed.
The final actual distance of positioning algorithm:
= average hop distance × hop value × 1 + distance deviation[] (1) The accuracy of average hop distance estimated value is positively correlated with the estimated distance accuracy of the unknown node.
2. Weighting Filter Method
This paper uses weighting filter method to deal with the data after the correction of singular value. Filtering window should not be too large, because when the unknown node is in movement, too large filter window may cause more errors and requires a greater amount of work. The relevant level of can be expressed by the following formula:
=|!
"#!$| (2)
In the formula, represents the weight of adjacent points; % represents the signal intensity of ith point adjacent to the measuring point; %& represents the signal intensity of the measuring point.
%&
'''' =∑+",-)"∙!"
∑+",-)"
(3)
In the formula: %''''& represents the signal intensity estimated value from adjacent point to the measuring point; represents the weight of adjacent points; %&represents the signal intensity of ith point adjacent to the measuring point
According to the average filter method:
R0/ =1'''''312 2
4 (4) Due to formula (2), (3) and (4)
R0/ =
∑86,-56∙76 ∑86,-56 312
4 (5) In the formula: %&0 represents the signal strength after being processed by filtering algorithm 3. Logarithm Path Loss Model
In the hotspot region where Wi-Fi is deployed, communication environment is non-ideal space. The signal spread will be interfered by shelter, complex electronic signals, multipath effect and other factors. These factors will produce larger errors in signal strength received by mobile terminal, and reduce the positioning accuracy. The logarithm path loss model can better simulate the loss situation in space. The mathematical formula of logarithmic loss model is known as follows:
PL[;<]= PLd= + 10γ log=;;
@ + XB[;<] (6)
In the formula, γ represents the path loss coefficient, which reflects the loss degree in actual propagation environment; =represents the reference distance, which can assume the reference distance as 1m or 10m; CD= represents the reception power value of reference distance;
represents the distance between send-receive parties.
to obtain higher accuracy and better stability, this paper proposes the TDOA algorithm combined with the improved dynamic RSSI algorithm, in which the two layers of data are fused.
1. The first layer of data fusion
It is proposed in this essay that in the initial position estimates obtained by the TDOA algorithm, the abnormal value and position in a memory matrix are determined by comparing the relative deviation[4]. The first layer data fusion is used to eliminate abnormal data. The specific methods to remove abnormal data are given as follows.
(1) According to the initial estimates obtained by the TDOA algorithm POS, CGH4,… CGHI, the mean value of the initial estimates is:
POS
''''' =JKL-3JKLM3JKLN3⋯3JKL8
P (7) (2) Using the initial estimated value to minus the mean value, the greatest deviation is the possible abnormal value, and its corresponding position should be found.
[A, B] = maxPOSP− POS''''' (8) In the formula, A is the estimate of the greatest deviation, and W is its corresponding position. (3) After finding out the position of the maximum deviation of the estimated value of the node, The corresponding distance to the mobile terminal is set to 0. Therefore, the influence of the estimated value of the deviation on the positioning result is the lowest.
2. The second Layer Data Fusion
The second layer of data fusion uses the best linear weighted method to integrate the results obtained by the TDOA algorithm and the RSSI algorithm.
(1) First of all, the X referring to the distance from the current positioning base to the unknown base station calculated by the RSSI algorithm, which can be used as the weight of the current initial position estimate.
(2) The average distance to the base station is taken as a weighting factor.
d' =∑Y;PZP (9) (3) With the linear weighted algorithm, and CGHI are fused, the final position estimate is determined by the following formula:
POS =∑Y;P×JKLPZP×;[ (10) In the formula, \ is the distance from the mobile terminal to APs, and CGH\ is the initial position estimate.
Simulation Result Analysis
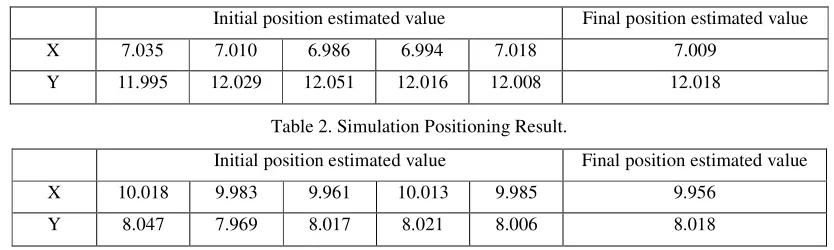
Table 1. Simulation Positioning Result.
Initial position estimated value Final position estimated value
X 7.035 7.010 6.986 6.994 7.018 7.009
[image:4.612.96.513.576.701.2]Y 11.995 12.029 12.051 12.016 12.008 12.018
Table 2. Simulation Positioning Result.
Initial position estimated value Final position estimated value
X 10.018 9.983 9.961 10.013 9.985 9.956
Y 8.047 7.969 8.017 8.021 8.006 8.018
The simulation environment is as follows: Assume the space range is 20*20, 4 APs respectively locate in 4 vertices of the region, namely: (0, 0), (0, 20), (20, 20), (20, 0). The path loss model is the logarithm path loss model, which is used to simulate indoor environment. Gauss white noise is added in the channel. The measurement error and noise error are added during simulation process, in order to simulate the error of the mobile terminal itself and the interference of other electronic devices. In this paper, the root mean square error(RMSE) of positioning result is chosen as the parameter to measure the positioning accuracy.
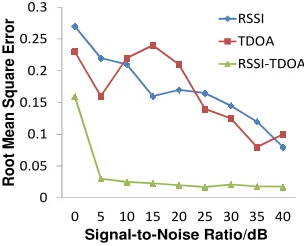
In this paper, two simulations are carried out. The first simulation is used to verify the positioning accuracy of RSSI-TDOA fusion algorithm. The second simulation is used to compare the positioning accuracy among general TDOA algorithm, RSSI algorithm and RSSI-TDOA algorithm. 0 0.02 0.04 0.06 0.08 0.1 0.12 0.14 0.16 0.18 0.2
0 5 10 15 20 25 30 35 40
[image:5.612.209.402.214.342.2]P o s it io n E rr o r/ m Signal-to-Noise Ratio/dB
Figure 3. Fusion Algorithm Positioning Accuracy.
0 0.05 0.1 0.15 0.2 0.25 0.3
0 5 10 15 20 25 30 35 40
Ro o t M e a n S q u a re E rr o r Signal-to-Noise Ratio/dB RSSI TDOA RSSI-TDOA
Figure 4. Comparison of Root-Mean-Square Error.
In simulation 1, two groups of data are randomly selected and their actual positions are (7.000, 12.000) and (10.000, 8.000). Table 1 and Table 2 respectively show the initial position estimates and the final position estimates after data fusion of the two groups of data.
In Figure 3, the error of RSSI-TDOA position estimate is given. In the simulation, change the signal-to-noise ratio to obtain multiple sets of data. The adoptive signal-to-noise ratio is respectively [0, 5, 10, 15, 20, 25, 30, 35, 40]. Carry out 50 simulation experiments for each signal-to-noise ratio to obtain position estimate value and its error. From the graph we can see that the error of the position estimate decreases with the increase of the signal-to-noise ratio, that is, the more accurate the position will be. Therefore, it can be known that the improvement of the signal-to-noise ratio is beneficial to the improvement of positioning accuracy.
[image:5.612.208.360.372.495.2]Summary
For existing indoor location studies, single positioning algorithm can’t meet the demands of positioning accuracy. Taking the existing problems into account, this paper, proposes dynamic improved RSSI-TDOA weighted fusion positioning algorithm. The accuracy of TODA algorithm is improved by optimizing the selection of base station and removing anomaly location estimated value. In combination with logarithmic path loss model, influence of environment on signal intensity is reduced by correcting singular value to obtain more accurate distance information. Errors are further reduced by two layers of data fusion. According to the simulation results, the proposed localization algorithm is more effective than conventional TDOA algorithm and RSSI algorithm in improving positioning accuracy and stability.
Acknowledgement
This research was financially supported by: European Framework Program (FP7) under Grant No. FP7-PEOPLE-2011-IRSES and National Sci-Tech Support Plan of China under Grant No. 2014BAH02F03.
Reference
[1]Li-bo Pan. Research and implementation of wireless location algorithm based on WI-FI technology [D]. Hang Zhou: Zhejiang University, 2013.
[2]You-hua Shi. Research on localization algorithm based on TDOA and AOA in cellular networks[D]. Harbin: Harbin Institute of Technology, 2005.
[3]Xin Wang, Zong-xin Wang, Bob O’Dea. A TOA-based location algorithm reducing the errors due to non-line-of-sight (NLOS) propagation[J]. IEEE Transactions on Vehicular Technology, 2003, 52(1):112-116.
[4]Juan Du, Shi-wen Li. A TDOA location algorithm based on mathematical model [J]. Global Market Information Guide, 2014, (07):131~132.