http://dx.doi.org/10.4236/ojs.2015.52012
Estimation of the Population Mean Using
Paired Ranked Set Sampling
B. S. Biradar1, C. D. Santosha2
1Department of Studies in Statistics, University of Mysore, Mysore, India
2All India Institute of Speech and Hearing, Mysore, India
Email: [email protected], [email protected]
Received 24 February 2015; accepted 1 April 2015; published 13 April 2015
Copyright © 2015 by authors and Scientific Research Publishing Inc.
This work is licensed under the Creative Commons Attribution International License (CC BY).
http://creativecommons.org/licenses/by/4.0/
Abstract
In the situation where the sampling units in a study can be easily ranked than quantified, the ranked set sampling methods are found to be more efficient and cost effective as compared to SRS. In this paper we propose an estimator of the population mean using paired ranked set sampling (RSS) method. The proposed estimator is an unbiased estimator of the population mean when the set size is even. In case of odd set size the estimator is unbiased when the underlying distribution is symmetric. It is shown that the proposed estimator is more efficient than its counterpart SRS method for all distributions considered in this study.
Keywords
Ranked Set Sampling, Paired Ranked Set Sampling, Population Mean, Relative Efficiency, Errors in Ranking
1. Introduction
re-peated r times to obtain a sample of size n = rm. These chosen elements are called a ranked set sample.
Dell and Clutter [3] and Takahasi and Wakimoto [4] provided mathematical foundations for RSS. Dell and Clutter [3] also showed that the estimator for population mean based on RSS is at least as efficient as the esti-mator based on SRS with the same number of measurements even when there were ranking errors. Samawi et al. [5] used extreme ranked set sample (ERSS) in case of even sample size which is easier to use than the usual RSS procedure to estimate the population mean. Muttlak [6] proposed the use of median ranked set sampling (MRSS) method for estimating the population mean. Muttlak [7] investigated quartile ranked set sampling (QRSS) for estimating the population mean. Jemain et al. [8] suggested balanced groups ranked set sampling (BGRSS) for estimating population mean. Biradar and Santosha [9] studied the use of extremes RSS for estimating population mean. Recent summaries of RSS literature appear in two survey articles by Wolfe [10] [11] and a monograph by Chen et al. [12]. These procedures are based on quantification of single unit from each sample. However, more than one order statistics from each sample contain additional information about the unknown parameter. There-fore it is sensible to have more than one quantified observations (order statistics) from each sample to construct an estimator or test of a hypothesis. Recently, Balci et al. [13] introduced two modified RSS by choosing two elements from each sample. They have studied modified maximum likelihood estimator (MMLE) and best linear unbiased estimator (BLUE) when the underlying distribution is normal. The main objective of this paper is to propose a nonparametric estimator using these paired RSS and to compare with estimators based on SRS and extremes RSS (RSS (E)) recently studied by Biradar and Santosha [9] under both perfect and imperfect ranking (with errors in ranking).
2. Ranked Set Sampling by Choosing Diagonals of Samples (RSS (D))
Balci et al. [13] introduced modified RSS by choosing paired units from each sample and they have called this sampling scheme as RSS (D).
The procedure of RSS (D) is described as follows: 1) Select m simple random samples each of size m.
2) Each sample is ranked in itself as in ranked set sampling design.
3) Then the i-th smallest and (m + i − 1)-th largest order statistics from i-th sample for i=1, 2,,m are measured.
4) Repeat above steps r times until the desired sample size n = 2rm is obtained.
We assume that the i-th lowest and (m + i − 1)-th largest units of this set can be detected visually, or by any other means easily.
Let X X1, 2,,X2m be a random sample of size 2m with probability density function f(x) with a finite mean µ and variance σ2. Let X be the mean of the SRS of size 2m. The mean and variance of X are known to be E X
( )
=µ and Var X( )
=σ2 2m, respectively. Let{
}
1, 2, ,
i i im
X X X , i=1, 2,,m be m sets of inde-pendent random samples each of size m from a population with distribution function F(x) and probability densi-ty function f(x) with mean µ and variance σ2. Let Xi i( ) and Xi m( + −1i) denote the i-th and (m + 1 − i)-th order statistics of the i-th sample respectively,
(
i=1, 2,,m)
. Then( ) ( ) ( ) ( ) ( ) ( ) ( ) ( )
{
X1 1,X1m,X2 2 X2m−1,,Xi i ,Xi m+ −1i,,Xm m,Xm1}
is a RSS (D) of size 2m. Note that the order statistics within the sample are dependent and between the samples are independent. For all i=1, 2,,m, let
( )i E X
( )
i i( )µ = ,
(m1i) E X
(
i m( 1i))
µ + − = + − ,
( )2i Var X
( )
i i( )σ = ,
(2m1i) Var X
(
i m( 1i))
σ + − = + − ,
(i m, 1i) Cov X
(
i i( ),Xi m( 1i))
The estimator of the population mean based on RSS (D) can be defined in case of even sample size m as
( ) ( )
(
1)
1
1
. 2
m
D i i i m i
i
X X X
m = + −
=
∑
+ (1)The mean and variance of XD can be shown to be
( )
DE X =µ
and
( )
2(
( )2 (2 1 ) 2,( 1 ))
11
2 .
4 m
D i m i i m i
i Var X
m = σ σ + − σ + −
=
∑
+ + (2)In case of an odd sample size m, the estimator of the population mean can be defined as
(
)
( ) ( 1 )1 1 1 2 1 . 2 1 m m
D i i i m i
i i
m i
X X X
m = = + −
+ ≠ = + −
∑
∑
(3)And it follows that
( )
(
)
2 ( )2 (2 1 ) ,( 1 )1 1 1
1 1
2 2
1
2 .
2 1
m m m
D i m i i m i
i i i
m m
i i
Var X
m
σ σ + − σ + −
= = = + + ≠ ≠ = + + −
∑
∑
∑
(4)If the underlying distribution is symmetric about zero, then X( )i d−X(m+ −1 i) for i=1, 2,,m. Arnold et al. [14] have shown that µ( )i = −µ(m+ −1i) and σ( )2i =σ(2m+ −1i) for i=1, 2,,m. This implies that if m is odd,
( )
(m1 2) 0
µ + = =µ
Using the above results for odd sample size E X
( )
D =0 and( )
(
)
(
( ))
2 2
( ) , 1 1
2 1 2 1 2 2 1 . 2 2 1 m
D i i m i m
i m i Var X
m
σ σ + − σ +
= + ≠ = + + −
∑
(5)3. Efficiency
The efficiency of XD with respect to X for estimating the population mean is defined as
(
D,)
( )
( )
.D Var X
Eff X X
Var X =
Similarly, we compare the proposed estimator XD with the estimator based on RSS (E) studied by Biradar and Santosha [9]. Denote
( )1 min
{
i1, i2, , im}
iX = X X X and Xi m( ) =max
{
Xi1,Xi2,,Xim}
, i=1, 2,,m.Then
( ) ( ) ( ) ( ) ( ) ( )
{
X1 1,X1m,X2 1X2m,,Xm1,Xm m}
is a RSS (E) of size 2m. For all i=1, 2,,m, let µ( )1 =E X
( )
i( )1 , µ( )m =E X( )
i m( ) , ( )2( )
( ) 1 Var Xi1σ = ,
( )2m Var X
( )
i m( )is defined by
( ) ( )
(
1)
1
1 2
m
E i i m
i
X X X
m =
=
∑
+ (6)where ( )1 ( )1 1
1 m i i
X X
m =
=
∑
and ( ) ( )1
1 m
m i m
i
X X
m =
=
∑
.Note that if the underlying distribution is symmetric about its mean then XE is an unbiased estimator of the population mean.
The variance of the of XE is given by
( )
(
( )21 ( )2 ( )1,)
1
2 .
4
E m m
Var X
m σ σ σ
= + + (7)
The efficiency of XD with respect to XE for estimating the population mean is defined as
(
D, E)
( )
( )
E .D Var X
Eff X X
Var X =
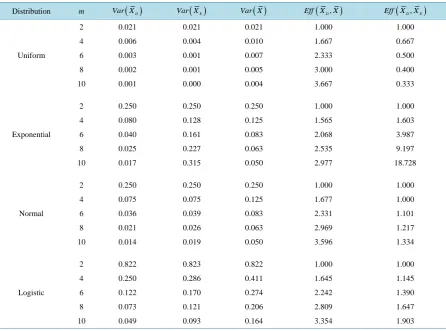
[image:4.595.91.538.387.718.2]The relative efficiencies were computed for m = 2(2)10 and are presented in Table 1. Considering the results in Table 1, a gain in efficiency is obtained by using RSS (D) for different values of m and for all the distribu-tions considered in this study. The estimator XD is more efficient than the XE in the case of exponential, normal and logistic distributions. In the case of uniform distribution Eff X
(
D,XE)
is 1 for m = 2 and then de-creases for m≥4.Table 1. The variances and relative efficiencies of estimators of population mean using RSS (E), RSS (D), SRS.
Distribution m Var X( )D Var X( )E Var X( ) Eff X( D,X) Eff X( D,XE)
Uniform
2 0.021 0.021 0.021 1.000 1.000
4 0.006 0.004 0.010 1.667 0.667
6 0.003 0.001 0.007 2.333 0.500
8 0.002 0.001 0.005 3.000 0.400
10 0.001 0.000 0.004 3.667 0.333
Exponential
2 0.250 0.250 0.250 1.000 1.000
4 0.080 0.128 0.125 1.565 1.603
6 0.040 0.161 0.083 2.068 3.987
8 0.025 0.227 0.063 2.535 9.197
10 0.017 0.315 0.050 2.977 18.728
Normal
2 0.250 0.250 0.250 1.000 1.000
4 0.075 0.075 0.125 1.677 1.000
6 0.036 0.039 0.083 2.331 1.101
8 0.021 0.026 0.063 2.969 1.217
10 0.014 0.019 0.050 3.596 1.334
Logistic
2 0.822 0.823 0.822 1.000 1.000
4 0.250 0.286 0.411 1.645 1.145
6 0.122 0.170 0.274 2.242 1.390
8 0.073 0.121 0.206 2.809 1.647
4. Paired Ranked Set Sampling with Errors in Ranking
Dell and Clutter [3] considered the case in which there were errors in ranking; that is the quantified observation from the i-th sample may not be the i-th order statistic rather the i-th judgement order statistic. They showed that sample mean of RSS with errors in ranking was an unbiased estimator of the population mean regardless of the errors in ranking, and has smaller variance than the usual estimator based on SRS with same sample size. But the variance of the estimator with errors in ranking will be larger than the variance of the estimator with perfect ranking and less than or equal to the variance of the estimator based on SRS.
Let Xi i[ ] and Xi m[ + −1i] denote the i-th and (m + 1 − i)-th judgemnet order statistics of the sample for 1, 2, ,
i= m. Then
[ ] [ ] [ ] [ ] [ ] [ ] [ ] [ ]
{
X1 1,X1m,X2 2X2m−1,,Xi i,Xi m+ −1i,,Xm m,Xm1}
denote RSS (D) sample with errors in ranking. The estimators of the population mean using RSS (D) with errors in ranking is defined as
[ ] [ ]
(
1)
1
1
, when is even, 2
m
D i i i m i
i
X X X m
m = + −
=
∑
+ (8)
(
)
[ ] [ 1 ]1 1
1 2
1
, when is odd,
2 1
m m
D i i i m i
i i
m i
X X X m
m = = + −
+ ≠ = + −
∑
∑
(9)
with variance
( )
2(
[ ]2 [2 1 ] ,[ 1 ])
1
1
2 , if is even, 4
m
D i m i i m i
i
Var X m
m = σ σ + − σ + −
=
∑
+ + (10)and
( )
(
)
2 [ ]2 [2 1 ] (2[ ] [, 1 ])1 1 1
1 1
2 2
1
2 , if is odd.
2 1
m m m
D i m i i m i
i i i
m m
i i
Var X m
m = σ = σ + − = σ + −
+ + ≠ ≠ = + + −
∑
∑
∑
(11)To gain some insight of the effect of ranking errors on the efficiencies of the estimators various simulation trails were conducted. We use the simulation method considered by Dell and Clutter [3] and David and Lavine [15]. In the first stage we generate m sets of simple random samples
{
Xi1,Xi2,,Xim}
, i=1, 2,,m from uniform, normal, exponential and logistic distributions. The corresponding m sets of random error variables{
e ei1, i2,,eim}
, i=1, 2,,m are generated from normal distribution with mean zero and variance2
σ . Define
, 1, 2, , 1, 2, , ,
ij ij ij
Z = X +e i= m j= m
where Xij and eij are independent. The sets of
(
Zij,Xij)
i=1, 2,,m, j=1, 2,,m are ranked with respect to the first components of(
Z( )i i:,X[ ]i i:)
. The second components are taken as judgement ranked orderstatistics.
Now the RSS (D) and RSS (E) procedures were used to get the values of the estimators for population mean. Based on 10,000 simulated samples estimates of means and varainces or mean squared error (MSE) of estimators were computed. These trails were run with standard deviation set at 0.05, 0.25, 0.5 and 0.75. The results are presented inTable 2andTable 3.
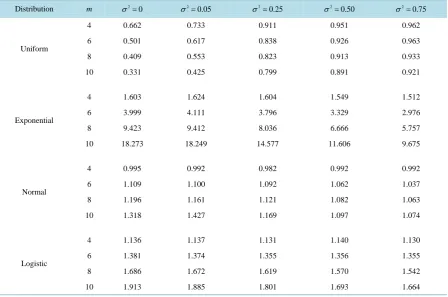
The efficieny values in Table 2 suggest that for all the cases (for allvalues of m and distributions considered here) RSS (D) estimator is more efficient than the SRS estimator in the presence of erros in ranking. Table 2
Table 2. The relative efficiencies of estimators of population mean based on RSS (D) w.r.t. SRS.
Distribution m 2
0
σ = 2
0.05
σ = 2
0.25
σ = 2
0.50
σ = 2
0.75
σ =
Uniform
4 1.688 1.327 1.111 1.064 1.039
6 2.291 1.608 1.189 1.126 1.102
8 3.044 1.757 1.196 1.106 1.051
10 3.698 1.889 1.223 1.115 1.058
Exponential
4 1.585 1.504 1.386 1.303 1.264
6 2.004 1.919 1.692 1.521 1.416
8 2.555 2.321 1.940 1.800 1.583
10 2.979 2.811 2.223 1.893 1.719
Normal
4 1.670 1.593 1.433 1.340 1.268
6 2.303 2.223 1.893 1.656 1.521
8 2.855 2.660 2.128 1.790 1.607
10 3.481 3.117 2.324 1.869 1.658
Logistic
4 1.683 1.652 1.586 1.538 1.482
6 2.195 2.160 2.023 1.916 1.824
8 2.796 2.715 2.460 2.460 2.248
10 3.397 3.207 2.852 2.498 2.299
Table 3.The relative efficiencies of estimators of population mean based on RSS (D) w.r.t. RSS (E).
Distribution m 2
0
σ = 2
0.05
σ = 2
0.25
σ = 2
0.50
σ = 2
0.75
σ =
Uniform
4 0.662 0.733 0.911 0.951 0.962
6 0.501 0.617 0.838 0.926 0.963
8 0.409 0.553 0.823 0.913 0.933
10 0.331 0.425 0.799 0.891 0.921
Exponential
4 1.603 1.624 1.604 1.549 1.512
6 3.999 4.111 3.796 3.329 2.976
8 9.423 9.412 8.036 6.666 5.757
10 18.273 18.249 14.577 11.606 9.675
Normal
4 0.995 0.992 0.982 0.992 0.992
6 1.109 1.100 1.092 1.062 1.037
8 1.196 1.161 1.121 1.082 1.063
10 1.318 1.427 1.169 1.097 1.074
Logistic
4 1.136 1.137 1.131 1.140 1.130
6 1.381 1.374 1.355 1.356 1.355
8 1.686 1.672 1.619 1.570 1.542
[image:6.595.91.540.425.722.2]From Table 3 we can observe that except for uniform distribution RSS (D) estimator performs better than RSS(E) estimator in the presence of errors in ranking. In the case of exponential, normal and logistic distri- butions the efficency values increase with m and decrease with errors in ranking. For uniform distribution the opposite trend can be observed, i.e., efficency values increase with σ2 and decrease with set size m. This indicates that RSS (D) estimator for uniform dustribution improves with samller set size m and larger extent of errors in ranking.
References
[1] McIntyre, G.A. (1952) A Method for Unbiased Selective Sampling Using Ranked Sets. Australian Journal of Agricul-tural Research, 3,385-390. http://dx.doi.org/10.1071/AR9520385
[2] McIntyre, G.A. (2005) A Method for Unbiased Selective Sampling, Using Ranked Sets. The American Statistician, 59, 230-232. Originally Appeared in Australian Journal of Agricultural Research, 3, 385-390.
http://dx.doi.org/10.1198/000313005X54180http://dx.doi.org/10.1071/AR9520385
[3] Dell, T.R. and Clutter, J.L. (1972) Ranked Set Sampling Theory with Order Statistics Background. Biometrics, 28, 545-555. http://dx.doi.org/10.2307/2556166
[4] Takahasi, K. and Wakimoto, K. (1968) On Unbiased Estimates of the Population Mean Based on the Sample Stratified by Means of Ordering. Annals of the Institute of Statistical Mathematics, 20, 1-31. http://dx.doi.org/10.1007/BF02911622
[5] Samwi, H., Ahmad, M. and Abu-Dayyeh, W. (1996) Estimating the Population Mean Using Extreme Ranked Set Sam-pling. Biometrical Journal, 38, 577-586. http://dx.doi.org/10.1002/bimj.4710380506
[6] Muttlak, H.A. (1997) Median Ranked Set Sampling. Journal of Applied Statistical Sciences, 6, 245-255.
[7] Muttlak, H.A. (2003) Investigating the Use of Quartile Ranked Set Samples for Estimating the Population Mean. Journal of Applied Mathematics and Computation, 146, 437-443. http://dx.doi.org/10.1016/S0096-3003(02)00595-7
[8] Jemain, A.A., Al-Omari, A. and Ibrahim, K. (2008) Some Variations of Ranked Set Sampling. Electronic Journal of Applied Statistical Analysis, 1, 1-15.
[9] Biradar, B.S. and Santosha, C.D. (2015) Estimation of the Population Mean Based on Extrmemes Ranked Set Sam-pling. American Journal of Mathematics and Statistics, 5, 32-36.
[10] Wolfe, D.A. (2004) Ranked Set Sampling: An Approach to More Efficient Data Collection. Statistical Science, 19, 636-643. http://dx.doi.org/10.1214/088342304000000369
[11] Wolfe, D.A. (2010) Ranked Set Sampling. Wiley Interdisciplinary Reviews: Computational Statistics, 2, 460-466. http://dx.doi.org/10.1002/wics.92
[12] Chen, Z.H., Bai, Z.D. and Sinha, B.K. (2004) Ranked Set Sampling: Theory and Applications. Springer, New York. http://dx.doi.org/10.1007/978-0-387-21664-5
[13] Balci, S., Akkaya, A.D. and Ulgen, B.E. (2013) Modified Maximum Likelihood Estimators Using Ranked Set Sam-pling. Journal of Computational and Applied Mathematics, 238,171-179. http://dx.doi.org/10.1016/j.cam.2012.08.030 [14] Arnold, B.C., Balkrishna, N. and Nagaraj, H.N. (1992) A First Course in Order Statistics. John Wiley and Sons, New
York.