Dual modulation of MCL-1 and mTOR determines the response
to sunitinib
Mohamed Elgendy, … , Giuseppe Renne, Saverio Minucci
J Clin Invest. 2017;127(1):153-168. https://doi.org/10.1172/JCI84386.
Most patients who initially respond to treatment with the multi–tyrosine kinase inhibitor sunitinib eventually relapse. Therefore, developing a deeper understanding of the contribution of sunitinib’s numerous targets to the clinical response or to resistance is crucial. Here, we have shown that cancer cells respond to clinically relevant doses of sunitinib by enhancing the stability of the antiapoptotic protein MCL-1 and inducing mTORC1 signaling, thus evoking little cytotoxicity. Inhibition of MCL-1 or mTORC1 signaling sensitized cells to clinically relevant doses of sunitinib in vitro and was
synergistic with sunitinib in impairing tumor growth in vivo, indicating that these responses are triggered as prosurvival mechanisms that enable cells to tolerate the cytotoxic effects of sunitinib. Furthermore, higher doses of sunitinib were cytotoxic, triggered a decline in MCL-1 levels, and inhibited mTORC1 signaling. Mechanistically, we determined that sunitinib modulates MCL-1 stability by affecting its proteasomal degradation. Dual modulation of MCL-1 stability at different dose ranges of sunitinib was due to differential effects on ERK and GSK3β activity, and the latter also accounted for dual modulation of mTORC1 activity. Finally, comparison of patient samples prior to and following sunitinib treatment suggested that increases in MCL-1 levels and mTORC1 activity correlate with resistance to sunitinib in patients.
Research Article Cell biology Oncology
Find the latest version:
Introduction
Sunitinib malate is an orally available multitargeted tyrosine kinase inhibitor. As a competitive ATP antagonist, sunitinib inhibits the phosphorylation of several tyrosine kinase receptors including VEGFR, PDGFR, and stem cell factor receptor (c-KIT) (1). Sunitinib is approved for treating patients with advanced renal cell carcinoma (2), pancreatic neuroendocrine tumors (3), and gastrointestinal stromal tumors (4, 5) and is being tested in other types of cancer including osteosarcoma (6), colorectal cancer (7), and melanoma (8). However, a substantial percentage of patients are intrinsically resistant to sunitinib, and most patients who show initial response to treatment with sunitinib eventually relapse and develop progressive disease secondary to acquired sunitinib resistance, resulting in a modest overall therapeutic benefit (9–13). Optimal clinical use of sunitinib therefore relies on better under-standing of the mechanisms of tumor resistance to this anticancer agent. While the mechanisms of intrinsic resistance remain
large-ly elusive, a few studies have attempted to identify the molecular mechanisms of acquired resistance of cancer cells to sunitinib. However, to date, in-depth insights into the molecular basis of sunitinib resistance are still lacking.
The BCL-2 family of proteins is a group of proteins that acts as crucial regulators of cell survival and death, and as such, they also play an essential role in determining the response to chemothera-peutic agents (14). Balance between pro- and antiapoptotic mem-bers of the BCL-2 family dictates the fate of cells and ultimately the sensitivity or tolerance of cancer cells to drugs (14, 15). Anti-apoptotic BCL-2, BCL-XL, and MCL-1 act as prominent oncopro-teins through their capacity to protect cancer cells from apoptosis (16). Among the antiapoptotic BCL-2 proteins, MCL-1 stands out as a unique member of the family by exhibiting unshared fea-tures related to its complex regulation and short half-life (17, 18). Tight MCL-1 regulation coupled with its short half-life hints that its activities may be finely tuned in response to different cellular stresses. MCL-1 is among the most highly upregulated oncopro-teins in several types of tumors and has been shown to directly contribute to chemoresistance of those tumors (19–22). Targeting MCL-1 is therefore emerging as a promising therapeutic strategy, with several inhibitors under development (19, 23–25).
Most patients who initially respond to treatment with the multi–tyrosine kinase inhibitor sunitinib eventually relapse. Therefore, developing a deeper understanding of the contribution of sunitinib’s numerous targets to the clinical response or to resistance is crucial. Here, we have shown that cancer cells respond to clinically relevant doses of sunitinib by enhancing the stability of the antiapoptotic protein MCL-1 and inducing mTORC1 signaling, thus evoking little cytotoxicity. Inhibition of MCL-1 or mTORC1 signaling sensitized cells to clinically relevant doses of sunitinib in vitro and was synergistic with sunitinib in impairing tumor growth in vivo, indicating that these responses are triggered as prosurvival mechanisms that enable cells to tolerate the cytotoxic effects of sunitinib. Furthermore, higher doses of sunitinib were cytotoxic, triggered a decline in MCL-1 levels, and inhibited mTORC1 signaling. Mechanistically, we determined that sunitinib modulates MCL-1 stability by affecting its proteasomal degradation. Dual modulation of MCL-1 stability at different dose ranges of sunitinib was due to differential effects on ERK and GSK3β activity, and the latter also accounted for dual modulation of mTORC1 activity. Finally, comparison of patient samples prior to and following sunitinib treatment suggested that increases in MCL-1 levels and mTORC1 activity correlate with resistance to sunitinib in patients.
Dual modulation of MCL-1 and mTOR determines
the response to sunitinib
Mohamed Elgendy,1 Amal Kamal Abdel-Aziz,1,2 Salvatore Lorenzo Renne,3 Viviana Bornaghi,1 Giuseppe Procopio,4
Maurizio Colecchia,3 Ravindran Kanesvaran,5,6 Chee Keong Toh,7 Daniela Bossi,1 Isabella Pallavicini,1 Jose Luis Perez-Gracia,8
Maria Dolores Lozano,9 Valeria Giandomenico,10 Ciro Mercurio,11 Luisa Lanfrancone,1 Nicola Fazio,12 Franco Nole,13
Bin Tean Teh,6,14,15,16 Giuseppe Renne,17 and Saverio Minucci1,18,19
1Department of Experimental Oncology, European Institute of Oncology (IEO), Milan, Italy. 2Department of Pharmacology and Toxicology, Faculty of Pharmacy, Ain Shams University, Cairo, Egypt. 3Department of Pathology and Laboratory Medicine, Fondazione IRCCS Istituto Nazionale dei Tumori, Milan, Italy. 4Genitourinary Oncology Unit, Fondazione IRCCS Istituto Nazionale dei Tumori, Milan, Italy. 5Division of Medical Oncology, National Cancer Centre Singapore, Singapore. 6Duke-NUS Medical School, Singapore. 7Division of Medical Oncology, National Cancer Centre Singapore, Singapore. 8Oncology
Department, Clinica Universidad de Navarra, Pamplona, Spain. 9Department of Pathology, Clinica Universidad de Navarra, Spain. 10Department of Medical Sciences, Endocrine Tumor Biology, Uppsala
University, Uppsala, Sweden. 11Unit of Experimental Therapies, IFOM, Milan, Italy. 12Unit of Gastrointestinal Medical Oncology and Neuroendocrine Tumor, European Institute of Oncology, Milan, Italy. 13Department of Clinical Oncology, IEO, Milan, Italy. 14Division of Medical Sciences, National Cancer Centre Singapore, Singapore. 15Cancer Science Institute, Singapore. 16Institute of Molecular and Cell Biology,
Singapore. 17Department of Pathology IEO, Milan, Italy. 18Department of Biosciences, University of Milan, Milan, Italy. 19Drug Development Program, IEO, Milan, Italy.
Authorship note: M. Elgendy and A.K. Abdel-Aziz contributed equally to this work.
Conflict of interest: The authors have declared that no conflict of interest exists.
Submitted: August 25, 2015; Accepted: October 14, 2016.
The Journal of Clinical Investigation
sunitinib starts to exert evident cytotoxic effects was identified: in essentially all tested cell lines, this threshold lay beyond clin-ically relevant levels of sunitinib (0.125– 0.25 μmol/l) (33–35). Each cell line was then exposed to either tolerated (lower) or cytotoxic (higher) doses for a more in-depth molecular analysis of the mechanisms underlying the cellular responses to the drug, focusing on the BCL-2 family and mTOR signaling pathways. Immunoblotting analysis of cell lysates showed that in all of the examined cell lines, cells responded to treatment with lower (tol-erated) doses of sunitinib by markedly increasing the levels of MCL-1. Treatment also induced mTORC1 signaling, as indicat-ed by increases in the phosphorylation levels of mTORC1 targets S6K1, S6, and 4E-BP1 (Figure 1, G–I, and Supplemental Figure 1, E and F), but not mTORC2 (as assessed by phosphorylation of Akt at the serine 473 site). Interestingly, treatment with higher (cytotoxic) doses of sunitinib exerted an opposite effect, trigger-ing a decrease in MCL-1 levels and inhibition of mTORC1 signal-ing as compared with control cells treated with vehicle (Figure 1, G–I, and Supplemental Figure 1, E and F).
Besides its well-established roles in the regulation of apopto-sis, MCL-1 has recently been shown to regulate autophagy. Over-expression of MCL-1 has been shown to inhibit autophagy, while downregulation of MCL-1 has been associated with the induction of autophagy (22, 36–38). In addition, the mTOR pathway is an established master regulator of autophagy (29). Consistent with the dual effect of sunitinib on MCL-1 levels and mTOR activity observed at tolerated versus cytotoxic doses, our analysis showed that sunitinib exerts a dual effect on autophagy, as indicated by changes in established markers of autophagy (protein levels of p62/SQSTM1, a protein specifically degraded through autoph-agy, conversion of LC3I to LC3II, and formation of GFP-LC3II puncta: Supplemental Figure 2, A and B). Lower doses of sunitinib increased p62 levels and thus inhibited autophagy — probably through elevating MCL-1 levels and inducing mTOR — while high-er doses of sunitinib induced autophagy, which was concomitant with decline in MCL-1 levels and mTOR inhibition (Figure 1, G–I).
Sunitinib enhances MCL-1 levels and induces mTOR activity in vivo. We next sought to examine in a tumor xenograft model the
effect of sunitinib on BCL-2 family proteins and mTOR signal-ing in vivo. Mice bearsignal-ing established subcutaneous tumors from injected HCT-116 cells were treated with either sunitinib or vehi-cle for 10 days. Tumor growth was followed, and lysates prepared from isolated tumors from both groups were analyzed by immu-noblotting. Consistent with the observed effect of sunitinib treat-ment in vitro, tumors isolated from animals treated with sunitinib had significantly elevated levels of MCL-1 and active mTOR sig-naling as compared with tumors from the control group (Figure 2A). In contrast, there was no difference in the protein levels of BCL-2 and BCL-XL (Figure 2A). Notably, under these experimen-tal conditions, sunitinib exerted an insignificant inhibitory effect on tumor growth (Figure 2B).
Dual modulation of MCL-1 by sunitinib contributes to resistance or sensitivity of cancer cells. The differential effect of sunitinib
treat-ment on MCL-1 and mTOR at tolerated versus cytotoxic doses suggested that elevated MCL-1 levels and mTOR activation could be a cellular response to antagonize the cytotoxic effects of suni-tinib and prolong survival of cancer cells. To test this hypothesis, mTOR is another crucial factor in determining the response
of cancer cells to chemotherapeutic agents (26, 27). mTOR exerts diverse cellular functions; it acts as a crucial sensor of cellular energetics, is also a key upstream autophagy repressor, and con-trols several pathways that regulate cell survival and prolifera-tion (28–30). mTOR exists in 2 distinct complexes termed mTOR complex 1 and 2 (mTORC1 and mTORC2). mTORC1 is regulated mainly by the Ras-like small GTPase Rheb. Rheb must be in the GTP-bound state to activate mTORC1. GTP binding of Rheb is regulated by the tuberous sclerosis complex (TSC), a heterodimer of the polypeptides Hamartin (TSC1) and Tuberin (TSC2). The action of Rheb is opposed by the TSC complex. When the GAP activity of TSC2 is inhibited, Rheb accumulates in the GTP-bound state and ultimately leads to mTORC1 activation (28). Consistent with its multivalent cellular functions, the contribution of mTOR to tumorigenesis therefore occurs through multiple processes and its relevance is highlighted by the prominent role gained by drugs targeting mTOR in cancer therapy (31, 32).
In this study, we examined the adaptive prosurvival responses that tumor cells exploit for maintaining their viabili-ty and tolerating the cytotoxic effects triggered by sunitinib. We focused on the modulation of the antiapoptotic BCL-2 proteins and mTOR signaling as crucial determinants of cell survival and response to chemotherapy. We then further analyzed the relevance of those adaptive responses to intrinsic, as well as acquired, resistance of cancer cells to sunitinib.
Results
Sunitinib exerts dual effects on MCL-1 and mTOR in tolerant and sensitive cells. Initially, we profiled sunitinib against a panel of
cancer cell lines, representative of several cancer subtypes: osteosarcoma (U2OS), colon cancer (HCT116), pancreatic neu-roendocrine tumors (Bon-I), and renal cell carcinoma (ACHN and A-498). Cells were treated with a wide range of doses of sunitinib, and cell proliferation was assessed after 24 hours. As shown in Figure 1, A–F, and Supplemental Figure 1, A–D (supple-mental material available online with this article; doi:10.1172/ JCI84386DS1), different cell lines showed considerably varying degrees of sensitivity to sunitinib. For instance, while U2OS cells were highly sensitive to sunitinib and showed evident cytotoxic-ity at submicromolar concentrations of the drug, HCT116 cells showed cytotoxic effects only at concentrations of 10 μM or more (Figure 1, A and D, compared with Figure 1, C and F). In each of these cell lines, the threshold concentration beyond which
The Journal of Clinical Investigation
R E S E A R C H A R T I C L E
cific role of MCL-1 in determining the response to sunitinib (Sup-plemental Figure 4, B and C).
We next aimed at examining the effect of pharmacological depletion of MCL-1 on the response to sunitinib. We made use of the multikinase inhibitor sorafenib, which has been shown to downregulate MCL-1 levels (19, 24). Cotreatment with a subtoxic dose of sorafenib abolished sunitinib-induced MCL-1 elevation (Figure 3B). We also tested ABT737, in combination with suni-tinib, as a control for a drug targeting other BCL-2 family pro-teins, but not MCL-1 (40). The sunintinib/ABT737 combination did not alter MCL-1 induction (Figure 3B). Importantly, abolish-ing sunitinib-mediated induction of MCL-1 by the combination with a subtoxic dose of sorafenib was associated with a dramat-ic sensitization to treatment with lower dose of sunitinib, while neither of these treatments evoked apparent cell death (Figure 3C and Supplemental Figure 5, A and B). The sunintinib/ABT737 combination did not show such synergism, but if anything, suni-tinib seemed to desensitize cells to ABT737 treatment, possibly through MCL-1 stabilization, which is known to mediate resis-tance to ABT737 (40, 41). Replating equal numbers of surviving HCT116 cells from all the previous conditions in fresh medium without drugs showed that the antiproliferative effect of the suni-tinib/sorafenib combination was irreversible, as cells pretreated with this combination could not recover and died within the ensu-ing 48 hours, while cells from other treatments proliferated nor-mally (Figure 3D). Consistently, a combination of sunitinib and subtoxic doses of small molecule inhibitors obatoclax and TW-37, we first examined the effect of MCL-1 depletion on the response
of cancer cells to tolerated doses of sunitinib. MCL-1, BCL-2, and BCL-XL were individually knocked down using 2 different shRNAs (Supplemental Figure 3A). As shown in Figure 3A and Supplemen-tal Figure 3, A and B, upon sunitinib treatment, cells depleted for either BCL-2 or BCL-XL showed no or little increase in cell death compared with control cells. Cells depleted for MCL-1, however, showed a strong increase in cell death in response to the same dose of sunitinib, indicating that elevated MCL-1 levels under those con-ditions are crucial for survival and the observed tolerance of those cells to sunitinib (Figure 3A and Supplemental Figure 3, A and B).
To further investigate this observation, we made use of induc-ible Mcl1 KO mouse embryonic fibroblasts (MEFs) where tamox-ifen treatment leads to deletion of Mcl1 and complete ablation of MCL-1 protein (39). Sunitinib cytotoxicity was profiled, and a cytotoxic threshold was identified in these MEFs in the presence of MCL-1 (Supplemental Figure 4A). Cells were then treated with a subtoxic dose of sunitinib (or DMSO as control) in the presence or absence of tamoxifen. Consistent with the results obtained in other cell systems, treatment with sunitinib at a dose lower than the cytotoxic threshold led to increased MCL-1 levels (Supplemen-tal Figure 4B). Mcl1 deletion upon tamoxifen treatment greatly sensitized those MEFs to the same dose of sunitinib, which evoked evident cell death only in Mcl1-ablated cells (Supplemental Figure 4, B and C). Mcl1-deleted MEFs reconstituted with a construct encoding WT MCL-1 did not show the same magnitude of cell death upon treatment with sunitinib, further confirming the
spe-Figure 2. Sunitinib enhances MCL-1 levels and mTOR signaling in vivo.
[image:5.585.43.253.54.387.2]those conditions. Taken together, our results establish a crucial role for MCL-1 in mediating tolerance or cytotoxicity in response to sunitinib treatment.
Differential modulation of mTOR activity by sunitinib contrib-utes to resistance or sensitivity of cancer cells. We then sought to
explore the contribution of the observed activation of mTOR to sunitinib response. Depletion of mTOR by shRNA sensitized cells to treatment with tolerated doses of sunitinib, as indicated by the increase in cell death in cells infected with mTOR shRNA com-pared with control cells infected with scrambled shRNA (Figure 4, A and B, and Supplemental Figure 6, A and B). Notably, mTOR depletion did not sensitize cells to another cytotoxic agent — tuni-camycin — confirming the specificity of this effect to sunitinib which target MCL-1, exerted synergistic cytotoxic effects on all
cancer cell lines tested (Supplemental Figure 5C).
[image:6.585.99.478.55.454.2]As we observed that treatment with higher doses of sunitinib induces a drop in MCL-1 levels, we next sought to investigate the contribution of sunitinib-mediated decrease in MCL-1 levels to the cytotoxic effect observed under these conditions. To this end, comparable amounts of MCL-1 or BCL-2 and BCL-XL as control were individually overexpressed. Cells were then treated with doses of sunitinib above the cytotoxic threshold for each cell line. MCL-1 overexpression imparted significant resistance against the cell-killing effect of high doses of sunitinib (Figure 3E and Supple-mental Figure 5, D and E), clearly confirming that the decrease in MCL-1 levels contributes to the cytotoxic effect of sunitinib under
The Journal of Clinical Investigation
[image:7.585.82.474.54.616.2]R E S E A R C H A R T I C L E
rather than predisposition to cytocidal stimuli per se. Depletion of RAPTOR (but not RICTOR) sensitized cells to sunitinib in a manner similar to mTOR depletion, indicating the predominant involvement of mTORC1 in determining the response to sunitinib (Supplemental Figure 6, C and D). Furthermore, pharmacologi-cal inhibition of mTOR by subtoxic doses of rapamycin sensitized cancer cells to sunitinib, with a much higher extent of cell death as compared with cells treated with either agents alone or a com-bination of sunitinib and tunicamycin used as control (Figure 4, C and D, and Supplemental Figure 6, E and F). Washout and replat-ing of treated cells showed that sunitinib/rapamycin cotreatment evoked irreversible cytotoxic effects in HCT116 cells (Supple-mental Figure 6G). Nutrient starvation is known to be a phys-iologically relevant condition under which mTOR is markedly inhibited. We exploited this approach to further assess the effect of manipulating mTOR activity on the response to sunitinib. Our results show that mTOR deactivation in cells cultured under nutrient starvation conditions was associated with high sensitivi-ty to treatment with sunitinib but not to tunicamycin (Figure 4, E and F, and Supplemental Figure 6, H and I).
Since we observed that treatment with cytotoxic doses of sunitinib was associated with mTOR inhibition, we next aimed to study whether cell death observed under those conditions was a result of mTOR inhibition or, conversely, mTOR inactivation was caused by the decrease in cell viability. Cells constitutively expressing an active form of mTOR or control cells were chal-lenged with high doses of sunitinib. As shown in Supplemental Figure 7, A and B, cells with active mTOR were more resistant to the cytotoxic effect of sunitinib compared with control cells, indicating that inhibition of mTOR by high doses of sunitinib contributes to the induction of cell death.
mTOR activity is negatively regulated by the TSC, a heterodi-mer of the polypeptides TSC1 and TSC2. mTOR activation follow-ing TSC2 depletion renders cells resistant to high doses of suni-tinib (Supplemental Figure 7, C and D), which further confirms that inhibition of mTOR by high doses of sunitinib contributes to the cytotoxic effects observed in these conditions.
[image:8.585.44.545.53.392.2]Our results thus demonstrate that MCL-1 and mTOR are 2 major determinants of sensitivity as well as resistance to suni-tinib. To further investigate the contribution of mTOR signaling
The Journal of Clinical Investigation
R E S E A R C H A R T I C L E
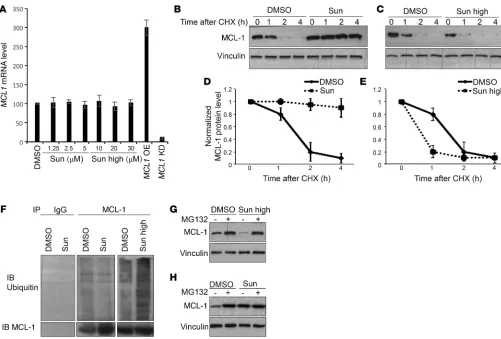
cells treated with tolerated doses of sunitinib, the half-life time of MCL-1 protein was much longer than in DMSO-treated cells (Figure 5, B and D). Conversely, in cells treated with high doses of sunitinib, the half-life time of MCL-1 protein was much shorter than in DMSO-treated cells (Figure 5, C and E). Pulse-chase exper-iments further confirmed these results (Supplemental Figure 9B). Taken together, these results indicate that sunitinib at lower doses presumably acts through increasing protein stability of MCL-1 or, conversely, high doses of sunitinib accelerate the decline in MCL-1 levels through enhancing MCL-1 degradation.
The stability of MCL-1 is controlled mainly by the ubiquitin/ proteasome pathway (17). In fact, lower doses of sunitinib reduced MCL-1 ubiquitination compared with DMSO-treated cells, while treatment with high doses of sunitinib increased MCL-1 ubiq-uitination (Figure 5F). Moreover, inhibition of proteasome with MG132 impaired the reduction of MCL-1 levels upon treatment with high doses of sunitinib, while it had almost no effect on low sunitinib–induced increases in MCL-1 (Figure 5, G and H). Collec-tively, these results indicate that sunitinib modulates MCL-1 levels by affecting its ubiquitination and proteasomal degradation.
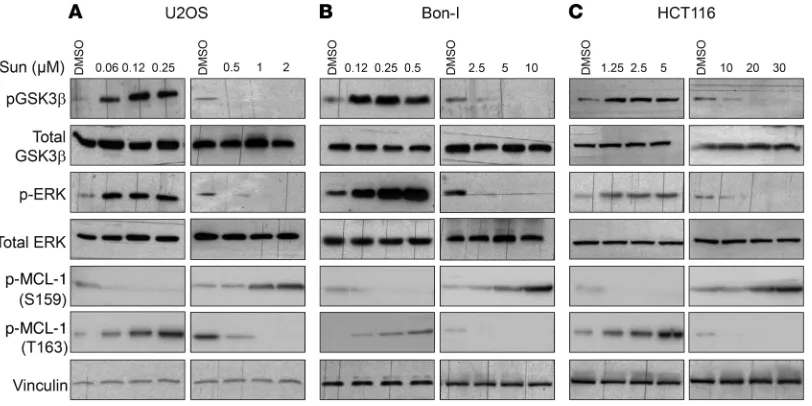
Sunitinib modulates ERK and GSK3β activity to control MCL-1
levels and mTOR activity, thus regulating the response of cancer cells to the drug. Phosphorylation of MCL-1 has been shown to
modu-late its ubiquitination, ultimately affecting its targeting to the pro-teasome for degradation (43). MCL-1 phosphorylation at Ser159 by GSK3β has been shown to enhance MCL-1 ubiquitination and proteasomal degradation (44). Conversely, phosphorylation of the PEST domain of MCL-1 at Thr163 by ERK reduces its ubiquitina-tion and enhances its stability (45). Immunoblotting analysis of cell lysates showed that tolerated doses of sunitinib induce phosphory-lation of GSK3β and ERK, while high doses of sunitinib inhibit the phosphorylation of both kinases (Figure 6, A–C). GSK3β activity is inhibited by phosphorylation (46). Tolerated doses of sunitinib therefore inactivate GSK3β and activate ERK, while higher doses activate GSK3β and inhibit ERK. Activation or inhibition of either and MCL-1 to sunitinib resistance with another experimental
approach, we examined melanoma cell lines desensitized to suni-tinib by continuous exposure to 20 μM sunitinib that was freshly added to the culture medium every 3 days for 12 weeks (42). As shown in Supplemental Figure 8, sunitinib-desensitized cells exhibit higher levels of MCL-1 and mTOR activity as compared with parental cells, further demonstrating the relevance of these newly identified axes in the acquired resistance to sunitinib.
Sunitinib modulates MCL-1 levels by controlling its ubiquitylation and proteasomal degradation. Next, we sought to get insight into
[image:9.585.72.478.56.259.2]the molecular mechanisms by which sunitinib modulates the lev-els of MCL-1. Since mTOR has been suggested to modulate the levels of MCL-1 protein, we explored the involvement of mTOR in sunitinib-induced MCL-1 modulation. Sunitinib treatment enhanced MCL-1 levels in mTOR-depleted cells to levels similar to those observed in control cells, suggesting no major role for mTOR in this process (Supplemental Figure 9A). We decided to apply a more systematic approach to determine whether sunitinib modulates MCL-1 levels through transcriptional or translational control or via regulation of MCL-1 degradation. Analysis of gene expression by real-time quantitative PCR (RT-qPCR) revealed no detectable changes in MCL1 gene expression in HCT116 cells treated with any dose of sunitinib compared with control cells treated with DMSO (Figure 5A), ruling out transcriptional con-trol as a mechanism of sunitinib-induced modulation of MCL-1. We next investigated whether mRNA translation and protein bio-synthesis play a role in sunitinib-induced modulation of MCL-1. Inhibition of de novo protein synthesis by cycloheximide failed to significantly modulate the increase or decrease in MCL-1 levels in response to treatment with lower or higher doses of sunitinib, respectively (Figure 5, B and C), ruling out a role for protein trans-lation in this process. MCL-1 is a short-lived protein that relies on de novo protein synthesis to maintain its levels. As shown in Fig-ure 5, B and C, following cycloheximide treatment, MCL-1 levels dropped readily in control cells treated with DMSO. However, in
The Journal of Clinical Investigation
[image:11.585.34.540.55.606.2]R E S E A R C H A R T I C L E
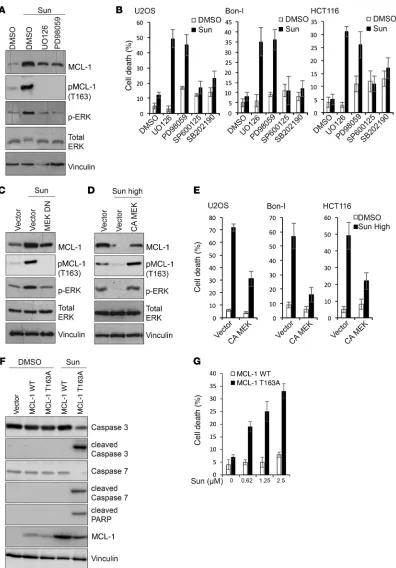
phosphorylation and to stabilize MCL-1 to the same magnitude observed in control cells (Figure 7C). These results indicate that the induction of ERK and subsequent MCL-1 phosphorylation at Thr163 site contribute to MCL-1 stabilization by sunitinib. To test whether ERK inhibition by high doses of sunitinib contributes to the observed enhanced MCL-1 degradation, cells were transfect-ed with a constitutively active form of MEK and then were treattransfect-ed with high doses of sunitinib. Cells expressing the constitutively active form of MEK did not show the extent of reduction in MCL-1 levels observed in control cells upon treatment with high doses of sunitinib (Figure 7D), suggesting that inhibition of ERK contrib-utes to MCL-1 degradation by high doses of sunitinib. Consistent with decreased MCL-1 destabilization, overexpression of constitu-tively active MEK decreased the cytotoxic effects of high doses of sunitinib (Figure 7E and Supplemental Figure 10, E and F).
To further confirm the role of ERK activation in mediating sunitinib-induced MCL-1 stabilization, we used MCL1-KO cells reconstituted with either WT MCL-1 or with a MCL-1 mutant in GSK3β or ERK activity correlated with corresponding changes in
[image:12.585.44.545.55.380.2]the levels of MCL-1 phosphorylation at Ser159 or Thr163, respec-tively (Figure 6, A–C). To test whether modulation of GSK3β/ERK activity mediates sunitinib-induced changes in MCL-1 levels, we initially assessed the effect of pharmacological inhibition of ERK activity on MCL-1 stabilization, combining MEK inhibitors with sunitinib. As shown in Figure 7A, MEK/ERK inhibition using the largely used compounds UO126 or PD98059 diminished suni-tinib-induced MCL-1 stabilization and phosphorylation at Thr163. Consistently, a combination of sunitinib with MEK inhibitors, but not JNK or p38 inhibitors, enhanced sunitinib cytotoxicity (Figure 7B and Supplemental Figure 10, A and B). Treatment with titrat-ed doses of the MEK inhibitor UO126 showtitrat-ed a close correlation between the magnitude of impeding ERK activation and MCL-1 stabilization and the induction of cell death in cells treated with sunitinib (Supplemental Figure 10, C and D). These results were further confirmed by examining cells expressing a dominant neg-ative MEK, in which sunitinib failed to increase MCL-1 Thr163
The Journal of Clinical Investigation
R E S E A R C H A R T I C L E
Mcl1-KO cells reconstituted with WT MCL-1 and treated with
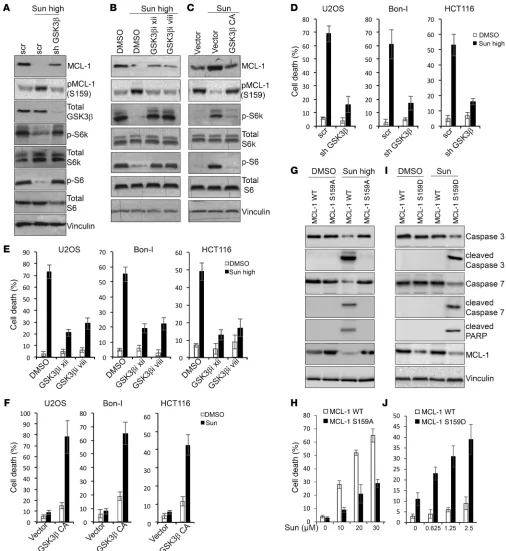
high doses of sunitinib showed a greater decline in MCL-1 levels and subsequent cell death than when reconstituted with MCL-1 carrying a mutation in the GSK3β phosphorylation site (MCL-1 S159A) (Figure 8, G and H). Moreover, MCL-1–KO cells reconsti-tuted with a MCL-1 phosphomimetic mutant in the GSK3β phos-phorylation site (MCL-1 S159D) were more sensitive to lower dos-es of sunitinib than MCL1-KO cells reconstituted with WT MCL-1 (Figure 8, I and J). Finally, previous reports have implicated a role for the E3 ligases FBW7 and β-TrCP in mediating MCL-1 degra-dation upon phosphorylation by GSK3β. Knockdown of the 2 E3 ligases in sunitinib-treated cells suggested an essential role for FBW7 in mediating MCL-1 degradation in response to high doses of sunitinib (Supplemental Figure 12A).
These results suggest that both ERK and GSK3β mediate the changes in MCL-1 levels induced by sunitinib at different doses. Phosphorylation of MCL-1 by GSK3β upon treatment with sunitinib was independent of phosphorylation by ERK, as cells cotreated with sunitinib and the MEK inhibitor UO126 at different times showed a marked inhibition of MCL-1 phosphorylation at Thr163, but no significant changes in phosphorylation at Ser159 compared with control cells treated only with sunitinib (Supplemental Figure 12B).
Taken together, these results indicate a critical role for the modulation of GSK3β and ERK activity by sunitinib in the regula-tion of MCL-1 stability and mTOR activity, and in turn, in mediat-ing the cell response to the drug.
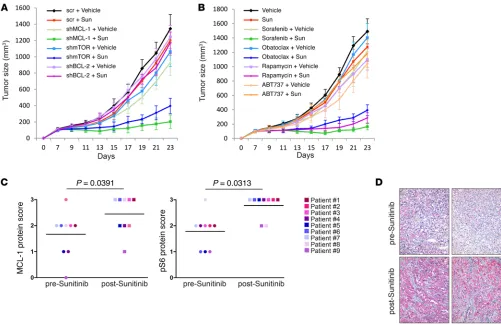
Synergism between sunitinib and inhibition of MCL-1 or mTOR in vivo. Our in vitro results clearly demonstrated that inhibition
of MCL-1 or mTOR dramatically sensitizes different cancer cell lines to sunitinib. We next sought to test the reproducibility of these results in an in vivo setting. To this end, immune-compro-mised mice were inoculated with HCT116 or ACHN cells trans-duced with doxycycline-inducible shRNA targeted against MCL-1, mTOR, BCL-2, or scrambled shRNA as control. Upon establish-ment of the xenografts, doxycycline was added to drinking water to induce the expression of the shRNA and mice inoculated with each shRNA received either vehicle or suboptimal doses of suni-tinib. Our results show that depletion of MCL-1 or mTOR, but not the Thr163 site that cannot be phosphorylated by ERK (MCL-1
T163A). Sunitinib treatment increased MCL-1 levels in MCL1-KO cells reconstituted with WT MCL-1, but this increase was severely reduced in MCL-1–KO cells reconstituted with MCL-1 T163A (Fig-ure 7F). Consistently, MCL-1 T163A cells were more sensitive to sunitinib (Figure 7G). Unlike cells reconstituted with WT MCL-1, treatment of MCL-1 T163A cells with sunitinib and the MEK inhib-itor did not increase cell death significantly, confirming that the cooperative effect of the combination treatment is mediated by modulation of MCL-1 levels (Supplemental Figure 10G).
We then aimed to investigate the role of GSK3β modulation in determining the response to sunitinib. Upon treatment with high doses of sunitinib, cells depleted of GSK3β (Figure 8A) or treated with inhibitors of GSK3β (Figure 8B) showed a reduction in MCL-1 phosphorylation at Ser159 and increased MCL-1 levels compared with control cells, indicating that activation of GSK3β by high dos-es of sunitinib contributdos-es to the phosphorylation and reduction in MCL-1 levels observed under these conditions. Conversely, cells overexpressing a constitutively active GSK3β showed an increased MCL-1 phosphorylation at Ser159 and decreased stabilization upon treatment with tolerated doses of sunitinib compared with control cells (Figure 8C).
Interestingly, our results also showed that depletion or phar-macological inhibition of GSK3β impaired mTOR inhibition upon treatment with high doses of sunitinib, while overexpression of a constitutively active GSK3β diminished mTOR activation by suni-tinib at tolerated doses (Figure 8, A–C), suggesting that the differ-ential modulation of mTOR by sunitinib at different dose ranges is mediated by differential modulation of GSK3β activity. These results are in line with previous findings that demonstrated that GSK3β acts to inhibit mTOR activity (47).
[image:13.585.38.549.54.224.2]Consistent with an essential role in mediating sunitinib- induced modulation of mTOR and MCL-1, GSK3β depletion or its inhibition reduced cell death induced by high doses of sunitinib (Figure 8, D and E, and Supplemental Figure 11, A–D), and con-versely, cells overexpressing a constitutively active GSK3β were more sensitive to low doses of sunitinib, with higher levels of cell death (Figure 8F and Supplemental Figure 11, E and F).
Cellular stresses can trigger either prosurvival or prodeath responses. Generally, in mild to moderate or brief stress condi-tions (as possibly in the case of treatment with lower doses of suni-tinib), cells attempt to sustain the stress by inducing prosurvival pathways. But if the stress is overwhelming or prolonged (possi-bly as in the case of high doses of sunitinib), prodeath pathways are activated. Defining the factors that dictate the magnitude of sunitinib-induced stress that cells can cope with by upregulating prosurvival pathways from that considered overwhelming and leading to cell death is intriguing. In this study, we focused on the modulation of 2 crucial determinants of cell survival: the action of antiapoptotic BCL-2 proteins and mTOR signaling. Our analysis shows that cancer cells respond to treatment with sunitinib at dos-es closer to the clinical range by enhancing the stability of MCL-1 protein and activation of mTOR signaling. Notably, under those conditions, sunitinib elicits no or very little cytotoxic effects, in agreement with previous studies that reported no evident cytotox-ic effect of clincytotox-ically relevant doses of sunitinib on renal cell car-cinoma (33). Importantly, impeding either MCL-1 stabilization or mTOR activation by various approaches greatly sensitized cancer cells to clinically relevant doses of sunitinib. These results demon-strate that MCL-1 stabilization and mTOR activation are prosur-vival mechanisms induced in different cancer cells to antagonize cytotoxic effects triggered by sunitinib.
Interestingly, our results also showed that higher doses of sunitinib exerted opposite effects and led to MCL-1 destabiliza-tion and mTOR inhibidestabiliza-tion, which correlated with evident cyto-toxicity. Destabilization of MCL-1 and mTOR inhibition mediated the cytotoxicity observed under those conditions, as overexpres-sion of MCL-1 or constitutive activation of mTOR rendered can-cer cells resistant to high doses of sunitinib. This dual mechanism thus not only can contribute to resistance to sunitinib, but also can represent a mechanism by which higher doses of sunitinib exert cytotoxicity. Several reports have shown that cancer patients who resisted and subsequently progressed in response to clinically approved doses of sunitinib as well as during “sunitinib-off” peri-od can be sensitized to sunitinib by escalating its dose (11, 48). Our data shown here provide a potential molecular explanation for this reported observation, as higher doses of sunitinib could shift the response of tumor cells toward MCL-1 destabilization and mTOR inhibition, with an increased anticancer effect.
Both mTOR and antiapoptotic BCL-2 proteins are crucial reg-ulators of autophagy. mTOR is a master regulator of autophagy, and MCL-1 has also been shown to inhibit autophagy through neg-ative regulation of autophagy essential mediator beclin 1 (22, 36, 37). A few recent studies investigated the interplay between suni-tinib and autophagy and led to different conclusions (49–52). Con-sistent with the dual effects of sunitinib on mTOR and MCL-1, we observed that sunitinib inhibits or induces autophagy in different dose ranges specific for every cell line.
We further dissected the molecular mechanisms by which sunitinib modulates MCL-1 levels and found that differential modulation of ERK and GSK3β activity by different dose ranges of sunitinib mediates the positive or negative modulation of MCL-1 and ultimately determines sunitinib cytotoxicity. We also found that sunitinib differentially modulates mTOR activity through dif-ferentially tuning GSK3β activity.
BCL-2, cooperated with sunitinib in impairing tumor growth (Fig-ure 9A and Supplemental Fig(Fig-ure 13A).
Finally, we attempted a clinically relevant approach for in vivo studies, based entirely on the use of drugs, and we extended our xeno-graft models to include (HCT116 or ACHN cells) 2 patient-derived xenograft models. The tumor-bearing mice received vehicle or a sub-optimal dose of sunitinib either alone or in combination with either suboptimal doses of the mTOR inhibitor rapamycin or various MCL-1 inhibitors (sorafenib, obatoclax, TW-37, or as control, ABT737). As shown in Figure 9B and Supplemental Figure 13, B–D, coadministra-tion of sunitinib in combinacoadministra-tion with rapamycin or the MCL-1 inhibi-tors sorafenib, obatoclax, and TW-37, but not with ABT737, markedly inhibited tumor growth as compared with mice receiving each agent alone. Of note, no clinical signs of toxicity were observed in mice of any of the groups, as indicated by absence of gross organ failure or marked loss of body weight (Supplemental Figure 13E).
Collectively, those results are consistent with the in vitro observations and indicate that inhibition of MCL-1 and/or mTOR could be exploited clinically to enhance the antitumor activities of sunitinib.
Modulation of MCL-1 and mTOR correlates with resistance of patients to sunitinib treatment. To further explore the clinical
rele-vance of our results, we examined the levels of MCL-1 and phos-phorylated S6 — as readout of mTOR activity — in tissue samples (before and after sunitinib treatment) derived from patients that were resistant to treatment with sunitinib. Immunohistochemical analysis using antibodies validated for immunohistochemistry (Supplemental Figure 13F) showed that the levels of both MCL-1 and phosphorylated S6 increased after sunitinib treatment (Wil-coxon signed-rank test, P = 0.0391 and P = 0.0313, respectively;
n = 9), further indicating the clinical relevance of the correlation
between resistance to sunitinib and posttreatment enhancement of MCL-1 levels and mTOR activity (Figure 9, C and D, and Sup-plemental Figure 14, A–C).
Discussion
Among recently introduced targeted therapies, sunitinib has become the most commonly used first-line therapy for the treat-ment of certain types of cancer. While it continues to be assessed for treatment of other types of cancer, resistance to sunitinib has emerged as the major hurdle for its clinical use. A marked per-centage of patients are intrinsically resistant to sunitinib, and those who show initial response eventually become resistant and relapse, leading to a very modest overall therapeutic benefit.
A few studies have attempted to identify the molecular mech-anisms of resistance of cancer cells to sunitinib. However, in most cases, those studies relied on comparison of gene expression profiles of sunitinib-sensitive versus -resistant cancer cells. This approach is therefore not suitable for identifying other resistance mecha-nisms that do not necessarily involve regulation of gene expression. Additionally, in several of those studies, sunitinib was used in a con-centration range above the levels pharmacologically achievable in patients, raising doubts about the clinical relevance of these findings.
The Journal of Clinical Investigation
R E S E A R C H A R T I C L E
supplemented with 10% FBS, 1% PEST, and 1% sodium pyruvate. For starvation experiments, cells were washed 3 times with PBS, pH 7.2, and then incubated in HBSS. All cultures were maintained in a humid-ified tissue culture incubator at 37°C in 5% CO2.
Immunoblotting. Total cell lysates were prepared by directly lysing cells growing in culturing dishes or collected cell pellets in lysis buffer (40 mM Hepes, pH 7.5, 120 mM NaCl, 1 mM EDTA, 10 mM pyrophos-phate, 10 mM glycerophospyrophos-phate, 50 mM NaF, 0.5 mM orthovanadate, and EDTA-free protease inhibitors [Roche] containing 0.3% CHAPS). Lysates were prepared from frozen tumors using GentleMACS dissoci-ator. Lysates were cleared by centrifugation at 13,000 g for 15 minutes at 4°C, quantified using Bio-Rad DC Protein Assay Reagent followed by mixing 1:1 with 4%SDS, 100 mM Tris.Cl, pH 6.8, 20% glycerol, 0.1% bromophenol blue, and 5% β-mercaptoethanol added immedi-ately before use and heating at 94°C for 7 minutes. Equal amounts of proteins were then electrophoresed on 8%–15% SDS-PAGE gels. Gels were run at 100 V (stacking gel)/150 V (separation gel) on a Protean III apparatus (Bio-Rad). Gels were transferred onto nitrocellulose and probed with the appropriate primary antibody for a variable incuba-tion time depending on the experimental design, followed by the cor-responding secondary antibodies diluted 1:5,000–10,000. The pro-teins were visualized by enhanced chemiluminescence (ECL) using ChemiDoc apparatus (Bio-Rad) according to the manufacturer’s instructions. Areas of the blot around the visible bands were selected to enhance the detection and resolution of the bands.
Immunoprecipitation. Precleared cell lysates were incubated for 2 hours with 4 μg of the indicated antibodies or control IgG under constant rotation at 4°C. Then 25 μl of a 50% slurry of protein G-sepharose was added and the incubation continued for another hour. Immunoprecipitates captured with protein G-sepharose were washed 4 times with the lysis buffer. Beads were finally collected by centrifugation at 5,000 g for 2 minutes and brought up in of 20 μl of sample buffer for further analysis.
RNA interference. shRNA pLKO.1 lentiviral constructs were purchased from Open Biosystems. Target sequences were as fol-lows: scrambled, GTGGACTCTTGAAAGTACTAT; MCL-1 no. 1, GCCTAGTTTATCACCAATAAT; MCL-1 no. 2, GCTTCGGAAACT-GGACATCAA; BCL-2 no. 1, GGGAGAUAGUGAUGAAGUA; BCL-2 no. 2, GAAGUACAUCCAUUAUAAG; BCL-XL no. 1, CCUACAAGC-UUUCCCAGAA; and BCL-XL no. 2, GGAGGCAGGCGACGAGUUU.
Transfection of mammalian cells. HCT-116 cells were plated in a 10-cm dish and transiently transfected the next day using Lipofectamine 2000 reagent (Invitrogen) according to the manufacturer’s protocol. Briefly, Lipofectamine 2000 was added to OptiMEM (Invitrogen). The Lipofectamine 2000–OptiMEM mix was added dropwise to the plas-mid/siRNAs and was allowed to settle for 15 minutes before it was add-ed to cells. U2OS, Bon-I, ACHN, and A-498 cells were electroporatadd-ed using Amaxa Nucleofection procedures. Briefly, cells were trypsinized, pelleted, and resuspended in nucleofection buffer. Cell suspension (100 ml) was added to the plasmid mixture, transferred to a nucleofection cuvette, immediately electroporated using program T-020, and seeded in a 10-cm dish containing 8 ml of prewarmed medium.
Lentiviral transduction. The pLKO.1 vectors and package plasmid were cotransfected into packaging HEK293T cells, and the viral super-natants were collected, supplemented with polybrene (8 μg/ml), and used to infect target cells in four 2-hour cycles of transduction over 2 consecutive days.
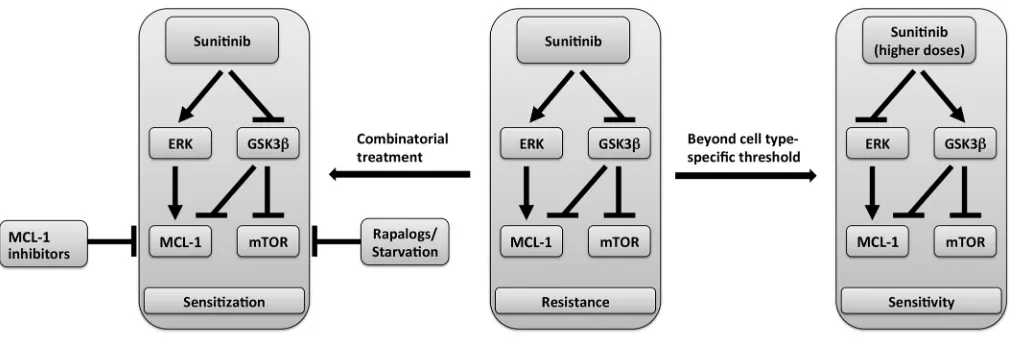
Collectively, these results suggest a model of the mechanism of sunitinib-induced modulation of MCL-1 levels and mTOR activ-ity schematized in Figure 10 in which sunitinib-induced MCL-1 stabilization is mediated by ERK activation and GSK3β inhibition, with the latter event also accounting for mTOR activation by suni-tinib. Beyond dose thresholds that are cell-type specific, the differ-ential effect of sunitinib on ERK and GSK3β is reversed, leading to decline in MCL-1 levels and mTOR inhibition. However, the fac-tors that control the differential effect on ERK and GSK3β activi-ty and ultimately decide the final outcome of sunitinib on MCL-1 levels and mTOR signaling in each case remain to be identified.
Importantly, our results were reproducible in several types of cancer, including human renal cell carcinoma, pancreatic neuro-endocrine tumor, colorectal cancer, and osteosarcoma cell lines. Sunitinib-desensitized melanoma cells exhibited higher MCL-1 levels and mTOR activity compared with parental cells. Further-more, tumor xenografts isolated from mice treated with sunitinib showed enhanced MCL-1 levels and mTOR activity compared with control tumors from mice treated with vehicle. Inhibition of MCL-1 or mTOR using shRNA or pharmacological inhibitors greatly synergized with a lower dose of sunitinib in inhibiting tumor growth in xenograft models. These results indicate that the combination of sunitinib and mTOR or MCL-1 inhibitors is prom-ising and warrants further investigation in a clinical setting.
Finally, our analysis of tumor samples derived from patients that were resistant to sunitinib showed that the levels of MCL-1 and mTOR activity increased after treatment with sunitinib, fur-ther suggesting the clinical relevance of our findings.
Taken together, our results indicate that dual modulation of MCL-1 stability and mTOR signaling exerted by different dose ranges of sunitinib is a major determinant of resistance or sensitiv-ity of cancer cells to sunitinib. Our results also provide mechanistic rationale for the previously reported synergism between sunitinib and mTOR inhibitors identified through a systematic screening approach (53) and suggest that a combination of sunitinib with mTOR and/or MCL-1 inhibitors could prove clinically beneficial.
Methods
Reagents. Antibodies were purchased from the indicated sources and used at a dilution of 1:1,000 unless otherwise described: anti–MCL-1 (clone S-19), anti-p62/SQSTM1 (clone H-290) (Santa Cruz Biotech-nology Inc.); anti-mTOR, anti-pS6K1, anti-S6K1, anti-pS6, anti-S6, pAKT (S473), anti–pMCL-1 (T163), anti-pGSK3β, anti-GSK3β, anti-pERK, anti-ERK, anti–cleaved PARP, anti–cleaved caspase 3, anti–cleaved caspase 7 (Cell Signaling Technology); anti–pMCL-1 (S159) (Abcam); anti–mouse MCL-1 (Rockland Immunochemical); anti–BCL-2 and anti–BCL-XL, anti–caspase 3, anti–caspase 7 (BD Biosciences); and anti-FLAG and anti-vinculin (Sigma-Aldrich, dilu-tion of 1:10,000). Drugs were purchased from the following sources: sunitinib, rapamycin, tunicamycin, cisplatin, cycloheximide (Sigma- Aldrich); sorafenib, ABT737, obatoclax, TW-37, GSK3b inhibitor xii, GSK3b inhibitor viii, U0126, PD98059, SP600125, and SB 202190 (Selleck Chemicals).
Mice were housed according to the guidelines set out in Commission Recommendation 2007/526/EC — June 18, 2007, on guidelines for the accommodation and care of animals used for experimental and other scientific purposes. The study was approved by the Ethics Com-mittee of the European Institute of Oncology.
Author contributions
ME and SM conceived the work. ME designed and performed most experiments and wrote the manuscript. The project derives from the PhD project of AKAA. AKAA, SLR, VB, and GR per-formed experiments and discussed results. VG, NF, and FN pro-vided cell models and patient samples and discussed results. SM supervised the work, provided intellectual and technical support, and contributed to manuscript writing and editing. GP, MC, RK, CKT, DB, IP, JLPG, MDL, CM, LL, and BT provided patient sam-ples and discussed results.
Acknowledgments
We thank our colleagues for kindly providing the following reagents: Axel Ullrich (Max Planck Institute, Martinsried, Ger-many), sunitinib-desensitized and parental melanoma cell lines; Joseph Opferman (St. Jude Children’s Research Hospital, Memphis, Tennessee, USA), inducible Mcl1 KO and WT MEFs; David Sabatini (Whitehead Institute for Biomedical Research, Cambridge, Massachusetts, USA), TOR no. 1, pLKO.1-TOR no. 2, (Addgene plasmid nos. 1856, 1855); Do-Hyung Kim (University of Minnesota, Minneapolis), pLKO.1-TSC2 (Addgene plasmid no. 15478); Brendan Manning (Harvard Medical School,
Boston, Massachusetts), pBabe-puro GSK3β (S9A) (Addgene
plasmid no. 14128); Alex Toker (Harvard Medical School), pLKO.1-GSK3β (Addgene plasmid no. 32496). We are also thank-ful to Marco Ciro for his help with cloning and cell proliferation assay, Alessandra Cavallon (IEO) for immunohistochemistry staining, and Tomoya Fukawa (Duke-NUS Medical School) and Nur Diyana Binte Md Nasir (Singapore General Hospital, Singa-pore) for helping with patient sample processing and preparation. We would also like to thank Manuela Baccarini (Max F. Perutz Laboratories, Vienna, Austria) and Marco Foiani (IFOM) for dis-cussions and suggestions. ME has been awarded fellowships by The Italian Association for Cancer Research and Umberto Vero-nesi Foundation. AKAA has been awarded a fellowship from the Egyptian Ministry of Higher Education and Scientific Research. Work in the laboratory of SM is funded by AIRC, European Com-munity (FP7 Blueprint and 4D Cell Fate).
Address correspondence to: Saverio Minucci, Department of Experimental Oncology, European Institute of Oncology, via Adamello 16, 20139 Milan, Italy. Phone: 390257489832; E-mail: [email protected]. Or to: Mohamed Elgendy, Department of Microbiology and Immunobiology, Max F. Perutz Laborato-ries, University of Vienna, Vienna, Austria, Dr. Bohr-Gasse 9, 1030 Vienna, Italy. Phone: 431427754611; E-mail: mohamed. [email protected].
ME’s present address is: Department of Microbiology and Immu-nobiology, Max F. Perutz Laboratories, University of Vienna, Vienna, Austria.
MCL1 KO. To knock out MCL1 in HCT116 cells, a CRISPR/ Cas9 gene-editing system was used. The plasmids for CRISPR/ Cas9 were obtained from Addgene. The target sequence used was CTCAAAAGAAACGCGGTAAT.
Quantification of cell proliferation. CellTiter Glo Luminescent Cell Viability Assay (Promega) was used according to the manufacturer’s protocol. Briefly, cells were plated in 96-well plates and treated 24 hours later with different doses of drugs in a total volume of 100 μl. Twenty-four hours later, 100 μl of CellTiter Glo reagent was added to the cells and incubated for 15 minutes at 37°C and luminescence was measured using a Promega plate reader.
Quantification of cell death. Cells were harvested by trypsinization, washed in PBS (pH 7.2), and then stained with propidium iodide (10 mg/ml) added immediately prior to analysis. Cell fluorescence was then measured on a flow cytometer (FACSCalibur; BD) and analyzed using CellQuest software.
Pulse-chase assay. HCT116 cells were washed twice with PBS and then incubated in methionine/cysteine-free DMEM for 30 minutes, followed by incubation in labeling medium containing 200–500 μCi of [35S] cysteine/methionine for 2 hours at 37°C. After labeling, the cells were chased with complete DMEM con-taining 10% FBS and 2 M cold methionine at 37°C and were either left untreated or were treated with sunitinib for the indicated time points. MCL-1 was then immunoprecipitated from the lysates and analyzed by autoradiography.
Immunohistochemistry. Formalin-fixed paraffin-embedded sam-ples of human renal cell carcinomas were cut 5-μm thick on polarized glass; unmasking for both antigens was made with Citrate for 30 utes at 99° C; anti-Mcl1 was used at 1:200 concentration for 40 min-utes; anti-pS6 was used at 1:800 concentration for 40 minutes. LSAB 2 System-AP (DAKO) and Vulcan Fast Red Chromogen Kit 2 (Biocare Medical) were used as visualization systems according to the manu-facturer’s recommended procedures. After H&E review, the positivi-ty of tumor cells was recorded scoring the intensipositivi-ty of staining in the most reactive area (absent/weak/moderate/strong scoring, respec-tively, 0, 1, 2 or 3). Scoring was done in a blinded manner.
Xenograft. Six-week-old NOD scid gamma (NSG) or nude CD1 mice received single subcutaneous flank injections of 5 × 10⁶ HCT-116, ACHN cells, or patient-derived melanoma cells diluted in 200 μl saline. After the tumors were established, mice were randomized in groups as indicated in the figure legend (Figure 9, A and B, and Supple-mental Figure 13, A–D). Sunitinib was dissolved in 5% dextrose-water and administered by daily gavage. The vehicle groups received dex-trose-water vehicle. Tumor growth was monitored by bidimensional measurements using a caliper.
Statistics. Results are representative of 3 independent experi-ments. Results are expressed as the mean, and error bars indicate SEM. The immunohistochemical data of MCL-1 and phosphorylated S6 scores in biopsies isolated from patients was analyzed using Wil-coxon’s signed rank test. A P value of less than 0.05 was considered statistically significant.
The Journal of Clinical Investigation
R E S E A R C H A R T I C L E
1. Aparicio-Gallego G, et al. New insights into molecular mechanisms of sunitinib- associated side effects. Mol Cancer Ther. 2011;10(12):2215–2223.
2. Kollmannsberger C, et al. Sunitinib in metastatic renal cell carcinoma: recommendations for man-agement of noncardiovascular toxicities. Oncolo-gist. 2011;16(5):543–553.
3. Raymond E, et al. Sunitinib malate for the treat-ment of pancreatic neuroendocrine tumors. N Engl J Med. 2011;364(6):501–513. 4. Younus J, Verma S, Franek J, Coakley N.
Sunitinib malate for gastrointestinal stromal tumour in imatinib mesylate-resistant patients: recommendations and evidence. Curr Oncol. 2010;17(4):4–10.
5. Xin H, Zhang C, Herrmann A, Du Y, Figlin R, Yu H. Sunitinib inhibition of Stat3 induces renal cell carcinoma tumor cell apoptosis and reduces immunosuppressive cells. Cancer Res. 2009;69(6):2506–2513.
6. Heymann D, Rédini F. Targeted therapies for bone sarcomas. Bonekey Rep. 2013;2:378. 7. Saltz LB, et al. Phase II trial of sunitinib in
patients with metastatic colorectal cancer after failure of standard therapy. J Clin Oncol. 2007;25(30):4793–4799.
8. Minor DR, Kashani-Sabet M, Garrido M, O’Day SJ, Hamid O, Bastian BC. Sunitinib therapy for melanoma patients with KIT mutations. Clin Cancer Res. 2012;18(5):1457–1463. 9. Morais C. Sunitinib resistance in renal cell
carcinoma. Journal of Kidney Cancer and VHL. 2014;1(1):1–11.
10. Busch J, et al. Intrinsic resistance to tyrosine kinase inhibitors is associated with poor clinical outcome in metastatic renal cell carcinoma. BMC Cancer. 2011;11:295.
11. Adelaiye R, et al. Sunitinib dose escalation overcomes transient resistance in clear cell renal cell carcinoma and is associated with epigenetic modifications. Mol Cancer Ther. 2015;14(2):513–522.
12. Bottsford-Miller JN, Coleman RL, Sood AK. Resistance and escape from antiangiogenesis therapy: clinical implications and future strate-gies. J Clin Oncol. 2012;30(32):4026–4034. 13. Thoma C. Kidney cancer: S1P—a promising
target in sunitinib-resistant RCC. Nat Rev Urol. 2015;12(3):123.
14. Kang MH, Reynolds CP. Bcl-2 inhibitors: target-ing mitochondrial apoptotic pathways in cancer therapy. Clin Cancer Res. 2009;15(4):1126–1132. 15. Sheridan C, Brumatti G, Elgendy M, Brunet
M, Martin SJ. An ERK-dependent pathway to Noxa expression regulates apoptosis by plati-num-based chemotherapeutic drugs. Oncogene. 2010;29(49):6428–6441.
16. Cory S, Huang DC, Adams JM. The Bcl-2 family: roles in cell survival and oncogenesis. Oncogene. 2003;22(53):8590–8607.
17. Warr MR, Shore GC. Unique biology of Mcl-1: therapeutic opportunities in cancer. Curr Mol Med. 2008;8(2):138–147.
18. Perciavalle RM, Opferman JT. Delving deeper: MCL-1’s contributions to normal and cancer biol-ogy. Trends Cell Biol. 2013;23(1):22–29.
19. Akgul C. Mcl-1 is a potential therapeutic target in multiple types of cancer. Cell Mol Life Sci. 2009;66(8):1326–1336.
20. Wuillème-Toumi S, et al. Mcl-1 is overex-pressed in multiple myeloma and associated with relapse and shorter survival. Leukemia. 2005;19(7):1248–1252.
21. Schwickart M, et al. Deubiquitinase USP9X sta-bilizes MCL1 and promotes tumour cell survival. Nature. 2010;463(7277):103–107.
22. Elgendy M, et al. Beclin 1 restrains tumorigenesis through Mcl-1 destabilization in an autophagy- independent reciprocal manner. Nat Commun. 2014;5:5637.
23. Chetoui N, et al. Down-regulation of mcl-1 by small interfering RNA sensitizes resistant mela-noma cells to fas-mediated apoptosis. Mol Cancer Res. 2008;6(1):42–52.
24. Gores GJ, Kaufmann SH. Selectively targeting Mcl-1 for the treatment of acute myeloge-nous leukemia and solid tumors. Genes Dev. 2012;26(4):305–311.
25. Quinn BA, et al. Targeting Mcl-1 for the ther-apy of cancer. Expert Opin Investig Drugs. 2011;20(10):1397–1411.
26. Jiang BH, Liu LZ. Role of mTOR in anticancer drug resistance: perspectives for improved drug treatment. Drug Resist Updat. 2008;11(3):63–76. 27. Guertin DA, Sabatini DM. Defining the role of
mTOR in cancer. Cancer Cell. 2007;12(1):9–22. 28. Laplante M, Sabatini DM. mTOR
signal-ing in growth control and disease. Cell. 2012;149(2):274–293.
29. Jung CH, Ro SH, Cao J, Otto NM, Kim DH. mTOR regulation of autophagy. FEBS Lett. 2010;584(7):1287–1295.
30. Guertin DA, Sabatini DM. An expanding role for mTOR in cancer. Trends Mol Med. 2005;11(8):353–361.
31. LoPiccolo J, Blumenthal GM, Bernstein WB, Den-nis PA. Targeting the PI3K/Akt/mTOR pathway: effective combinations and clinical consider-ations. Drug Resist Updat. 2008;11(1-2):32–50. 32. Cella CA, et al. Dual inhibition of mTOR pathway
and VEGF signalling in neuroendocrine neo-plasms: from bench to bedside. Cancer Treat Rev. 2015;41(9):754–760.
33. Huang D, et al. Sunitinib acts primarily on tumor endothelium rather than tumor cells to inhibit the growth of renal cell carcinoma. Cancer Res. 2010;70(3):1053–1062.
34. Mendel DB, et al. In vivo antitumor activity of SU11248, a novel tyrosine kinase inhibitor target-ing vascular endothelial growth factor and plate-let-derived growth factor receptors: determina-tion of a pharmacokinetic/pharmacodynamic relationship. Clin Cancer Res. 2003;9(1):327–337. 35. Faivre S, et al. Safety, pharmacokinetic, and
antitumor activity of SU11248, a novel oral mul-titarget tyrosine kinase inhibitor, in patients with cancer. J Clin Oncol. 2006;24(1):25–35. 36. Elgendy M, Minucci S. A novel autophagy-
independent, oncosuppressive function of BECN1: Degradation of MCL1. Autophagy. 2015;11(3):581–582.
37. Elgendy M, Sheridan C, Brumatti G, Martin SJ. Oncogenic Ras-induced expression of
Noxa and Beclin-1 promotes autophagic cell death and limits clonogenic survival. Mol Cell. 2011;42(1):23–35.
38. Germain M, et al. MCL-1 is a stress sensor that regulates autophagy in a developmentally regu-lated manner. EMBO J. 2011;30(2):395–407. 39. Perciavalle RM, et al. Anti-apoptotic MCL-1
localizes to the mitochondrial matrix and couples mitochondrial fusion to respiration. Nat Cell Biol. 2012;14(6):575–583.
40. van Delft MF, et al. The BH3 mimetic ABT-737 targets selective Bcl-2 proteins and efficiently induces apoptosis via Bak/Bax if Mcl-1 is neutral-ized. Cancer Cell. 2006;10(5):389–399. 41. Hauck P, Chao BH, Litz J, Krystal GW. Alterations
in the Noxa/Mcl-1 axis determine sensitivity of small cell lung cancer to the BH3 mimetic ABT-737. Mol Cancer Ther. 2009;8(4):883–892. 42. Bender C, Ullrich A. PRKX, TTBK2 and RSK4
expression causes Sunitinib resistance in kidney carcinoma- and melanoma-cell lines. Int J Can-cer. 2012;131(2):E45–E55.
43. Thomas LW, Lam C, Edwards SW. Mcl-1; the molecular regulation of protein function. FEBS Lett. 2010;584(14):2981–2989.
44. Ding Q, et al. Degradation of Mcl-1 by beta-TrCP mediates glycogen synthase kinase 3-induced tumor suppression and chemosensitization. Mol Cell Biol. 2007;27(11):4006–4017.
45. Domina AM, Vrana JA, Gregory MA, Hann SR, Craig RW. MCL1 is phosphorylated in the PEST region and stabilized upon ERK acti-vation in viable cells, and at additional sites with cytotoxic okadaic acid or taxol. Oncogene. 2004;23(31):5301–5315.
46. Medina M, Wandosell F. Deconstructing GSK-3: The Fine Regulation of Its Activity. Int J Alzhei-mers Dis. 2011;2011:479249.
47. Inoki K, et al. TSC2 integrates Wnt and energy signals via a coordinated phosphorylation by AMPK and GSK3 to regulate cell growth. Cell. 2006;126(5):955–968.
48. Mitchell N, Fong PC, Broom RJ. Clinical expe-rience with sunitinib dose escalation in meta-static renal cell carcinoma. Asia Pac J Clin Oncol. 2015;11(3):e1–e5.
49. Zhao Y, et al. Autophagy plays an important role in sunitinib-mediated cell death in H9c2 cardiac muscle cells. Toxicol Appl Pharmacol. 2010;248(1):20–27.
50. Abdel-Aziz AK, Shouman S, El-Demerdash E, Elgendy M, Abdel-Naim AB. Chloroquine syner-gizes sunitinib cytotoxicity via modulating auto-phagic, apoptotic and angiogenic machineries. Chem Biol Interact. 2014;217:28–40.
51. Ikeda T, et al. Inhibition of autophagy enhances sunitinib-induced cytotoxicity in rat pheo-chromocytoma PC12 cells. J Pharmacol Sci. 2013;121(1):67–73.
52. Abdel-aziz AK, Shouman S, El-demerdash E, Elgendy M, Abdel-naim AB. Chloroquine as a promising adjuvant chemotherapy together with sunitinib. Sci Proc. 2014;1:e384.