http://dx.doi.org/10.4236/gm.2015.52005
How to cite this paper: Ram Chandar, K. and Sastry, V.R. (2015) A New Method of Estimating Wave Energy from Ground
A New Method of Estimating Wave Energy
from Ground Vibrations
K. Ram Chandar
*, V. R. Sastry
Department of Mining Engineering, National Institute of Technology Karnataka, Surathkal, Mangalore, India Email: *[email protected]
Received 28 January 2015; accepted 25 February 2015; published 2 March 2015
Copyright © 2015 by authors and Scientific Research Publishing Inc.
This work is licensed under the Creative Commons Attribution International License (CC BY). http://creativecommons.org/licenses/by/4.0/
Abstract
Performance of explosive energy is rated in a number of ways, obtained either from theoretical calculations or from experimental tests. However, it is difficult to determine the amount of the ex-plosive energy transferred to the rock and converted into efficient work in the application of rock blasting. Although measurement of some of the effects of explosive energy in rock mass is ground vibration, noise, etc., which are usually conducted for blast control/analysis purpose, the results are rarely used on energy content. Energy transferred to the rock in the form of seismic waves is called seismic energy. In conventional analysis of blast results, generally, the ground vibrations generated due to blasting operations are monitored at a known distance from blast site with a geophone/ground vibration monitor, in three mutually orthogonal directions. Using such wave forms, an energy component is estimated from all the wave forms in three directions, using a so-phisticated signal processing software, which is termed as “wave energy”. The wave energy is compared with the estimated seismic energy. An investigating program was taken up involving 31 blasts conducted at a hard rock excavation site to assess the influence of depth of excavation and scaled distance on the seismic energy wasted in the form of ground vibrations.
Keywords
Energy Distribution, Wave Form, Ground Vibrations, Seismic Energy
1. Introduction
Assessment of blast performance is essential in order to ensure that the extent of objectives of blasts is achieved. There are various methods of blast performance analysis methods using fragmentation analysis and ground vi-brations data generated during blasting operations. [1]-[3] have used different methods of fragmentation analysis
methods using different initiation systems to assess blast performance; they [4] [5] have used ground vibration data to assess blast performance. Their study focused on estimation of energy wasted in the form of ground vi-brations by analyzing ground vibration wave forms.
Theoretically the highest amount of energy is equivalent to detonation energy. Effective comparison of energy of different explosives is done based on weight strength. Only a fraction of energy does useful work in rock blasting and the remaining is wasted in producing detrimental effects like ground vibrations, fly rock, back break, etc. Generally blast performance is analyzed in terms of fragmentation and ground vibration, but these results cannot be expressed directly in terms of their energy content. The reason for this may be that, it is not the energy consumption in different phenomena that matter, but rather the end effects of blasting like degree of fragmentation, throw and vibration levels. Data and estimations on energy components in rock blasting are thus limited to a few researchers. [6]-[8] estimated the amount of energy transformed in kinetic energy of the rock, fracture generation and seismic waves.
Attempts were made by some researchers to measure the explosive energy in laboratory scale using cylinder expansion test. In this test, copper tubes filled with explosives were shot, and the explosive velocity of detona-tion (VOD) and the expansion velocity of the tube wall were measured. Sum of the kinetic energy of the copper tube and the radial kinetic energy of the gases is called Gurney energy (Ec). Ec is the measure of the work ca-pacity of the explosive [8].
Energy released by an explosive can be grouped into gaseous energy and shock energy, working on the sur-rounding strata resulting in fragmenting the medium through various breakage mechanisms. Some of these me-chanisms are responsible for (a) fracturing energy that ultimately is responsible for creating new surfaces in the rock fragments; (b) energy transferred as shock waves into the rock mass propagating as seismic waves or ground vibrations beyond the fragmentation zone; and (c) energy to displace the fragmented material and form the muck pile that appears as kinetic energy. This energy partitioning is related to the characteristics of explo-sives and the strata, and to some extent to the blast geometry. The energy balance of the blast can thus be ex-pressed as [7].
EE=EF+ES+EK+ENM (1) where,
EE = explosive energy, EF = fragmentation energy, ES = seismic energy, EK = kinetic energy,
ENM = energy forms not measured.
Seismic Energy
The energy transferred to the rock in the form of seismic waves is calculated as the integral of the energy flow past a control surface at a given distance from the blast. The energy flux (the power or rate of work, per unit area) is the scalar product of the stress at the surface and the particle velocity [9]. Calculations of seismic energy and its comparison with explosive energy have been reported by [10]-[14] and more recently by [15]. [6] attempted to use some of the energy concepts in principles of blast design.
Energy passing through rock mass in the form of seismic waves is seismic energy. [16] suggested the follow-ing formula to estimate the seismic energy.
( )
2 2
4π L d
ES= r
ρ
C fν
t (2)2 2 2 2
1 2 3
ν
=ν
+ν
+ν
where,
ES = seismic energy (MJ), r = distance (m),
ρ = rock density (gm/cc),
CL = longitudinal wave velocity (m/s),
ν = magnitude of the vector sum of the velocities (m/s), ν1 = measured velocity in longitudinal direction,
ν2= measured velocity in transverse direction,
The authors have proposed another concept in estimating energy by analyzing the complete wave forms ob-tained from ground vibration monitoring. Once the explosive is initiated in the blast hole, energy dissipates into the rock mass, generating strain waves. The intensity of the waves is captured at a point from a known distance from blast site with ground vibration monitor. The geophone captures the wave forms in three mutually ortho-gonal directions namely, longitudinal, transverse and vertical directions for a fixed duration. There seems to be a relationship between the explosive energy dissipation and the nature of the wave forms. In general the area within the curve of force-displacement diagram is a work done; the same principle is applied for wave forms generated from blast vibrations (Figure 1). As the wave form consists of velocity vs time, no unit is given in terms of energy. Only the quantitative values are used for analysis. Some more research work is going on in this aspect.
In case of a regular curve of equal wave length, the square of the amplitude can be integrated to get the area of the curve. However, wave forms produced from blasting operations are complex and there is a wide variation in wave length. Wave forms, therefore, are analyzed with the help of a signal processing software DaDiSP. Sum-mation of energy in all three directions is taken for estimating the total wave energy from each event.
2. Case Study
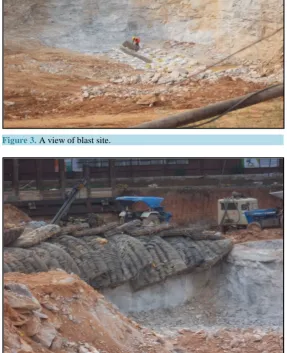
A case study was taken up in a civil engineering project site where hard rock is being excavated for construction of a station for an underground metro rail. The hard granitic formation is exposed almost to the surface. Total depth of excavation required is around 20 to 24 m. So, it was planned to remove the rock by benching method using drilling and blasting technique. The area of excavation is surrounded by important buildings.Figure 2
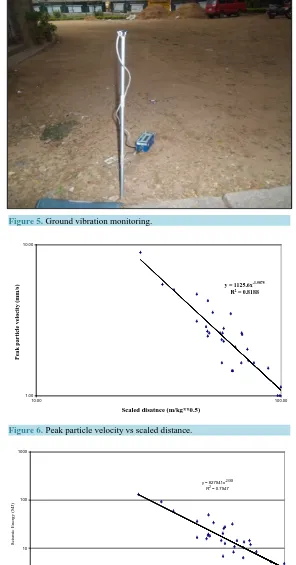
show the drilling process at the site. After drilling, each blast hole is charged with cart ridged explosives and shock tube initiation system is used to initiate each blast hole (Figure 3). As numbers of important buildings are there in the surroundings and therefore, fly rock is a major concern. Muffling was done using rubber blast mats (Figure 4). Each blast was monitored using Minimate, Instantel, Canada, for ground vibrations generation at specific distances (Figure 5).
In total 31 blasts were considered for analysis purpose. Details of blasts like maximum charge per delay, monitoring distance, peak particle velocity, depth of excavation from surface etc., are given inTable 1. Regres-sion analysis was performed between peak particle velocity and scaled distance and the regresRegres-sion coefficient was found to be 0.81, which indicates that the data has a very good correlation (Figure 6).
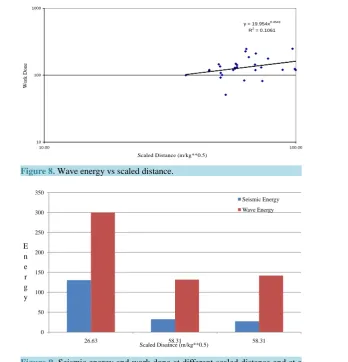
Seismic energy was estimated as per Equation (2) using the peak particle velocities in longitudinal, vertical and transverse directions, the details of which are given in Table 2. Figure 7 shows the correlation between seismic energy and scaled distance, with a correlation coefficient of 0.79 indicating a very good correlation.
The ground vibration event signals were analyzed using DaDiSP software. Area of each signal in each direc-tion was determined and the total wave energy was estimated by summing up the energy in longitudinal, vertical and transverse directions (Table 2).Figure 8 show the plot between total wave energy and the scaled distance. The wave energy from each blast was compared with the estimated seismic energy. Though it has a poor regres-
Figure 1. Analysis of ground vibration wave forms using signal processing
Figure 2.A view of drilling operation at excavation site.
Figure 3.A view of blast site.
[image:4.595.169.457.348.702.2]Figure 5.Ground vibration monitoring.
Figure 6.Peak particle velocity vs scaled distance.
Figure 7.Seismic energy vs scaled distance.
y = 1125.6x-1.5075 R2 = 0.8188
1.00 10.00
10.00 100.00
Scaled disatnce (m/kg**0.5)
P
ea
k pa
rt
icle v
elo
cit
y
(
m
m
/s
)
y = 827941x-2.668
R2
= 0.7947
1 10 100 1000
10.00 100.00
Scaled Distance (m/kg**0.5)
S
ei
sm
ic E
n
er
g
y
(
M
[image:5.595.171.454.521.702.2]Table 1. Details of blasts conducted.
Blast No. PPV (mms) MCD (kg) Distance (m) Depth (m) SD (m/kg 0.5)
1 4.70 0.38 27.73 12.00 45.28
2 2.60 0.25 28.18 13.00 56.36
3 2.35 0.31 31.99 13.50 57.22
4 1.52 0.13 31.30 14.00 88.54
5 1.65 0.25 28.65 14.00 57.31
6 8.89 1.00 26.63 15.00 26.63
7 2.29 0.25 29.15 15.00 58.31
8 2.79 0.25 29.15 15.00 58.31
9 2.60 0.31 32.25 16.00 57.69
10 2.10 0.25 32.50 16.50 65.00
11 5.46 1.00 32.76 17.00 32.76
12 2.86 0.38 30.23 17.00 49.37
13 1.46 0.38 38.91 17.00 63.54
14 1.46 0.25 31.51 17.80 63.02
15 1.00 0.25 48.47 18.00 96.93
16 2.60 0.38 31.16 18.60 50.88
17 3.49 0.25 31.16 18.60 62.32
18 2.67 0.38 30.61 19.00 49.99
19 3.11 0.38 27.72 19.20 45.27
20 2.48 0.38 30.73 19.20 50.19
21 5.02 0.75 31.64 19.40 36.54
22 3.56 0.38 32.20 20.30 52.59
23 1.00 0.13 35.00 21.00 98.99
24 4.25 0.75 43.51 21.20 50.25
25 1.14 0.25 49.87 21.50 99.74
26 27
2.03 0.25 36.40 22.00 72.80
1.65 0.25 34.38 22.50 68.77
28 1.71 0.31 41.10 23.10 73.53
29 2.60 0.25 34.52 23.80 69.03
30 2.54 0.25 34.66 24.00 69.31
31 1.65 0.31 43.30 25.50 77.46
PPV: Peak particle velocity, MCD: Maximum charge per delay, SD: Scaled distance.
sion co-efferent, it has similar trend to the previous curves, which can be also an indicator of blast performance.
Table 2. Work done and seismic energy of different blasts.
Blast No. PPV (mms) MCD (kg) Distance (m) Depth (m) SD (m/kg 0.5) TransTotal Wave Energy ES (MJ) VertLongTransVertLong
1 0.69` 4.70 1.52 86.75 25.11 7.65 12.00 45.28 119.51 35.85
2 1.59 2.60 0.83 84.94 20.10 14.56 13.00 56.36 119.60 14.37
3 1.14 2.29 2.35 94.67 22.04 12.14 13.50 57.22 128.85 20.17
4 1.52 0.83 0.45 86.44 23.51 10.33 14.00 88.54 120.28 5.15
5 1.65 1.02 0.95 96.31 18.61 10.34 14.00 57.31 125.26 6.73
6 3.81 8.89 3.05 29.92 26.72 243.15 15.00 26.63 299.79 130.45
7 0.45 1.78 2.29 65.62 25.40 10.84 15.00 58.31 131.86 32.41
8 1.84 2.79 2.79 106.98 23.19 11.77 15.00 58.31 133.94 13.32
9 1.52 2.60 2.60 105.35 30.62 12.20 16.00 57.69 148.17 25.55
10 2.10 1.91 0.88 33.85 9.36 142.74 16.50 65.00 185.95 14.26
11 2.60 5.46 4.51 61.33 0.50 90.67 17.00 32.76 152.50 91.87
12 1.46 2.86 0.76 45.80 9.18 90.59 17.00 49.37 145.56 15.70
13 1.02 1.46 1.46 66.06 6.25 173.88 17.00 63.54 140.19 10.70
14 1.46 1.33 1.27 59.28 2.41 164.88 17.80 63.02 226.57 8.26
15 0.83 0.57 0.38 69.97 5.31 172.83 18.00 96.93 248.11 3.00
16 1.91 2.60 1.40 67.48 21.23 12.10 18.60 50.88 90.81 17.83
17 2.48 3.49 1.91 52.44 20.88 10.12 18.60 62.32 83.44 31.68
18 1.08 2.22 2.67 83.63 26.75 24.86 19.00 49.99 135.24 18.30
19 3.11 1.65 1.40 77.19 23.93 15.04 19.20 45.27 96.16 26.55
20 2.48 2.41 1.40 55.48 21.28 15.35 19.20 50.19 92.11 19.26
21 0.32 3.94 5.02 74.35 14.35 11.10 19.40 36.54 99.80 58.84
22 3.56 2.29 2.35 32.35 17.71 0.91 20.30 52.59 50.97 33.78
23 0.95 0.76 0.51 91.99 22.19 9.79 21.00 98.99 123.97 2.82
24 4.25 1.59 1.33 72.35 20.80 15.03 21.20 50.25 108.17 48.98
25 1.14 0.57 0.45 91.56 17.24 10.71 21.50 99.74 119.51 4.73
26 1.14 1.78 2.03 92.00 23.17 15.56 22.00 72.80 130.73 14.36
27 1.65 0.89 0.83 103.20 27.61 13.08 22.50 68.77 143.89 6.29
28 1.08 1.40 1.71 48.61 20.81 12.40 23.10 73.53 81.82 11.86
29 2.60 0.51 0.32 88.91 17.87 12.32 23.80 69.03 149.10 10.26
30 1.02 1.33 2.54 47.34 5.77 157.41 24.00 69.31 210.51 13.35
31 1.65 1.08 0.51 124.24 37.04 15.54 25.50 77.46 176.82 8.37
SD: Scaled distance, ES: Seismic energy.
compared to higher scaled distance.
Figure 8. Wave energy vs scaled distance.
Figure 9.Seismic energy and work done at different scaled distance and at a
constant depth of 15 m.
Figure 10. Seismic energy and work done at different scaled distance and at a
constant depth of 17 m.
o monitoring point.
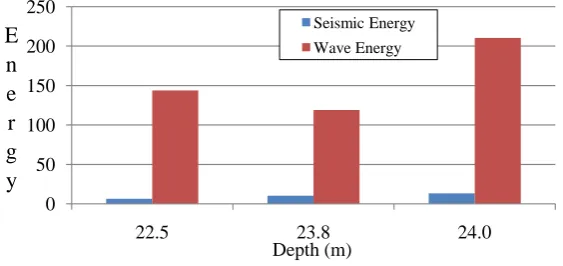
Figure 12shows the comparison between seismic energy and total wave energy at different depths of excava-tion and at a constant scaled distance of 58. As the depth increases, seismic energy and wave energy also in
y = 19.954x0.4543
R2
= 0.1061
10 100 1000
10.00 100.00
Scaled Distance (m/kg**0.5)
W
or
k Done
0 50 100 150 200 250 300 350
26.63 58.31 58.31
E n e r g y
Scaled Disatnce (m/kg**0.5)
Seismic Energy
Wave Energy
0 20 40 60 80 100 120 140 160 180
32.76 49.37 63.54
E n e r g y
Sacled Distaance (m/kg**.0.5)
Seismic Energy
Figure 11.Seismic energy and work done at different scaled distance and at a constant depth of 19 m.
Figure 12. Seismic energy and work done at different scaled distance and at a
constant depth of 58 m.
creased. Similar analysis was carried out at a scaled distances of 50 and 69, and similar trend was observed in the results (Figure 13&Figure 14). This is due to that as the depth increases the rock formation was found to be harder in the field. Through hard rock formation the wave propagation is more active so it resulted in higher seismic energy and higher wave energy as the depth increases. Another reason is that the horizontal monitoring distance is between 22 and 45 m and depth of excavation is between 12 to 25 m. So, at shallow depths of exca-vation, the seismic wave reaches the surface much before the monitoring point which has led to a lower PPV recording by geophone, where as in case of deeper excavation point, as the seismic wave reaches the surface very near to the geophone and a higher PPV was recorded. So, deeper excavation resulted in higher seismic energy and wave energy though the scaled distance and other parameters were same.
3. Conclusions
The analysis carried out in the chosen construction site has indicated the following useful inferences.
1) The seismic energy dissipated into the rock mass is having good correlation with scaled distance and seis-mic energy.
2) The work done determined based on three mutually orthogonal directions of ground vibration events is having good correlation with the seismic energy, which is estimated, based on PPV and rock properties.
3) The seismic energy dissipated into the rock mass and the work done by the explosive energy are found to decrease with increase in scaled distance at a given depth of excavation.
4) At a constant scaled distance, as the depth of excavation increases the seismic energy, the work done also increases.
5) Analysis of wave forms using signal processing software is found to be quite useful in analyzing the blast results.
0 20 40 60 80 100 120
36.54 45.27 50.19
E n e r g y
Scaled Disatnce (m/kg**0.5)
Seismic Energy Wave Energy
0 20 40 60 80 100 120
18.6 19.2 21.2
E n e r g y
Depth (m)
[image:9.595.174.455.300.411.2]Figure 13. Seismic energy and work done at different scaled distance and at a constant depth of 50 m.
Figure 14.Seismic energy and work done at different scaled distance and at a
constant depth of 69 m.
6) The work done and seismic energy estimation analogy can be extended further to correlate with fragmenta-tion energy.
References
[1] Sastry, V.R., Teggi, V. andRam Chandar, K. (2003) Shocktube Initiation for Eco-Friendly Blasting: A Few Case-Stu-
dies. Institute of Engineers (India), Kolkata, 40-46.
[2] Sastry, V.R. and Ram Chandar, K. (2004) Shocktube Initiation for Better Fragmentation: A Case Study. The
Interna-tional Journal for Blasting and Fragmentation, 8, 207-220.
[3] Sastry, V.R. and Ram Chandar, K. (2005) Influence of Initiation System on Noise Levels Produced by Blasting
Opera-tions in Limestone Mines. Institution of Engineers (India), Kolkata, 20-26.
[4] Sastry, V.R. and Ram Chandar, K. (2008) Fragmentation and Throw Due to Blasting—Role of Initiation Systems.
In-ternational Conference of ISEE, January 2008.
[5] Sastry, V.R. and Ram Chandar, K. (2008) Assessment of Blast Performance Based on Energy Distribution:
Proceed-ings of 42nd American Rock Mechanics Association Conference, San Francisco, 29 June-2 July 2008.
[6] Berta, G. (1990) Explosives: An Engineering Tool. Italesplosivi, Milano.
[7] Spathis, A.T. (1999) On the Energy Efficiency of Blasting. The 4th International Symposium on Rock Fragmentation
by Blasting, Johannesburg, 5-8 July 1999, 81-90.
[8] Ouchterlony, F., Nyberg, U. and Olsson, M. (2003) The Energy Balance of Production Blasts at Norkalk’s Klinthagen
Quarry. Proceedings of the Second World Conference on Explosives and Blasting,Prague, 10-12 September 2003,
193-203.
[9] Achenbach, J.D. (1975) Wave Propagation in Elastic Solids. Elsevier, Amsterdam, 166.
[10] Howell, B.F. and Budenstein, D. (1955) Energy Distribution in Explosion Generated Seismic Pulses. Geophysics, 20,
33-52.http://dx.doi.org/10.1190/1.1438122 0 20 40 60 80 100 120 140 160
14.0 15.0 15.0 16.0
E
n
e
r
g
y
Depth (m) Seismic Energy Wave Energy 0 50 100 150 200 25022.5 23.8 24.0
[image:10.595.173.455.270.403.2][11] Fogelson, D.E., Atchinson, T.C. and Duvall, W.I. (1959) Propagation of Peak Strain and Strain Energy for
Explo-sion-Generated Strain Pulses in Rock. Proceedings of the 3rd USSymposium on Rock Mechanics, Golden, 20-22 April
1959, 271-284.
[12] Berg Jr., J.W. and Cook, K.L. (1961) Energies, Magnitudes and Amplitudes of Seismic Waves from Quarry Blasts at
Promontory and Lakeside, Utah. Bulletin of the Seismological Society of America, 51,389-399.
[13] Nicholls, H.R. (1962) Coupling Explosive Energy to Rock. Geophysics, 27, 305-316.
http://dx.doi.org/10.1190/1.1439015
[14] Atchinson, T.C. (1968) Fragmentation Principles. In: Pfleider, E.P., Ed., Surf Mining, The American Institute of
Min-ing, Metallurgical and Petroleum Engineers, New York, 355-372.
[15] Hinzen, K.-G. (1998) Comparison of Seismic and Explosive Energy in Five Smooth Blasting Test Rounds.
Interna-tional Journal of Rock Mechanics and Mining Sciences, 35, 957-967. http://dx.doi.org/10.1016/S0148-9062(98)00159-4
[16] Sanchidrian, J.A., Segarra, P. and Lopez, L.M. (2006) Energy Components in Rock Blasting. International Journal of
Rock Mechanics and Mining Sciences, 44, 130-147.