© 2017, IRJET | Impact Factor value: 5.181 | ISO 9001:2008 Certified Journal | Page 858
Actual Time Online Thermal Mapping Of significant Components In
Data Hub
Ms. A. Ruby priyadharshini
1,Ms.G.Arunkumari
2*1
Assistant Professor,Department of Computer Science , voorhees college, Vellore, TamilNadu,India.
*
2Department of Computer Science , Dkm college, Vellore, TamilNadu,India.
---****---Abstract
–Cooling of central processing unit equipments in data centers efficiently is critical to increasing IT availability, reliability, maintaining high performance, and plummeting electrical power consumption. Occasionally Computational Fluid Dynamics (CFD) modeling is used to design the cooling systems for data centers by simulation (CRAC) units, but most of the time, the design doesn’t perform under the real operating conditions. This paper discusses the way of thinking behind using infrared thermography (Irt) to do online real time monitoring and to control the HVAC, and to diagnose the problems related to HVAC and electrical systems.Key Words: Thermal Mapping, Efficiency, Predictive Maintenance, effectiveness.
1.INTRODUCTION
Information technology for data centers, ensuring a continuous flow of information needs nearly 100% uptime of data center equipments. Since 365*7*24 working has become a norm for business, keeping that data center infrastructure alive and running the same is very critical. Unexpected failures will lead to a huge millions of dollars in productivity loss and opportunity cost loss. This is a big challenge, IT infrastructure consumes a lot of energy, and in times of increasing the worldwide demand, huge operating expenses can put a serious loss in the information technology (IT) organization’s operating budget.
Since we need for high availability rates, the ever-increasing cost of power, higher server traffic, and constraints on electrical power capacity, data center ope-rators are now looking for ways to increase the performance and to optimize their KW/Sft consumption, all while reducing costs. Reducing the power consumption in a data center while maintaining high availability is not a easy task, but at the end the rewards are high due to this activities. In America, Servers and data centers have consumed 61 billion kWh which is 1.5% of total US power consumption in 2006 and it is expected to consume more than 100 billion kWh by the end of this year. To ensure the redundancy and low operating costs, the power distribution and cooling infrastructure must
be efficiently managed. Failures emanating from electrical or mechanical failure can be prevented by best maintenance practices and predictive/preventive maintenance (P/PM) that are presently in place at most data centers around the world. To reduce the power consumption and address ‘green’ operating requirements, data center operators are now looking for the ways to increase the temperature set points.
In the present scenario, managing a data center involves more than solid IT operations itself since it involves other engineering aspects as well. Since the operating temperature is directly proportional to power consumption, reliability of data center and equipment operation, infrared thermography (thermal imaging and thermal mapping) can be used to monitor power consumption, cooling effectiveness, and IT equipments operations on real time basis. To monitor the condition of electrical equipment, cooling equipment, and computing equipment at the heart of the data center, is exactly where thermal infrared thermography (IRt) can help the most! This technology will help to predict the failure which will cause a huge business and opportunity cost loss to the organization.
Infrared thermography is used to find, diagnose, and document the problems such as short-cycling of the air conditioning system, hot spots, loose connection in the electrical systems, and worn-out bearings in the engineering equipments. Once repairs have been made based on the observation which is made, infrared thermography can be used again to recheck the equipment in order to make sure that the maintenance personnel took the right corrective action. This kind of activity is presently done at certain frequencies and frequency of this activity is depending upon the failure statistics.
Two main categories are:
© 2017, IRJET | Impact Factor value: 5.181 | ISO 9001:2008 Certified Journal | Page 859
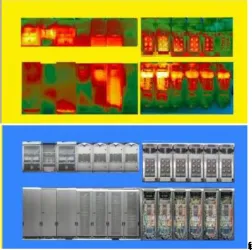
Because the complete picture is captured in-situ, issues thatwere not obvious when the room and cooling system were designed become apparent on a real time basis.
[image:2.595.37.257.334.499.2]Fig 1: Heating ventilation and air conditioning system.
Fig 2: Heating ventilation and air conditioning system.
Figures 1a and 1b. “Down the aisles” thermal image of the raised perforated floor and servers of a data center utilizing hot aisle/cold aisle configuration. This is the way that we looked at data centers’ cooling systems in the past, but the method is not sufficient to get the overall picture necessary to solve complex cooling problems.
Electrical Power Distribution and Mechanical Systems. Conducting the Infrared Thermography as a predictive maintenance on electrical and mechanical equipment is critical to keep the trouble free operation and it is the best predictive maintenance practice in power industry. In fact, Infrared Thermography in electrical has been the most accepted out of all IR applications and there are lot of technical papers on this subject. Infrared thermography based predictive maintenance is a must at any data center and it is associated equipments to increase the reliability and redundancy of data center operations. The electrical
switchgear, motors and motor controls, HVAC equipment, uninterruptible power supplies (UPS), automatic transfer switches (ATS), power distribution units (PDU), batteries and generator equipment, and all electrical devices that feed the server systems must be checked on real time basis with infrared thermography and other testing on a regular basis to assure high reliability.
2. WHY USE REAL TIME ONLINE IR THERMAL MAPPING IN DATA CENTERS
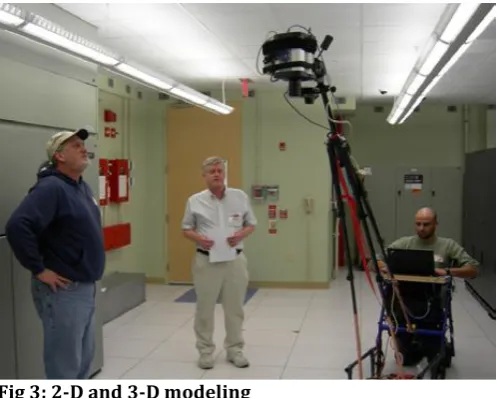
Infrared thermography has been in use for preventive and predictive maintenance type of IR surveys for data centers ‘electrical distribution systems for over twenty years. Sometimes it is used to check the cooling effectiveness of the floor. It is true that the method we were using, looking down the aisles (see Figures 1), was satisfactory to look at a certain spot or two on the raised floor or server, but it is not sufficient to get a true picture of the heat distribution in the whole data center. To achieve that, we had to come up with a better way. So, in the recent years, we focused our research to develop a methodology for collecting and processing the images on a real time user friendly, easy to understand 2-D (2-dimensional) and 3-D (3-dimensional) displays which can be used to understand the present condition and to regulate the HVAC systems accordingly.(see Figure 2). The purpose of creating a heat or thermal map is two-fold: to confirm efficient design, and to find problems on real time basis.
intranet server frames is the important target of an enterprise data center.
Fig 3:2-D and 3-D modeling
[image:2.595.308.557.473.672.2]© 2017, IRJET | Impact Factor value: 5.181 | ISO 9001:2008 Certified Journal | Page 860
3.DATA CENTER COOLING SYSTEMS
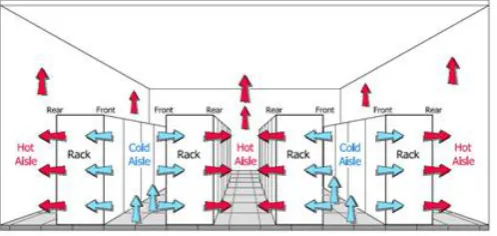
Normally, data centers have been air-cooled. Even today, the typical data center is air-cooled, utilizing the hot aisle and cold aisle layout (see Figure 3).
Fig 4:Data Center Cooling System (Typical Hot Aisle
Cold Aisle Layout shown). Source: ASHRAE3
Online real time thermal imaging monitoring technique is used to monitor and control the HVAC systems.
Chilled air is fed from the computer room air conditioning (CRAC) units to the cool aisles under a raised floor through perforated tiles (diffusers) up into the cool aisle, into the equipment and out of the hot aisle. The hot air is then returned to the CRAC units. Data center cooling systems have changed a lot over the past 25 years, but due to the issues discussed above, new designs are being developed and tested now. Cold aisle containment and liquid cooling. Cold aisle containment uses a raised floor, but contains the cold air between the cold aisle racks, sending the cold air directly to the server inlets, will reduce air mixing and short-cycling. Liquid cooling is used within most of the CRAC units, but liquid-cooled racks take the advantage of enhanced heat transfer characteristics of liquids. Since the CRAC units can be installed outside the main floor area, this design will eliminate the short-cycling. These systems are more complex and expensive now, but may become more and more important as server densities increase beyond air cooling capabilities. But all these systems require a real time data for controlling the HVAC systems in a precise manner. Since thousands of temperature sensors can’t be installed in the data center to maintain the perfect temperature and humidity.
4. DEFINING THE PROBLEM WITH HOT AISLE/COLD AISLE/CONVENTIONAL COOLING SYSTEMS
The electronic, electrical, and mechanical components within a data center all generate heat while it is in operation. Unless the heat is removed, the ambient temperature will rise automatically, it may be beyond design specifications which will result in electronic equipment malfunction. The temperature and distribution of air within the room is
managed by the air conditioning system and influenced by the layout of the server racks.
ASHRAE’s “Thermal Guidelines for Data Processing Environments” recommends a temperature range of 61-75°F and humidity range of 40-55% with a maximum dew point of 59°F as optimal for data center equipment conditions. HVAC systems help to control humidity by cooling the return air, but keeping it above dew point. Too much humidity and moisture may begin to condense on internal components which will lead to short circuit and failures. Too little humidity will result in static electricity discharge problems which may damage the electronic components. In the case of a very dry ambient, ancillary humidification systems may be needed to add water vapor in order to increase the humidity. So, under certain conditions, the control of humidity works against the control of temperature and vice-versa. Many server racks which is currently in service today are too hot to meet industry standards for maximum IT reliability and performance as reported by uptime Institute.
Figure 4. Data Center Cooling System (Typical Hot Aisle Cold Aisle Layout shown). Source: ASHRAE34
“Institutes which does research into computer room cooling indicates 1/3 of all perforated tiles are incorrectly located and 60% of all available cooling capacity is being wasted by bypass airflow. Increasing under-floor static pressure to get air where it needs to go requires permanently blocking all unnecessary air escape routes. This includes sealing cable cutouts in the ducts behind and underneath products or racks (this unmanaged airflow is what is really cooling most computer rooms) as well as the penetrations in the floor or walls or ceiling and any other openings in the raised floor. Perforated floor tiles with 26% openings can be replaced with 40% and 60% grates to permit a much higher airflow. For sites with unused raised floor space deliberately spreading equipment out to create white space and reduce the averaged gross watts per square foot power consumption will be a viable option.” The poor link in the system that can lead to a hard failure and loss of availability is lurking in every data center operations. It is the component that is most susceptible to failure by heat at the lowest temperature. But no one knows exactly where that component is located until it fails. Accurate and even cold aisle cooling is the best practice available to a data center operator. Identifying and eliminating ‘hot spots’ is the goal of any uptime-conscious data center in charge. Identifying and eliminating ‘cold spots’ is the goal of any energy conscious data center manager. Thermal mapping satisfies both.
[image:3.595.38.287.160.278.2]© 2017, IRJET | Impact Factor value: 5.181 | ISO 9001:2008 Certified Journal | Page 861
Hence we have come up with a solution to have a real time25*7*365 online thermal imaging system which monitors cooling efficiency of the room such as temperature and humidity by using a thermal camera which monitors and sends the information to the controller software. The real time input from the thermal camera is analyzed and compared against the set value in the controller. Accordingly by using PID logic the air conditioning system is regulated in order to get the desired parameters in terms of temperature and humidity. This approach will ensure that the data center cooling system always meet the required condition without fail. This system can be implemented in zone basis, in order to achieve the precise ambient condition. Dedicated camera will be mounted on each zone which will manage the HVAC equipment on those zones. Also through online monitoring we can also parallel monitor the condition of the equipment in electrical and mechanical perspective.
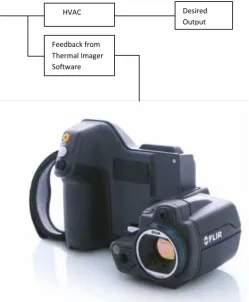
This approach will help to save the energy significantly because HVAC works on need basis and not on continuous basis. Also precise set values can be achieved by using PID logic which fine tunes the HVAC requirement for the data center room. This approach also alerts the maintenance personal about the present condition of the equipments. PID Controller Logic:-
Fig 5:PID Controller Logic
5. TOOLS FOR ANALYZING THE DATA CENTER THERMAL ENVIRONMENT
5.1 CFD Thermal Modeling With Real Time Input
The data center’s chilling system must be designed and engineered to provide cooling to computer components and not necessarily for room. The objective of the design of the cooling system is to provide a clear path from the source of chilled air to the intakes of the servers and to return the heated exhaust air to the CRAC suction efficiently. Data centers are normally designed and drawn with computer-aided drafting and design (CADD) software and modeled using computational fluid dynamics (CFD) modeling. These tools can predict performance for the design of a new data center. CFD is a valuable tool to predict the data center thermal performance. Acceptable performance from the equipments depends on accurate modeling of the energy-consuming components and the heat that they produce. CFD is, however, limited by the granularity of input data, set point value and as a result, we take the real time data from the thermal imager to control the HVAC. No matter how complex and well-prepared, CFD modeling is not reality because of inaccurate input data from the sensors. It not possible to install thousands of temperature sensors across the data center. Also simple things like under-floor cable or ducting installations have significant impact on theoretical flows of cooled air. Deviations from ideal performance will only show up after physical testing. Also, during and after construction, changes will happen. Unforeseen issues like adding servers or increasing server equipments are rarely re-modeled after construction. Contractors move equipment, change cabling and conduit routes and HVAC ductwork, inadvertently creating voids and obstructions, reducing or increasing air pressure, and diverting the flow of cooled and heated air. Obviously, these types of unforeseen changes to the thermal dynamics of the cooling system are seldom modeled. So, Infrared thermography is used to validate the CFD model (in a normal operating condition) and also to monitor the data centers on a real time basis to control the HVAC Unit, direct HVAC technicians and IT managers to heating problems (hot and cold spots). After repairs have been accomplished, IRt is used to check the repairs on real time basis.
Hence we need to take the 2D & 3D thermal imaging of the entire data center and we need to position the camera depending upon the criticality of the component by separating in to zones. So that we can control each zone to the required conditions. This will help the HVAC system to control and monitor individual locations in a very effective by real time monitoring and control.
Add on to this online real time monitoring will help to continuously record the data about the temperature profile of the critical component to predict the potential failure possibility of the component.At the end out objective is to maintain the temperature required for the components and not for the room as a whole which is a waste of energy.
HVAC
Feedback from Thermal Imager Software
[image:4.595.38.288.434.737.2]© 2017, IRJET | Impact Factor value: 5.181 | ISO 9001:2008 Certified Journal | Page 862
5.2 Online Real Time Thermal Mapping of a Data Center
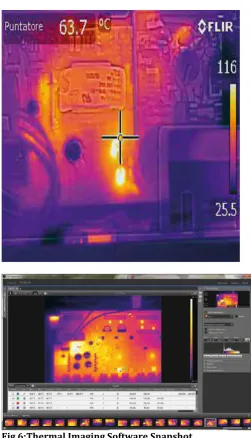
[image:5.595.305.557.91.530.2]Online real time thermal mapping is a new approach to capturing the full “in-situ” thermal condition of a data center and all of its equipment by 365*24*7. The key advantage is that it is possible to get an overall view of the thermal condition of the entire rooms for a given point of time while still having the capability to zoom in on specific problems and also by zone wise by using a dedicated cameras which can do this activity. This is very different from more traditional methods because it allows overall context and viewpoint selection, much like one gets with CFD modeling, Also the conventional method takes the thermal imaging on certain frequency basis. but this is actual thermal imagery on real time basis. For example, online data can demonstrate how a local thermal pattern visible in one aisle is actually the sign of a cooling air blockage across several aisles and also actual temperature and humidity. When the overall layout of the servers, floor, walls, and ceiling is available, what appears to be good thermal performance in one image may actually be wasteful excess cooling in the data center when the entire thermal map is analyzed. These problem areas are easy to see only with the overall image on a real time basis. Conventional temperature sensors have the disadvantage of monitoring temperatures only on specific locations placed in various strategic locations, sensors are a good idea to monitor overall changes, but are certainly no replacement for online real time thermal imaging. Typically, a single thermal image has more than 75,000 thousand temperature points and, for instance, a six thousand square foot data center thermal image will have many millions of temperature points. Another positive aspect of thermal mapping is that it allows for trending (comparing data gathered at different times). Information that did not appear to be important at the time of the survey can be used to discover a change in the cooling system. For example, during one survey, an area with no visible problems might be covered by thermal mapping on real time basis. Where more conventional surveys might not capture that spot because it showed no apparent problems. When a subsequent survey shows a problem, it is possible to see the change or show that nothing has changed.. Every data center is having a equipment that is important to different groups of people. By methodically capturing all the thermal data, controlling the HVAC on a real time basis and carefully post processing it into user-friendly displays, each functional people can see what is important to them, without having to be present during the survey. Also, experts in different disciplines can review the imagery data trends from the software and prepare reports at remote locations. To create a thermal map, one must collect the thermal and visual imagery in an ordered manner, carefully post-process it, and create the construct to display it in 2-D and/or 3-D. To create meaningful reports, the thermal imagery must then be analyzed and all these activities can happen on a real time basis for predicting the problems and also to control the temperature, humidity in the HVAC systems.
Fig 6:Thermal Imaging Software Snapshot.
The IR software allows to make high speed recordings and perform advanced thermal pattern analysis on real time basis.
5.3 2-D Thermal Mapping View of Data Center Floors
© 2017, IRJET | Impact Factor value: 5.181 | ISO 9001:2008 Certified Journal | Page 863
map presented below to see if there are clues to otherproblems through real time online monitoring.
5.4 2-D Thermal Mapping View of Data Center Server Racks
Thermal mapping of server racks provided below in Figure 6 represent highly detailed front-facing images of the data center server equipments. This is different from the looking “down the aisle” shots shown in Figures 1. By combining IR and visible images, it is possible to clearly see the details and accordingly corrective action can be taken immediately. By using this presentation it is also possible to show the cabinets with the doors open. The thermal imager software will merge the thermal image with normal image in order to know the exact point of issue. This will help the maintenance personnel to tackle the issue very quickly by locating the exact point of issue. In this sample, the details of the top of the servers are shown in a way that Figure 4.
Fig 7:IR image
Thermal map mosaic IR image of a set of thirteen server racks in a data center.Thermal map mosaic IR image of a set of thirteen server racks in a data center.
Fig8 Fig 9 2-D
zoomable thermal map image of a 5,000 square foot data center main floor.
fig 10: imagery server
[image:6.595.306.559.103.353.2]Zoomable thermal map imagery server racks (overview).Figures 8 and 9.2-D zoomable thermal map image of a 5,000 square foot data center main floor. Figure 6b. Zoomable thermal map imagery server racks (details). Figure 6a. Zoomable thermal map imagery server racks (overview). 6allows them to be related to the images of the fronts. Other combinations are available as needed.
Fig 11:Zoomable thermal map imagery server racks
5.5 3-D Thermal Mapping View of Data Center Floors
[image:6.595.307.557.470.624.2]© 2017, IRJET | Impact Factor value: 5.181 | ISO 9001:2008 Certified Journal | Page 864
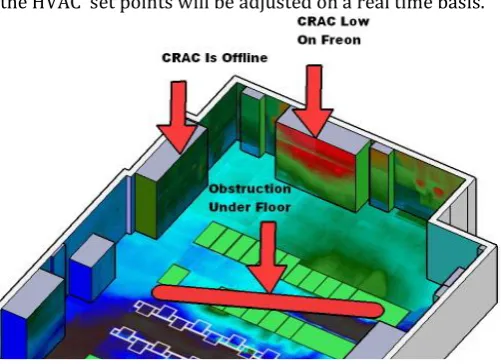
can be rotated and viewed from any angle and accordingly [image:7.595.36.287.118.300.2]the HVAC set points will be adjusted on a real time basis.
Fig 7: Thermal Mapping View of Data Center
3-D Thermal map of the actual heat in a data center. Thermal mapping discovered a CRAC unit that was low on Freon. At the same time, it showed that another CRAC unit which could have handled the load was not operating because the control program showed that the other CRAC unit was operating, even though it was not cooling that area the room.
In this case (see Figure 7), the context of the walls and floor view shows a relationship between a warm floor and an apparent problem with the CRAC unit through a thermal camera mounted. By involving an experienced HVAC professional, it was determined that even with a properly functioning thermal control system, the cooling was inadequate. So we need to control the temperature, humidity set points on a real time basis by using a thermal imaging camera. The CRAC unit that is shown to be offline could have taken over for the one that is low on Freon. But because the control system and the operators saw that the defective unit was operating, Only the IR survey of the entire area showed that something was wrong. The complete 3-D thermal map of the floors and walls provided the big picture that allowed for remedial action and also an input to HVAC to regulate the temperature of HVAC. In addition, other views that show the floors and walls in the cooler end, lead one to believe that it is overcooled. This provides an opportunity to save money in terms of saving the electricity. There is also an issue of conflict between the cooling and the humidity control systems. Overcooling below the dew point can trigger [electrical] heating to raise the temperature. This can have significant energy ramifications as the two systems fight one another. Expert HVAC personnel with access to the total picture can perform this kind of analysis without even having to be on site. This conventional approach can be replaced by online monitoring which can give the outin feedback on every second. Instead of waiting for the next frequency report to come on conventional method, with this real time monitoring we can know the status immediately with control of HVAC unit as well.
6.THERMAL IMAGING OF THE POWER DISTRIBUTION SYSTEMS IN DATA CENTERS
Electrical and mechanical predictive maintenance is the next part of this thermography. Infrared predictive maintenance (IR/PM) is a must in a critical facility like a data center. The main electrical switchgear, HVAC equipment, UPSs, ATSs, PDUs, batteries, battery panels, generator panels and switches, motors and motor controls, and the electrical panels that feed the server systems must all be checked with infrared thermography on a certain frequency to assure high reliability (see Table 1).
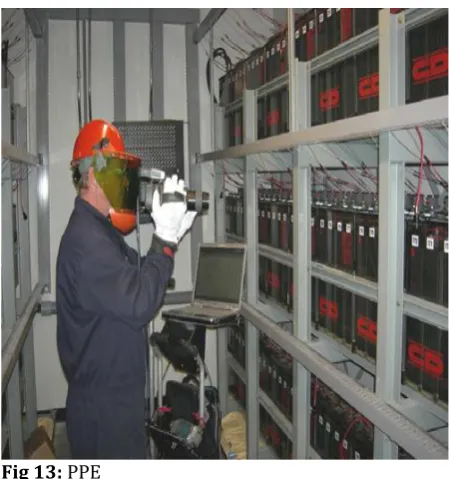
Since the criticality is high, so there must be accountability of all survey results by function wise, especially all of the equipment associated with the cooling, UPS, and server systems. Documentation is very important to keep the track of what was observed and what corrective action was taken against the observation. This can be done by recording the entire survey on real time online capturing fully-radiometric IR images of all equipment, whether problems exist or not. In either case, a data log of all equipment surveyed must be created including a time/date stamp reference for all equipment. Safety is utmost important during any infrared survey of electrical and mechanical gear and this is no different in data centers (see Figures 8a & 8b). However this area also will be monitored online to identify the potential problems immediately. But all the above are a conventional approach. Whereas with online real time monitoring we are understand and tackle the issue immediately. This will improve the reliability of the data center operations by eliminating the downtime related to equipment issues caused by poor maintenance, temperature related issues.
6.1 Specialized Infrared P/PM Inspections
© 2017, IRJET | Impact Factor value: 5.181 | ISO 9001:2008 Certified Journal | Page 865
Table 1. TIA-942 standard for reliability in data centers. Thisstandard was developed by the Telecommunications Industry Association (TIA) to define standard guidelines for data center reliability
Tier Rating Availability
Tier 1 Basic 99.671%
Tier 2 Redundant Components 99.741%
Tier 3 Concurrent Maintainable 99.982%
[image:8.595.29.294.190.289.2]Tier 4 Fault Tolerant 99.995%
[image:8.595.36.290.335.603.2]Fig 12: IRISS
Fig 13: PPE
A Safety around electrical equipment is the #1 consideration during infrared surveying. Some of the options: fig 12 shows an IRISS infrared window installed in electrical cabinet5. The thermographer safely holds an infrared camera up against a viewing port or window to see inside the switchgear.
© 2017, IRJET | Impact Factor value: 5.181 | ISO 9001:2008 Certified Journal | Page 866
[image:9.595.43.299.73.733.2]Fig 14 : Electrical infrared predictiveMaintenance
Fig 15: Electrical infrared predictiveMaintenance
Electrical infrared predictive maintenance sample report. This problem was reported and repaired during a planned outage, causing zero downtime
[image:9.595.302.553.91.372.2]© 2017, IRJET | Impact Factor value: 5.181 | ISO 9001:2008 Certified Journal | Page 867
second source of utility power can be utilized. Usually, theUPS, through a power distribution unit takes the AC power and converts it to DC. There, the bank of batteries is tied in. The DC power is then inverted back to AC to feed the computer hardware. Utility main power supplies are typically owned by the local power company, but are sometimes owned by the user. Often, a looped system feeds power from two different power company substations and can be “back fed” if the power stays out on the primary. No matter who the technical owner of the utility equipment is, it must be checked with IR just like all
Other components to increase the reliability of data center operations. Newly added power equipment has to b commissioned with IR has become standard. By pulling power from a load bank, resistive load testing is used to fully simulate and test all equipment by increasing loads incrementally on a gradual basis. Any problems that are encountered during this “burn-in” are repaired immediately and the system is rechecked before putting the equipment in operation. All these conventional approaches can be eliminated by a single camera which can do dual functions simultaneously.
7. CONCLUSION
Since the heart of the data center is its power and cooling system, data center managers are now using infrared technology to do real time monitoring, control and repair these systems through the use of IR thermography, predictive maintenance, and online real time thermal mapping. Data centers of the future will be more reliable and use less energy by using an individual zonal cooling with a dedicated camera and in turn it controls the HVAC systems as per the set point. Also it does the instantaneous identification of problems on electrical system on real time basis. This improves the redundancy in data center operations.
REFERENCES
1 Report to Congress on Server and Data Center Energy Efficiency (PublicLaw 109-431) U.S. Environmental ProtectionAgency ENERGY STAR Program, August 2, 2007
2 Data Center Knowledge website Miller Webworks LLC.http://www.datacenterknowledge.com/archives/2008/ 10/14/google-raise-your-datacenter-temperature.
3 Ashrae. 2004b. Thermal Guidelines for Data Processing Environments.
4.Atlanta, GA: American Society of Heating, Refrigerating and Air Conditioning EngineersFigures 14&15. Electrical infrared predictiveMaintenance sample report. This problem wasreported and repaired during a planned outage,causing zero downtime.84 UpTime Institute, Procedures and Guidelines for Safely Working in anActive Data Center page 9., UpTime Institute (12/18/06).
5.10 Things You Need To Know About Infrared Windows Copyright ©2009by IRISS, Inc. All rights reserved
BIOGRAPHIES
1.Ruby priyadharshini,
Assistant Professor,
Department of Computer Science ,
voorhees college, Vellore.