A WEB SITE USABILITY MEASURE USING
NAVIGABILITY MAP METRIC
1SANDEEP KUMAR PANDA, 2SANTOSH KUMAR SWAIN, 3RAJIB MALL
1School of Computer Engineering, KIIT University, Bhubaneswar, Odisha, India 2School of Computer Engineering, KIIT University, Bhubaneswar, Odisha, India 3Department of Computer Science and Engineering, IIT Kharagpur, West Bengal, India
E- mail: 1[email protected], 2[email protected], [email protected]
ABSTRACT
We propose a website navigability map metrics suite. To evaluate a large scale website, use of website navigability map metrics opens up the potential of employing intelligent tools. We propose a set of four metrics associated with navigability rating based upon computing site navigability map complexity. To validate our proposed metrics we have evaluated the Cyclomatic complexity of 10 electronic commerce websites. We have conducted empirical studies to study the effectiveness of our proposed metrics.
Keywords: Navigability Map Metrics, Cyclomatic Complexity, Intelligent Tool, Electronic Commerce
1. INTRODUCTION
Over the last decade, there has been a rapid proliferation in the use of internet for buying and selling, advertising and marketing, together with transition obtains towards consumers. There is also a phenomenal increase in the use of the internet in B2B, mcom and other web applications. However, web applications vary a great deal in facilitating user productivity. Users' experience considerable variance in transacting their business while using different websites. An important reason for this situation is that web site design is largely subjective and lack of standardized web site design methodologies. Further, tools and techniques to quantitatively evaluate the effectiveness of web sites is scarce. In this context, We propose a metric to evaluate the effectiveness of a website in facilitating productivity. Our metrics to evaluate websites are based on several factors associated with a web application.
A key factor affecting the productivity of website explorer is usability. Usability is normally a general way of measuring how effortless any one user interface should be used [1,2]. Nielsen [2] stated that if visitors were not able to easily locate an item they are disinclined to use the website for initiating purchase transactions. Calculating the simplicity, such as usability, navigability is regarded as the crucial attributes.
In the structure of the website navigability map, navigation plays a significant function
because it determines the path to be traversed to find a desired piece of information in a web page. The navigable map of the site appears as a graph beginning of the home page as header node. The website header node such as the home page is structured in a particular approach that it should not consist of lots of paths. According to Yen et.al. [ 4] maximum number of links in a path are twenty in a web page and there are only four clicks needed to get to a required page.
In this paper, We are focused on the way of measuring of the usability of websites in connection with navigation. Here, We specify navigability map is the easiest way to find an information by the user to locating a webpage within a website. We propose four metrics for navigability map complexity.
The rest of the paper has been organized as follows. Section 2 represents an investigation of connected works. Section 3 explains the four main metrics with web system complexity. Section 4 presents the experimental results. Section 5 describes the empirical evaluation. Section 6 concludes the paper
.
2. LITERATURE SURVEY
should be in such a way that the user can easily interact website without any formal training. A web site interface is a complex mix of text, links, formatting, graphic elements and site’s overall quality [5].
An effective web design is one that makes it easier for users to navigate through the different pages on the site [6]. The navigate map of a website appears as a directed graph where every single node serves as a web page and a path serves as a path to that page [7].
Zaphris et.al.[8], stated that in a website of 64 links, the design with 8 links per page and two levels resulted in fastest response time and lowest navigation efforts.
Rodriguez et.al.[9], designed a tool named as ANTS ( Automatic Navigability Testing System). The tool was showed the data flow from the remote system to the server easily. It was study the human behavior without observing where the user are located and which navigability map user can follow. Although the tool could be useful for future information retrieval concerning navigability, still the results showed little relationship between user behavior and navigability.
Jin et.al. [10], modelled a web site as <G, O>, where exactly G = (V, E) can be an outlined graphical record symbolizing an internet site; V stands for the number of nodes addressing internet pages; E represents the number of edges among internet pages, and O is the header node symbolizing home page associated with the web site. They suggested number of paths being measure navigability complexity. The large is the number of paths, the more complicated site construction is, the simpler to get an individual in order to explore the system like an ocean, as well as the poorer is the navigability.
3. NMM: OUR PROPOSED NAVIGABILITY MAP METRICS
To assess the usability, quality of the website, we have developed a metric which we have named as NMM.
3.1 Navigability Map Complexity
The pages in a website are linked with each other through hyperlinks. A user accesses the
desired information by following the hyperlinks. Since the amount of hyperlink that a user encounters can be larege, the users can get lost in the huge information, making it difficult to navigate. Our navigability map complexity metrics takes this into account.
The simple navigability map has one single page with no paths. The website navigability map complexity can be defined based on graph theoretical results. The header node such as the home page is structured root of a graph. In constructing a navigable map of a website like a graph, the user may know the how many amount of pages and dead end pages are their in a web site.
For a simple web page , we differentiate the digit of indegree paths and the digit of outdegree paths. Indegree is usually the amount of paths to a web page and outdegree is usually the amount of paths from the web page. As an example, the indegree of web page P is 2 and the outdegree of web page P is 4, shown in figure 1.
Figure 1: Indegree and Outdegree
Basically, indegree measures the amount of incoming paths and captures how easy it is to achieve a desired page. Lots of indegree signifies it limited to pages that carried out effortless functions recycled during the web site. More indegree paths should not consider as a essential key factor in measure complexity. Where as outdegree measures the amount of outdegree paths. A large outdegree increase the probability of a user getting lost. For this reason outdegree is the key factor in navigation. Based on this observation measuring website navigability map complexity is
WNMC1=∑
ୀଵ (1)
Out degree(i) = amount of out degree path in a page n = lots of pages within a web site
In the graph theoretical results it was found that all the directed graph, the summation of indegree paths is equal to outdegree paths, which is equal to the digit of strikeouts. Based on this observation, We can refine expression 3 as
WNMC1=∑
ୀଵ
The intuition behind WNMC1 is that a
simple website with less amount of web pages and paths is less complex than a complex website which consists of thousands of paths and pages. However, consideration to the size of website it is needed to know the relative complexity for comparison purposes. Fractioning navigability map complexity by the digit of nodes that is the amount of pages shows a normalized result. The second expression for measuring website navigability map complexity is
WNMC2=1 ∑ /
ୀଵ (2)
Generally expression 2 represents the navigability map complexity as the average digit of strikeouts per node.
According to Jin et.al. [12], in a web page the numerous individual path in a hyperlinked network is also considered as complexity metrics. On a navigability map every single node represents a web page. The header node associated with a navigability map, each and every individual level, many sub nodes like a web page, those should not have more paths broken along with an inactive node and a sub node those should not have more paths guides toward the node around the finish level. Now we have examined the website navigability map Cyclomatic complexity using the expression 3. According to McCabe [11], the Cyclomatic complexity should not exceed 10.
WNMCC1= (p-n+d+1) (3)
p = amount of node paths
n = amount of nodes in the navigability map d = amount of dead ends in the navigability map From the numerous individual path in a graph, we can derive the relative complexity as
WNMCC2= (p-n+d+1) /n (4)
4. EXPERIMENTAL STUDY
A super easy world-wide-web software program was developed. Typically the program comprises of site download solution which often downlowd all the site. A easy powermapper
(www.powermapper.com/download/sort) is needed inorder to produces a powerful HTML navigability map by the uniform resource locator (URL). The breadth first search algorithm is employed to navigate the web site originating in typically the header node which can be generally the home page. Almost all the web pages tend to be retrieved recursively coming from the internet site. The tool creates a website navigability map as a rooted graph with the header node as a home page. This eliminates all of the media and image files. Simply because, in the website navigability map there is absolutely no importance of such files. The tool is designed in such a way that, it calculates all the metrics according to the expressions which is derived in section 3.1 and store the data in the database.
The website of 10 Indian electronics commerce online shopping website were considered in our experiments. To keep anonimity, we have represented these as W1 to W10
respectively. The web site navigability map complexity amount is calculated from the web site navigability map applying expression 1. The relative complexity calculated using expression 2 and website navigability map Cyclomatic complexity and relative complexity calculated using the expression 3 and 4. Table 1 shows the computed metrics for the navigability maps.
For the comparison of complexity we derived the relative complexity WNMC2 and WNMCC2. We can find from the computed metrics that W2 website score the highest mark
where as W10 website becomes a more complex
structure in navigability map and remaining all websites are similar. Here, WNMC1 and WNMCC1
have the same behavior.
5. EMPIRICAL EVALUATION
We have conducted experiments to study the effectiveness of our proposed metrics on a few comparable web sites. The web sites chosen during the empirical exploration are all business to consumer electronics commerce websites. The electronics commerce websites are geographically located in India. The web sites are named as W1,
W2 to W10. In the empirical study 100 participants
experience in the computer field and 50 expert participants those who have more than 3 years experience in the computer field are selected. The age limit of those participants varies from 18 to over 50 years.
5.1 Evaluation Procedure
An evaluation procedure was developed to welcome the participants and to provide an introduction to the research. A consent form is designed with a proper format for all the 100 participants present over in this research work. All the participants have assigned a particular task that is purchasing a product in 10 electronic commerce websites.
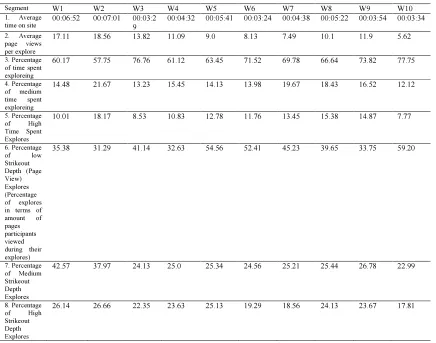
5.2 Customer Usability Evaluation
A test questionnaire was developed and hard to be filled out by the participants after they had completed the task. The questionnaire was selected based on the list of attributes of navigability collected from IEEE guidelines. The questionnaire includes 8 segments. Every single segment is dealt with a specific aspects of web navigability. Its contain has a amount of assessments for the participants to execute and to provide a quantitative value on the attributes. Segment 1 is concerned with the average time on site, Segment 2 is about the average page views per explore, Segment 3 is concerned with the percentage of time spent exploreing, Segment 4 tests the percentage of strikeout depth explore, Segment 5 is concerned with the amount of backtracking path to get a desired page.
Average time on site is calculated as overall time spent on site for all explores / Explores that is the highest value of this metric might indicate that participants interact extensively with the site.
Average page views per explore is calculated as the amount of page Views / Explores that is the highest value of this metric might indicate that: participants were interested in the site, or the content of the site is interesting, Low value of this metric might indicate that the site is difficult to navigate, or the content of the site is poorly written.
Percentage of time spent exploreing (Percentage of explores in terms of average time participants spent during their explores) derived as percentage of duration exploreing = (Overall Amount of Explores Spending between 0 Seconds
and 3 Minutes on the Site/ All Explores) X 100 that is if a site has a relatively high percentage of low time spent exploreing, then this could indicate either: the site is poorly targeted participants or it could be that the site has problems with its information architecture and usability or the site’s content are not relevant.
Percentage of medium time spent exploreing = (Overall Amount of Explores Spending between 3 and 10 Minutes / All Explores) X 100.
Percentage of High Time Spent Explores (also known as committed participant share) = (Overall Amount of Explores Spending more than 10 Minutes on the Site / All Explores) X 100 that is if a site has a high percentage of high time spent exploreing, this might indicate that participants engage in the activity of the site.
Percentage of Strikeout Depth (Page View) Explores (Percentage of explores in terms of amount of pages participants viewed during their explores) are derived as a Percentage of Low Strikeout Depth Explores = (Overall Amount of Explores of Two Strikeouts or Less/ All Explores) X 100 that is if a site has a high percentage of low strikeout depth explores, this might mean that the site is confusing or uninteresting.
Percentage of Medium Strikeout Depth Explores = (Overall Amount of Explores of 3 Strikeouts to Average page Views Per Explore / All Explores) X 100.
Percentage of High Strikeout Depth Explores (also known as a heavy user share) = (Overall Amount of Explores More than Average page Views Per Explore Strikeouts / All Explores) X 100 that is if a site has a high percentage of high strikeout depth explores, this might mean that the site is engaging and interesting or that the site is targeting participants properly and the ease of use of the site.
The particular answers are suggested in Table 2. Tables 2 reveals that right from an objective fuzzy standpoint, W2 online business
increased the best draw relating to navigability, and additionally W10 typically the lowest. It
complements Table 1 well.
6. CONCLUSION
We have proposed four metrics that can be used for evaluating the usability and productivity aspects of websites.We measured four metrics of electronics commerce internet site navigability map. Our experiment shows that a web navigability map complexity is key factors that can be used in a internet site measure. The empirical evaluation results suggest that navigability map complexity plays a vital role in the measurement of navigability. There are still limitations to the navigability map complexity, such as taxonomy within the page, layout of paths are the problems of navigability. We plan to extend our work to refine our work to consider productivity (understandability of the text) evaluation of websites.
REFERENCES
[1] Najjar, L., Designing E-commerce User Interfaces. In: R. W. Proctor, K-P. L., Vu. (Eds.) Handbook of Human Factors in Web
Design, Mahwah, NJ: Lawrence Erlbaum
(2005), pp. 514-527.
[2] Nielsen, J., Usability 101: Introduction to usability (2003).
[3] Benjamin Yen, Paul Jen-Hwa Hu, May Wang, “Toward and analytical approach for effective Website design: A framework for modeling, evaluation and enhancement”, Electronic Commerce Research and Applications 6, (2007), pp. 159-170.
[4] Furnas, G.W. “Effective view navigation”, Proceedings of CHI, Human factors in computing, ACM press, , (1997), pp. 22-27. [5] M.W. Newman and J.A. Landry, “Sitemap,
Storyboards, and Specifications: A Sketch of Web Site Design Practice,” Proc. Designing Interactive Systems: DIS 2000, automatic Support in Design and Use, ACM Press, New York, (2000), pp 263-274.
[6] Mendes, E., N. Mosley and S. Counsel. Web Metrics estimating, design and authoring effort. IEE E (2001).
[7] Offutt, J. Web Software application quality attributes. Quality Engineering in Software Technology, Nuremberg, Germany, (2002), pp. 187-198
[8] Zaphris, P. and Mtei, l. “Depth vs. dreadth in the arrangement of web links”, (2003)
[9] Rodriguez, M.G. “automatic data gathering agents for remote navigability testing”, March (2003).
[10]Jin, L., Zhu,H. and Hall, P. “Adequate testing on hypertext”, Information and software Technology, vol. 39, (1997), pp. 225-234. [11] T. J. M. Cabe, “A complexity measure,” IEEE
Transactions on Software Engineering, vol. 2,(1976).
[12] M.H.Halstead, Elements of software science. Elsevier : North-Holland, (1977).
Table 1:Summary of Evaluated Map Complexity Metrics
Web site Pages WNMC1 WNMC2 WNMCC1 WNMCC2
W1 5744 118423 20.6 112481 19.6
W2 6920 123483 17.9 120122 17.4
W3 3680 86760 23.6 86012 23.4
W4 4710 122948 26.1 122241 26.0
W5 3420 90482 26.5 90002 26.3
W6 6882 134256 19.5 133842 19.4
W7 7938 146734 18.9 146001 18.4
W8 3546 84310 23.8 83922 23.6
W9 5842 107493 18.4 103403 17.7
W10 4608 131789 28.6 128563 27.9
Table 2: Customer Survey Outputs of Navigability
Segment W1 W2 W3 W4 W5 W6 W7 W8 W9 W10
1. Average time on site
00:06:52 00:07:01 00:03:2
9
00:04:32 00:05:41 00:03:24 00:04:38 00:05:22 00:03:54 00:03:34
2. Average page views per explore
17.11 18.56 13.82 11.09 9.0 8.13 7.49 10.1 11.9 5.62
3. Percentage of time spent exploreing
60.17 57.75 76.76 61.12 63.45 71.52 69.78 66.64 73.82 77.75
4. Percentage of medium time spent exploreing
14.48 21.67 13.23 15.45 14.13 13.98 19.67 18.43 16.52 12.12
5. Percentage
of High
Time Spent Explores
10.01 18.17 8.53 10.83 12.78 11.76 13.45 15.38 14.87 7.77
6. Percentage
of low
Strikeout Depth (Page View) Explores (Percentage of explores in terms of amount of pages participants viewed during their explores)
35.38 31.29 41.14 32.63 54.56 52.41 45.23 39.65 33.75 59.20
7. Percentage of Medium Strikeout Depth Explores
42.57 37.97 24.13 25.0 25.34 24.56 25.21 25.44 26.78 22.99
8. Percentage
of High
Strikeout Depth Explores