ISSN: 1992-8645 www.jatit.org E-ISSN: 1817-3195
582
ON LONG-RANGE-DEPENDENCE SYNTHETIC DATA
GENERATION THROUGH HEAVY-TAILED
DISTRIBUTIONS
ABDULLAH S. BALAMASH
Department of Electrical and computer Engineering
Faculty of Engineering, King Abdulaziz University, P.O.Box 80204, Jeddah, 21589, Saudi Arabia
E-mail: [email protected]
ABSTRACT
Comprehensive analysis of the Internet traffic conducted over the last decade revealed the concept of long-range dependence (LRD) in the collected data traces. Some of this analysis work proved that this property is a result of the heavy tailed distribution of the packet inter-arrival time, which is a result of the heavy tailed distribution of packet size of the traffic sources. In this paper, we use this fact to build a traffic generator model that is based on multiplexing sources of heavy-tailed inter-arrival times and then counting
the number of arrivals in the successive periods of length T. To come up with a parameterized model, we
also study the effect of the heavy tailed distribution parameters (i.e. the Pareto distribution), and the time scale along with the number of multiplexed sources on the LRD of the generated traffic. Our model is different from the on/off models proposed in the literature that need to multiplex a very large number of sources, while we need only a few sources. Our findings are; 1. The LRD level is higher for sources with heavier tails; 2. There is a need to multiplex only a few sources; 3. The LRD level is higher for larger time scales; 4. Fixing the time scale and tuning the tail of the distribution helps us to come up with a parameterized linear model that only has one parameter, which is the Hurst parameter.
Keywords: Data generation; Heavy-Tailed Distributions; Long range dependence; Self-similarity;
1. INTRODUCTION
After the famous work of Leland et al. [1] had provided empirical evidence that LAN traffic exhibits self-similarity characteristics, researchers started to consider self-similar data models to describe network traffic in real systems. This new way of data modeling was a dramatic departure from the usual Poisson modeling that failed to capture certain features in the Internet traffic [2],
including, in particular, the long-range
dependence (LRD), which is the existence of significant correlations across large time scales. The LRD property is an important feature to capture in a network traffic model since it was found to have a considerable positive correlation with network device queuing delays [3].
Mathematical analysis of self-Similar processes is difficult and intractable and for this reason, researchers depend on simulation for mining information from real data sequences that are not always available and can be costly or impossible to capture. Traffic data models can be used to compensate for the shortage of real data as long as they capture the essential traffic properties, such
as, the LRD property. Several studies have shown that LRD is a result of self-similarity in Internet traffic, which is attributed to the heavy-tailed distributions of file size and packet inter-arrival time [4, 5]. Accordingly, in this paper, we present a simple method of generating LRD synthetic data traces that is based on multiplexing several traffic sources of heavy-tailed distributed inter-arrival times. Then the number of arrivals in a period of
time, T (the time scale), is considered as the
generated LRD data sequence. Moreover, we use this model to study the effect of the heavy-tailed
distribution parameters, the number of
multiplexed sources, and the considered time scale on the LRD nature of the generated traffic.
Our findings can be summarized as follows:
• Multiplexing sources of heavy-tailed
distributed inter-arrival times and counting the
number of arrivals in a period of time T produces
an LRD time series. This finding agrees with what was reported in the literature regarding the
LRD nature of Internet traffic, which isattributed
inter-ISSN: 1992-8645 www.jatit.org E-ISSN: 1817-3195
583 arrival time, which is in turn dominated by the heavy-tailed distribution of the packet size. Moreover, we found that the heavier the tail, the higher the LRD level of the generated data traffic. This finding is in agreement with [4].
• The degree of LRD is higher at large
time scales compared to small time scales. T[6].
• Increasing the number of multiplexed
sources does not affect the degree of self-similarity, which tends to contradict with what was reported for the Internet core, especially for short time scales [7]. This has to do with the overprovisioning in the core of the Internet where the packet inter-arrival time is dominant by the idle periods and not the packet size. On the other hand, in highly utilized links, the packet inter-arrival time is a function of the heavy-tailed distributed packet size [8].
• Our model is simple and scalable where
only a few sources are multiplexed since the LRD level is controlled by the time scale, in which case the number of sources can be kept very low.
• To generate a synthetic trace with a
given Hurst parameter, we need only to specify the shape parameter of the heavy-tailed distribution where we found that there is an approximately linear relation between the shape parameter and the Hurst parameter.
There are several methods for generating LRD synthetic traces proposed in the literature. Among the most widely used methods are the fractional Gaussian noise, and the fractional auto regressive integrated moving average (FARIMA) methods [9], the M/G/∞ queue model [10], the Random Midpoint displacement [11], the multifractal wavelet model [12], and others. Most of these methods are either not scalable (very slow when generating long traces), approximate, or not parameterized. Although, our method is very simple and fast (was implemented in a few lines of code using MATLAB and generated a very long trace in a matter of secondes) in generating very long data traces, the main goal of this work is not to compete with these sophisticated methods, but to have a simple model and outline the effect of the main features of the heavy-tailed distributions and the traffic aggregation level (time scale) on the degree of self-similarity. We also have to indicate that this is not the sole work that considers heavy-tailed distributions to
generate self-similar synthetic traces because one of the pioneering work by Willinger, et al. [13] is similar to our model, except that they consider multiplexing alternating on and off sources with heavy-tailed on and off durations. The number of sources in the on periods in a given interval is
considered a self-similar process when n
approaches infinity, which requires high
computation power to multiplex a very large number of sources. On the other hand, our generator is scalable, which only needs to consider multiplexing few heavy-tailed sources, as will be shown later.
The rest of the paper is organized as follows: Section 2 gives an overview of self-similarity and long range dependence. In Section 3, we describe the traffic generation principle. In Section 4, we explore the effects of the number of multiplexed
sources, the effects of the heavy-tailed
distribution parameters, and the effects of the time scale on the LRD level of the generated synthetic traces. In Section 5, we propose a parameterized traffic generator, and in section 6, we test the model and present some experimental results. In Section 7, we test the stationarity of the generated data. We conclude our work in Section 8.
2. SELF-SIMILARITY AND LRD
Informally, self-similarity refers to the degree of randomness where a non-self-similar sequence is totally random and a self-similar sequence exhibits a degree of non-randomness. This degree of non-randomness can be utilized toward better system prediction and management. The self-similarity nature of a time series is manifested in several features. One of these features is the LRD feature that is characterized by a single parameter,
the Hurst parameter (H).
Let , 1 be a covariance-
stationary process with mean µ, variance σ2, and
autocorrelation function (ACF), ρ(k), defined as:
~ିఉ → ∞
, 1
where f is an asymptotically slowly decaying
function. Let ሺሻ (defined in (2)) be the
aggregated processes of computed by averaging
x over non-overlapping blocks of length m, and let
ISSN: 1992-8645 www.jatit.org E-ISSN: 1817-3195
584
ሺሻ 1
ୀሺିଵሻାଵ
. 2
The process x is called exactly self-similar if
[14]:
ሺሻ , 3
and the variance of the ሺሻ is defined as:
ଶିఉ, ! 1, 4
This means a persistent correlation and a slowly decaying variance across different time scales are in contrast with the vanishing correlation and the exponentially decaying
variance for non-self-similar processes ( 1).
The parameter is an indicator of the degree of
self-similarity, which is expressed as a function of the Hurst parameter:
2 2#. 5
The process x is called asymptotically
self-similar if (3) and (4) hold for large values of k.
These features are sometimes called the Hurst effect that describes second order statistics of the aggregated versions of the self-similar process as a function of the Hurst parameter and the
aggregation level, m. There are different
representations of the Hurst effect. For example, one representation of the Hurst effect describes the relationship between the variance of the wavelet coefficients of the Haar Wavelet
transform at a given scale j and the Hurst
parameter as [12]:
%&' (2ሺଶுିଵሻ, 6
where Wj is the wavelet coefficients at scale j,
and c is a constant value. In all of these
representations, the second order statistics are somehow preserved across different time scales. The degree of preservation is controlled by a single parameter, the Hurst parameter.
3. TRAFFIC GENERATOR PRINCIPLE
Initially, the model has several parameters; the
number of multiplexed sources, n, the
heavy-tailed distribution parameters of the inter-arrival
times, and the time scale T. The generation
process starts by generating n sequences of
heavy-tailed distributed inter-arrival times based on selected parameters of the distribution. Then
the n sequences are interleaved after computing
the arrival instances of the n sources to generate a
single sequence of arrival instances. This sequence is divided into non-overlapped blocks of
duration T. The number of arrivals in each block
is computed to generate the self-similar time series. To set up an algorithm by which we select the various parameters, in the subsequent section, we study the effects of these parameters on the generated data sequences.
4. THE EFFECT OF THE MODEL
PARAMETERS
In this section we study the effects of the model parameters on the degree of LRD. In other words, we study the effects of the heavy-tailed
distribution parameters, the number of
multiplexed sources, and the time scale on the LRD level. One of the well-known heavy-tailed distributions is the Pareto distribution that has the probability density function (pdf):
௫ , * ! ∞, + , 0, 7
where a is the scale parameter, and b is the
shape parameter. The mean and the variance of x
are defined as:
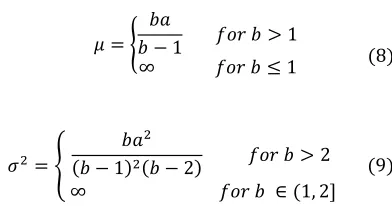
/ 0+ 1 1 + , 1+
∞ 1 + * 1 8
ଶ 3
+ଶ
+ 1ଶ+ 2 1 + , 2
∞ 1 + ∈ 1, 2 9
To test the effect of the various parameters, we first fixed the distribution parameters, and the number of multiplexed sources. We then generated different traces for different values of
the scale parameter T. For each value of T, we
generated 30 traces and the Hurst parameter for each trace is estimated and the average value is computed. The estimated Hurst parameter is then
plotted against the time scale T. The estimation of
the Hurst parameter is done using the Abry-Veitch estimator [15]. We repeated this process
for several values of the shape parameter, b.
[image:3.595.311.507.479.582.2]ISSN: 1992-8645 www.jatit.org E-ISSN: 1817-3195
585
where a =1 and n = 5. The T values were selected
as multiples of the mean of a single source; µ.
Selecting T this way does not add any benefit
other than controlling the range of T by
discretizing its value around the value of µ.
To see the effect of the shape parameter of the distribution, and the effect of the time scale, figure 1 indicates that whatever the time scale of the generated trace is, increasing the shape parameter of the distribution decreases the Hurst parameter value. Moreover, increasing the time scale increases the Hurst parameter value to a certain degree, and then the value seems to stabilize.
To see the effect of the number of sources, we
ran a similar experiment, but for n = 10 and the
result was identical to the one with n = 5. This
seems to contradict what has been reported in the literature about the Internet cores [7], but the Internet cores are overprovisioned and our model represents highly utilized links where packet inter-arrival time is controlled by the heavy-tail distributed packet size and not by the idle times as was explained for the Internet cores [8]. Moreover, it seems that one can use only a single source instead of multiplexing several sources, but a single source can produce traces with low mean and low variance, which can affect its stationarity (long run of the same number).
To test the effect of the scale parameter a, we
ran the same experiment using different values for the scale parameter. These experiments produced the same result as shown in figure 1, which proves that the scale parameter has no effect on the degree of self-similarity, which was expected since changing the scale parameter does not change the shape of the tail. Accordingly, in all coming experiments, we use the value 1 for the
scale parameter a.
Figure1. The Hurst Parameter As A Function Of The Aggregation Period For Different Values Of The Pareto
Distribution Shape Parameter
5. THE PARAMETERIZED TRAFFIC
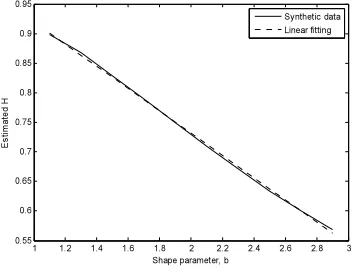
It was clear from figure 1 that increasing the shape parameter decreases the degree of self-similarity. Moreover, it seemed that the change in the Hurst parameter is almost linear with respect
to the shape parameter for T values greater than µ.
To get a clearer picture about this linear relation, we ran several experiments where we fixed the
time scale T and changed the value of b and we
plotted the estimated Hurst parameter versus the shape parameter. We did that for several values of
T greater than µ. Figure 2 shows that these plots
represent almost linear lines. One can apply linear regression to come up with the best line fit. We
here only consider the plot with T equal to 2µ and
the same thing can be done for the other values. Figure 3 shows the linear regression. From the linear regression, we have a linear model for the
value of b as a function of H.
The mean value (µst) for a synthetic trace can
be computed as the mean inter-arrival of a single
source; µ, the time scale; T, and the number of
sources as:
/௦௧
்
ఓ 10
Since we considered the value T = 2µ in our
linear model, the mean is a function of the
number of sources (/௦௧ 26. Increasing the
number of sources increases the mean.
0 0.5 1 1.5 2 2.5 3
0.2 0.3 0.4 0.5 0.6 0.7 0.8 0.9 1
α (T = α µ)
H
ur
s
t
p
ar
amet
er
,
H
n = 5, a = 1
ISSN: 1992-8645 www.jatit.org E-ISSN: 1817-3195
586
Figure 2. The Hurst Parameter As A Function Of The Pareto Distribution Shape Parameter
6. MODEL TEST
Now we test our linear model by generating several traces with Hurst parameters ranges from 0.6 to 0.85. For each value of the target Hurst parameter, we generated 30 traces and estimated
the H values with their 95% confidence intervals.
[image:5.595.97.277.459.597.2]Table 1 shows the estimations of the Hurst parameters of these traces. From Table 1, it is clear that the generator can accurately generate synthetic traces with any arbitrary Hurst parameter.
Figure 3. The Hurst Parameter As A Function Of The Pareto Distribution Shape Parameter For T = 2µ
Table 1. Estimated Hurst Parameters
Target H Sample mean 95% Confidence
Interval
0.6 0.6003 [0.5987, 0.6018]
0.65 0.6473 [0.6455, 0.6491]
0.7 0.6946 [0.6931, 0.6981]
0.75 0.7475 [0.7460, 0.7489]
0.8 0.8030 [0.8014, 0.8045]
0.85 0.8557 [0.8541, 0.8573]
7. STATIONARITY TEST
In this section, we try to make sure that our scheme generates stationary data so that the Hurst parameter estimator is not misled by the non-stationarity of the data [16, 17]. To test the stationarity of the generated synthetic traces, we
generated several traces for several b values in the
range from 1.1 to 2.7 for different T valuesin the
range from 1µ to 3µ. Then each single trace is
divided into several disjoint blocks and the Hurst parameter is estimated for each block as suggested in (Leland, Taqqu et al. 1994). Table 2 shows the sample mean of the Hurst parameter per block along with the 95% confidence interval. It is clear from the width of the confidence intervals that the Hurst parameter does not significantly vary from block to block, which suggests that the stationary assumption is valid.
1.2 1.4 1.6 1.8 2 2.2 2.4 2.6 2.8 3
0.5 0.55 0.6 0.65 0.7 0.75 0.8 0.85 0.9
Shape parameter, b
E
s
tim
at
ed
H
m = 5
T = µ
T = 2µ
T = 3µ
T = 4µ
1 1.2 1.4 1.6 1.8 2 2.2 2.4 2.6 2.8 3
0.55 0.6 0.65 0.7 0.75 0.8 0.85 0.9 0.95
Shape parameter, b
E
s
tim
a
te
d
H
[image:5.595.85.531.644.731.2]Synthetic data Linear fitting
Table 2. The Variation Of The H Parameter Over Time
T/b 1.1 1.5 1.9 2.3 2.7
1µ 0.8853 (±0.0062)
[0.8792, 0.8915]
0.8019 (±0.0051) [0.7968, 0.8070]
0.6964 (±0.0068) [0.6896, 0.7032]
0.6163 (±0.0116) [0.6047, 0.6280]
0.5427 (±0.0069) [0.5359, 0.5496]
2µ 0.9030 (±0.0052)
[0.8978, 0.9082]
0.8291 (±0.0052) [0.8239, 0.8343]
0.7506 (±0.013) [0.7506, 0.7376]
0.6739 (±0.0063) [0.6677, 0.6802]
0.6025 (±0.0016) [0.6009, 0.6040]
3µ 0.9028 (±0.0096)
[0.8932, 0.9124]
0.8315 (±0.0059) [0.8257, 0.8374]
0.7570 (±0.0085) [0.7485, 0.7655]
0.6772 (±0.0078) [0.6772, 0.6694]
ISSN: 1992-8645 www.jatit.org E-ISSN: 1817-3195
587
8. CONCLUSIONS
The goal of this paper is to utilize the heavy tail distributions to generate long-range dependence data traces. We develop a simple traffic generator and we analyze the effect of the Pareto distribution parameters on the generated traces. This model is based on multiplexing few sources of heavy tail distributed inter-arrival times and counting the number of arrivals at the successive
intervals of length T. We find that it is only the
tail of the distribution that matters when the need is to target a certain degree of LRD where the
LRD is stronger at heavier tails. The interval T is
another factor that affects the degree of LRD, but
we find that fixing the T value and playing with
the tail of the distribution produces a simple and linear model.
ACKNOWLEDGMENT
This article was funded by the Deanship of Scientific Research (DSR), King Abdulaziz University, Jeddah. The authors, therefore, acknowledge with thanks DSR technical and financial support.
REFERENCES
[1] Leland, W. E., M. S. Taqqu, W. Willinger and
D. V. Wilson (1994). "On the self-similar nature of Ethernet traffic (extended version)." Networking, IEEE/ACM Transactions on 2(1): 1-15.
[2] Paxson, V. and S. Floyd (1995). "Wide area
traffic: the failure of Poisson modeling." IEEE/ACM Transactions on Networking (ToN) 3(3): 226-244.
[3] Erramilli, A., O. Narayan and W. Willinger
(1996). "Experimental queueing analysis with
long-range dependent packet traffic."
IEEE/ACM Transactions on Networking (TON) 4(2): 209-223.
[4] Crovella, M. E. and A. Bestavros (1997).
"Self-similarity in World Wide Web traffic: evidence and possible causes." Networking, IEEE/ACM Transactions on 5(6): 835-846.
[5] Loiseau, P., P. Gonçalves, G. Dewaele, P.
Borgnat, P. Abry and P. V.-B. Primet (2010). "Investigating self-similarity and heavy-tailed distributions on a large-scale experimental
facility." IEEE/ACM Transactions on
Networking (TON) 18(4): 1261-1274.
[6] Feldmann, A., A. C. Gilbert, W. Willinger and
T. G. Kurtz (1998). "The changing nature of
network traffic: Scaling phenomena." ACM SIGCOMM Computer Communication Review 28(2): 5-29.
[7] Cao, J., W. S. Cleveland, D. Lin and D. X. Sun
(2001). On the nonstationarity of Internet traffic. ACM SIGMETRICS Performance Evaluation Review, ACM.
[8] Karagiannis, T., M. Molle and M. Faloutsos
(2004). "Long-range dependence ten years of Internet traffic modeling." Internet Computing, IEEE 8(5): 57-64.
[9] Garrett, M. W. and W. Willinger (1994).
Analysis, modeling and generation of self-similar VBR video traffic. ACM SIGCOMM Computer Communication Review, ACM.
[10]Parulekar, M. and A. M. Makowski (1997). M|
G|∞ input processes: a versatile class of models for network traffic. INFOCOM'97. Sixteenth Annual Joint Conference of the IEEE Computer and Communications Societies. Proceedings IEEE, IEEE.
[11]Lau, W.-C., A. Erramilli, J. L. Wang and W.
Willinger (1995). Self-similar traffic
generation: The random midpoint displacement algorithm and its properties. Communications,
1995. ICC'95 Seattle,'Gateway to
Globalization', 1995 IEEE International
Conference on, IEEE.
[12]Riedi, R. H., M. S. Crouse, V. J. Ribeiro and R.
G. Baraniuk (1999). "A multifractal wavelet model with application to network traffic." Information Theory, IEEE Transactions on 45(3): 992-1018.
[13]Willinger, W., M. S. Taqqu, R. Sherman and D.
V. Wilson (1997). "Self-similarity through high-variability: statistical analysis of Ethernet LAN traffic at the source level." Networking, IEEE/ACM Transactions on 5(1): 71-86.
[14]Park, K. and W. Willinger (2000). "Self-similar
network traffic: An overview." Self-similar network traffic and performance evaluation: 1-38.
[15]Abry, P. and D. Veitch (1998). "Wavelet
analysis of long-range-dependent traffic." Information Theory, IEEE Transactions on 44(1): 2-15.
[16]Karagiannis, T., M. Faloutsos and R. H. Riedi
(2002). Long-range dependence: now you see it, now you don't! Global Telecommunications Conference, 2002. GLOBECOM'02. IEEE, IEEE.
[17]Grönlund, Å. (2010). "Ten years of