© 2016, IRJET ISO 9001:2008 Certified Journal
Page 774
A COMPARATIVE STUDY OF AMBIENT NOISE LEVELS AT COMMERCIAL,
RESIDENTIAL AND SILENT ZONE IN GORAKHPUR
Pawan Kumar Singh
1, Rohit Kumar Gupta
2, Vijay Kumar Mishra
3Dr. A. K. Mishra
4 123P.G. Student, Department of Civil Engineering, MMMUT, Gorakhpur, India
4
Assistant Professor, Department of Civil Engineering, MMMUT, Gorakhpur, India
Abstract
-
Urban areas with rapid modernisations are affected by noise related health issues. This noise pollutions coming from the road traffic noise, rail traffic noise, air traffic noise, industrial noise, community noise and other miscellaneous sources affects humans in our day to day life. Sound Level meter (Make Bruel and Kjaer-2232) was used to make the noise sampling at various locations on the highway of concerned. The main objective is to compare the noise level on the NH-28 and NH-29 with the prescribed limits by Central Pollution Control Board (CPCB) and Bureau of Indian Standards (BIS) and to assert the reason of the noise source agent on the locations. Traffic Noise Index with Noise climate was also calculated to give us a clear idea about the status of Noise in the concerned stations. Residential areas, Commercial areas and Silent Zone were taken into account to carry out our research work. To find out noise levels which people encounter in highways in their daily life, we carried our sampling on the roadside and walked along the places on the National Highways. Golghar (NH-29) has higher values of noise levels at it is the main commercial place in the city of Gorakhpur. The noise level at Army School (NH-28) is higher than that of St.Andrew Inter College (NH-29) which are categorised under silent Zone.Key words- Site Description, Residential area, Commercial area, Silent Zone, National Highway-28(NH-28), National Highway-29 (NH-29)
1.
INTRODUCTION
Sound and Noise are both interrelated, Sound is a form of energy which is emitted by vibrating body and travels in a definite medium which received by the nerves creates a sensation of hearing. Noise is unwanted sound and is a waste energy. Noise pollution is a slow and subtle killer 3[1] and no doubt it adversely affects human health. The word ‘noise’ is derived from Latin word “nausea” implying ‘unwanted sound’ or ‘sound that is loud, unpleasant or unexpected’ (Pawar et al. 2010)[2].In recent studies by various world organisations noise has emerged as the third largest affected source for the people of urban areas. Noise in big cities is considered by the World Health Organization (WHO) to be the third most hazardous type
of pollution, right after air and water pollution (WHO, 2005)[3]. Generally , high exposure to noise level can causes feeling of annoyance and irritation, damage to auditory mechanisms, number of health related effects like physiological disorders, psychological disorders, disturbances of daily activities and performances,
hypertensions and schematic heart
diseases(Canter,1996)[4]. The total urban population of India has increased considerably over the past three decades, rising from 109 million in 1971 to 160 million in 1981 and then 217 million in 1991 and 285 million in 2001.2[5].Various studies carried out in India and around the world has shown concerns over the rising noise levels of the major cities. Various studies have been carried out in India Although significant numbers of research papers have been published on various cities of India[6], [7], [8], [9], [10], [11], [12], [13], [14] carried out noise level assessment of Kerala, Vishakhapatnam, Bareilly, Guwahati, Dehradun, Bhadrak city, Kolhapur cities, Gorakhpur city(NH28), Navi Mumbai and Gorakhpur city respectively and all of them found that the noise level of their respective cities was higher than the prescribed limit by Noise Pollution (Control and Regulation) Rules, 2000 and MoEF (Ministry of Environment and Forest, Govt. of India). Highways Noise is generally dependent largely on the vehicles running. Vehicular noise depends on the quality of the engine and exhaust system, traffic flow, interaction with road surface and tire and honking of horns. Other noise sources in highways may be of construction machines, public address systems.
2.
SITE DESCRIPTION
Gorakhpur is located at the eastern part of Uttar Pradesh. It has many significant and historical places and is well connected with rest of the country. Gorakhpur having latitude and longitude 26.7588°N and 83.3697°E respectively having total area 3483.8 sq. km with population 37,69,456.
3.
MATERIALS AND METHODOLOGY
© 2016, IRJET ISO 9001:2008 Certified Journal
Page 775
[image:2.612.323.541.526.693.2]Monitoring was carried out using the instrument at a height of 1.2 to 1.5 m and 1 m away from the chest. Ambient sound levels are being compared with the prescribed standards of CPCB (Central Pollution Control Board), India. The National Ambient Air Quality Standard in respect of Noise as specified under the Noise Pollution (Regulation and Control) Rules, 2000 is being referred for the present study [15].
Table 1: Permissible Noise Levels by CPCB
S. No. Area Noise level in Permissible dB(A) Day
Time Night Time
1 Industrial Area 75 70
2 Commercial Area 65 55
3 Residential Area 55 50
4 Silent Zone 50 45
NOTE:
Day time shall mean from 6.00 a.m. to 10.00 p.m. Night time shall mean from 10.00 p.m. to 6.00 a.m. Silence zone is an area comprising not less than 100
metres around hospitals, educational institutions, courts, religious places or any other area which is declared as such by the competent authority.
Mixed categories of areas may be declared as one of the four above mentioned categories by the competent authority.
dB (A) Leq denotes the time weighted average of the level of sound in decibels on scale A which is relatable to human hearing. A “decibel” is a unit in which noise is measured.
“A”, in dB(A) Leq, denotes the frequency weighting in the measurement of noise and corresponds to frequency response characteristics of the human ear.
Leq is defined as the energy mean of the noise level over a specified period. The formula is represented by:
Leq=10*Log10∑ni=110Li/10*ti
Where,
Li= the noise level of any ith sample n= Total number of sound samples
ti= Time duration of ith sample, expressed as fraction of total sample time
The Equivalent worked out is further specified by writing the hours of total monitoring time Leq(total hour). For example, Leq(8) means the Equivalent Noise Level based on 8-hour measurement. The equivalent noise level (weighted on A network) during 24 hour time period with surplus of 10dB(A) correction is applied to the measurements during night time of 22hr to 7hr , is usually termed by Ldn.
3.2
Noise Indices
Three noise indices were measured viz., Traffic Noise Index (TNI) [16], Noise Climate (NC)[17],Noise pollution Level(Lnp)[18] were calculated to determine the extent of noise pollution for all hours. Traffic Noise Index (TNI) is a parameter which indicates the degree of variation in a traffic flow expressed in dB.
TNI=(L90+4*NC-30)dB(A)
Noise Climate (NC) provides the range over which the sound levels fluctuate in an interval of time and expressed in dB (A)
NC= (L
10-L
90)dB(A)
Noise pollution Level (Lnp) is also used to express varying levels of noise expressed in dB (A).
Lnp = (L
50+ NC
2/60 + NC) dB(A)
L10 means noise levels exceeding 10% in the measured time.L50 means noise levels exceeding 50% in the measured time.L90 means noise levels exceeding 90% in the measured time.
© 2016, IRJET ISO 9001:2008 Certified Journal
Page 776
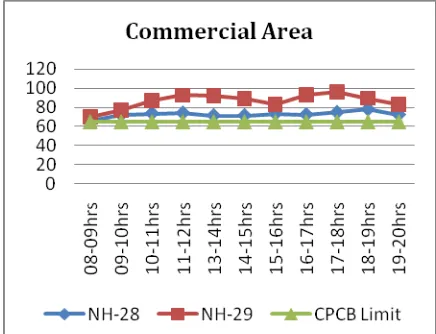
Chart -2: Noise level on Residential Area
Chart -3: Noise level on Silent Zone
4.
RESULTS AND DISCUSSION
[image:3.612.319.577.107.569.2]The study is conducted over six different locations in the month of February from 08hrs to 20hrs.The analysed data shows us that the stations on two highways NH-28 and NH-29 are all above the prescribed limits by CPCB. The flow of vehicles at NH-29 is more than that in NH-28. Out of the six locations Golghar is most affected by Noise pollution. The table of Traffic noise index (TNI), Noise Climate (NC) and Noise pollution levels are given below:
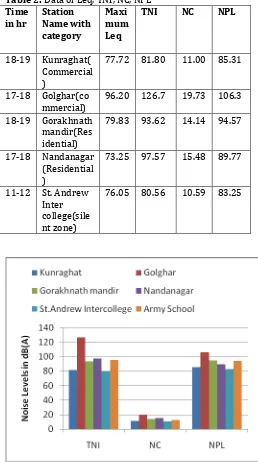
Table 2: Data of Leq, TNI, NC, NPL
Time
in hr Station Name with category
Maxi mum Leq
TNI NC NPL
18-19 Kunraghat( Commercial )
77.72 81.80 11.00 85.31
17-18 Golghar(co
mmercial) 96.20 126.7 19.73 106.3
18-19 Gorakhnath mandir(Res idential)
79.83 93.62 14.14 94.57
17-18 Nandanagar (Residential )
73.25 97.57 15.48 89.77
11-12 St. Andrew Inter college(sile nt zone)
76.05 80.56 10.59 83.25
Chart -4: Graph Comparison between TNI, NC and NPL
5.
CONCLUSION
© 2016, IRJET ISO 9001:2008 Certified Journal
Page 777
Kunraghat is the major road to connect to Deoria the State highway (SH-01) meets the National highway (NH-28). People density in that area is increasing at a fast rate, which directly impact the Noise.
At NH-29: Golghar is the major affected place. It has the highest value of Leq and TNI. The number of vehicles operating on the roads of Golghar is the highest within all the stations. Gorakhnath mandir Residential area has narrow roads and community noise creates a noisy environment St. Andrew Inter college shows the lowest noise levels and its least affected by noise but the values are higher than the prescribed limits. Plantations of greenery near the road will help in absorbing the noise and hence minimise the noise levels. Speed monitoring in places where the roads are narrow should be implemented. Honking of horns near the silent zone should be prohibited.
ACKNOWLEDGMENT
I express my sincere gratitude and regards to my supervisor Dr. A.K. Mishra, Assistant Professor, Department of Civil Engineering, Madan Mohan Malaviya University Technology, Gorakhpur for his valuable guidance and suggestions
.
REFERENCE
[1]. Singh N. and Davar S. C., (2004).Noise Pollution- Sources, Effects and Control. J. Hum. Ecol., 16(3): 181-187 (2004).
[2]. Chauhan, A., Pawar, M., Kumar, D., Kumar, N. and Kumar, R (2010), ‘Assessment of Noise Level Status in Different Areas of Moradabad City’. Report and Opinion; 2(5), pp 59-61.
[3]. World Health Organization, (2005). United Nations Road Safety Collaboration: A Handbook of Partner Profiles (Geneva: World Health Organization).
[4]. Canter, L. W (1996), Environmental Impact Assessment, McGraw-Hill Publishers, Second Edition, New York, USA.
[5]. R. K. Mishra, M. Parida, S. Rangnekar, ―Evaluation and analysis of traffic noise along bus rapid transit system corridor‖, Int. J. Environ. Sci. Tech., pp: 737-750, Autumn 2010.
[6]. S. Sampath, Das Murali S., Kumar Sasi V. (2004): Ambient noise levels in major cities in Kerala, J. Ind. Geophys. Union, Vol.8.No.4,pp 293-298.
[7]. T. Vidya Sagar And G. Nageshwar Rao (2006), ‘Noise Pollution Levels in Visakhapatnam City (India)’, Journal of Environmental Science and Engineering, 48(2), pp 139-142.
[8]. Gangwar, K K, Joshi, BD and Swami, A. (2006) : Noise pollution status at four selected intersections in commercial areas of Bareilly, Metropolitan City. Him.J.Env.and Zoo.,20(1)75-77.
[9]. Chauhan and Pande (2012), Study of noise level in different zones of Dehradun city, Uttarakhand, Report and opinion 2010, 2(7).
[10]. Alam, Wazir (2011), ‘GIS based Assessment of Noise Pollution in Guwahati City of Assam, India’, International Journal of Environmental Sciences, 2(2), pp 731-740. [11]. Hunashal B. Rajiv, Patil B. Yogesh (2012) Assessment of noise pollution indices in the city of Kohlapur, India, International Conference on Emerging Economics- Prospects and Challenges( ICEE-2012), Procedia – Social and Behavioral.
[12]. Pandey Govind and Dubey Soni, “Traffic Noise Prediction using FHWA Model on National Highway - 28 in India” J.Environ. Res. Develop. Vol. 7 No. 1, July-September 2012.
[13]. Pandey Govind and Renesha Singh,2013 A Study of Noise in Gorakhpur City, Uttar Pradesh (India). Int. journal Of structural and Civil engg. Research. 02, pp. 241-249. [14]. Arun kumar Mishra, Prabhat Srivastava “Assessment and Prediction of Noise Level on Various Links in the Surrounding Areas of an Upcoming Airport”, IJRET, ISSN: 2319-1163
[15]. Central Pollution Control Board, Ministry of
Environment and Forests (GOI). The Noise
Pollution(Regulation and Control) Rules, 2000. The Principal Rules were published in the Gazette of India, vide S.O. 123(E), dated 14.2.2000 and subsequently amended vide S.O. 1046(E), dated 22.11.2000, S.O. 1088(E), dated 11.10.2002, S.O. 1569 (E), dated 19.09.2006 and S.O. 50 (E) dated 11.01.2010 under the Environment (Protection) Act, 1986.
[16]. Ma,G., Tian, Y., Ju, T., Ren, Z., (2006). Assessment of Traffic noisepollution from 1989-2003 in Lanzhou city. Environmental Monitoring and Assessment, Vol-123, pp. 413-430.
© 2016, IRJET ISO 9001:2008 Certified Journal
Page 778
and its abatement through vegetation. Environmental Monitoring and Assessment, 146(1-3), 67-75.
[18]. Rao, P.R. and Rao, M.G.(1991), Urban Traffic Intensity and Prediction of (Leq) Noise level, Indian Journal of Environmental Health, 33(3), 324 - 339.
BIOGRAPHIES
Pawan Kumar Singh
M. tech (Environmental Engineering) MMMUT, Gorakhpur
Rohit Kumar Gupta
M. tech (Environmental Engineering) MMMUT, Gorakhpur
Vijay Kumar Mishra
M. tech (Environmental Engineering) MMMUT, Gorakhpur