© 2016, IRJET | Impact Factor value: 4.45 | ISO 9001:2008 Certified Journal
| Page 1708
CONVECTIVE HEAT TRANSFER ANALYSIS IN A CIRCULAR TUBE WITH
EXTERNAL THREADS OF DIFFERENT PITCHES USING CFD
Sharabanna
1, Kailash B A
2, Gowreesh
31
M.teh Student,Dept. of Thermal power Engineering,VTU Regional centre Kalaburagi,Karnataka,india
2
Assistant Professor, Dept. of Thermal power Engineering,VTU Regional centre Kalaburagi,Karnataka,india
3
Associate Professor, Department of Mechanical Engineering, JSSATE, Bengaluru, Karnataka, India.
---***---Abstract
- In this work CFD analysis on convective heat transfer carried out in a plain circular tube(OD=38mm, ID=28mm) and with external threads of distinct pitches (5mm, 10mm) on the tube and results were compared. Air is used as working fluid and Reynolds number between 7000 to15000 is assumed for the analysis. For convective heat transfer analysis of circular pipe three models were designed those are Model 1(plain pipe), Model 2(5mm pitch thread) and Model 3(10mm pitch thread). For highest Reynolds number (Re = 15000) it is observed that there is increase in the rate of heat transfer, pressure drop and kinetic turbulence energy for all the models. It is found that 10% improvement in the heat transfer rate for hot air using 10mm pitch threads in the pipe. Turbulence in the pipe found to be higher for the threaded pipe configuration as compared to plain pipe. Performance of tube is enhanced by using external threads.Key Words: Heat transfer, External threads, Enhancement, Turbulence, Reynolds number
1.
INTRODUCTION
Heat is the form of energy transferred from one body to another body by virtue of temperature difference. Heat transfer is the flux and temperature difference is the force. Thermal energy is based on the temperature difference, for any material maximum temperature higher the thermal energy occurs. Always heat is transferred from hotter body to colder body. There are threemodesofheattransfer :Conduction,Convection,Radiation
Pradip Ramdas Bodade et.al. [1] he conducted the experiment on heat transfer and friction factor enhancement characteristics in a horizontal circular duct having internal threads with pitch of 0.5 cm and 1 cm, range of Reynolds number is1 7,000 to30,000 with air as test fluid. plain tube and tube with internal threads pitch of 0.5 cm and 1 cm. After the experimental data obtained compared with plain horizontal circular tube ,The result of this experiment is rate of heat transfer with internal threads is increases compared to without internal threads and also increases Reynolds number . He concluded finally that lower the pitch of internal threads higher the heat transfer rate but maximum frictional losses will occur.
Dr. Rajeshkumar U. Sambhe. et.al [2] he noticed that the heat transfer and friction factorcharacteristics of circular tube by with the help of internal threads at a pitch of 100mm, 120mm and 160mm .for this experiment the range of Reynolds number 7,000 to 14,000 and air act as a the test fluid. Results or data obtained from experiment compared with pain circular tube. The same pumping power consumption, for turbulent flow tube with internal threads acts a highest performance factor. He lastly concluded increase in depth heat transfer and friction factor also increases.
Ajit patil. et.al [3] he was done the experiment by using different type of internal threads and at a constant pitch of 3mm V-threaded, Sq-threaded and U-threaded tubes to in a forced convection investigates the fin configuration effect on heat transfer agumentation and pressure drop .he conduct the experiments at a different input power ,mass flow rate .range of Reynolds number for this study 2000 11000 and air as a test or working fluid for the v-threaded of 0% to 10% heat transfer coefficient is increased .for the Sq-threaded 48% to 69%% . For the U -threaded of 150 % to 260% heat transfer coefficient is increased. U-threaded is the best performs compared to other sections.
Dr.I. Satyanarayana., et.al [4] In this thesis heat transfer rate improved by using internal helical fins . this performance subjected to under natural convection heat transfer. He has taken vertical duct without fins compared with the other rectangular cross section and tapered ,trapezoidal ,hyperbolic large number of fins with single turn taken and single fin with large number of turns taken. flow is taken as a laminar, air as the working fluid .heat transfer rate calculated and temperature contours for several fin configurations plotted Large number of fins with a single turn is more efficient compared to other fin patterns. He concluded finally trapezoidal fin heat transfer rate is more efficient large number of fin with single turn compared to other types of fins.
2.Methodology
2.1 Design of CAD Model
The following are the three types of models used in the analysis :© 2016, IRJET | Impact Factor value: 4.45 | ISO 9001:2008 Certified Journal
| Page 1709
Model 2 – Threaded Model with 5mm pitch, and
Model 3 – Threaded Model with 10mm pitch.
These models were created using CATIA V5 and are shown in fig.1, fig.2, and Fig.3 respectively.
[image:2.595.44.549.71.816.2]Fig 1 Plain pipe
Fig 2 Threaded Model with 5mm pitch
Fig 3 Threaded Model with 10mm pitch
2.2 Grid or Mesh Generation
Once the 3-D model was created then mesh is generated as shown in the following figures.Mesh Generation for Model 1 Mesh details:
Type: Tetra-Hedral mesh No. of elements: 90849 No. of Nodes: 24561
Fig 4 Meshed Model 1
Mesh Generation for Model 2 Mesh details:
Type: Tetra-Hedral mesh No. of elements: 100849 No. of Nodes: 28561
Fig 5 Meshed Model 2
Mesh Generation for Model 3 Mesh details:
Type: Tetra-Hedral mesh No. of elements: 101849 No. of Nodes: 29561
Fig 6 Meshed Model 3
2.3Boundary conditions
Inlet: Velocity (For Reynolds no. 7000,10000 and 15000) Inlet temperature: 333 K
Outlet: Pressure outlet
Wall boundary conditions: Convection co-efficient, h = 25 W/m2K with No slip condition.
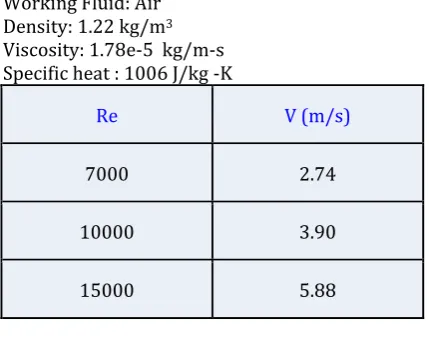
2.4 Fluid properties
Working Fluid: Air Density: 1.22 kg/m3
Viscosity: 1.78e-5 kg/m-s Specific heat : 1006 J/kg -K
Re V (m/s)
7000 2.74
10000 3.90
15000 5.88
3. RESULTS AND DISCUSSIONS
3.1 Inner wall temperature contours for
Model 1
Figures 7 to 9 shows the contours for the inner wall temperatures, it is found that higher the Reynolds number higher the inner wall temperatures for plain pipe. [image:2.595.307.522.292.461.2]
© 2016, IRJET | Impact Factor value: 4.45 | ISO 9001:2008 Certified Journal
| Page 1710
Fig 8 Inner wall temperature at R10000
Fig 9Inner wall temperature at Re = 15000
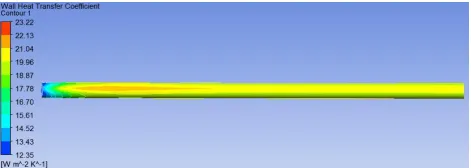
3.2 Heat Transfer Co-efficient contours for
Model 1
Figures 10 to 12 shows the contour plots of the wall heat transfer co-efficient, it is found that higher the Reynolds number greater wall heat transfer co-efficient. [image:3.595.44.280.304.388.2]Fig10 Heat transfer coefficient at Re = 7000
Fig 11 Heat transfer coefficient at Re = 10000
Fig 12 Heat transfer coefficient at Re = 15000
3.3 Pressure plots for Model 1
Figures 13 to 15 shows Pressure plots of Model 1 and results found to be maximum at higher Reynolds number.
Fig 13 Pressure drop at Re = 7000
[image:3.595.42.279.422.502.2]Fig 14 Pressure drop at Re = 10000
Fig 15 Pressure drop at Re = 15000
3.4 Turbulent kinetic energy plots for Model
1
Figures 16 to 18 shows Turbulence kinetic energy plots which will be maximum for increasing Reynolds number.Fig 16 Turbulent kinetic energy Re = 7000
[image:3.595.44.277.537.618.2]© 2016, IRJET | Impact Factor value: 4.45 | ISO 9001:2008 Certified Journal
| Page 1711
Fig 18 Turbulent kinetic energy Re = 15000
3.5 Inner wall temperature contours for Model
2(pitch = 5mm)
Figures 19 to 21 shows the contours for
the inner wall temperatures, it is found that higher the Reynolds number higher the inner wall temperatures for plain pipe.Fig 19 Inner wall temperature at Re = 7000
Fig 20 Inner wall temperature at Re = 10000
Fig 21 Inner wall temperature at Re = 15000
3.6 Heat Transfer Co-efficient contours for
Model 2
Figures 22 to 24 shows the contour plots of the
wall heat transfer co-efficient, it is found that higher the Reynolds number greater wall heat transfer co-efficient.Fig 22 Heat transfer coefficient at Re = 7000
Fig 23 Heat transfer coefficient at Re = 10000
Fig 24 Heat transfer coefficient at Re = 15000
3.7 Pressure plots for Model 2
Figures 25 to 27 shows Pressure plots of Model 1 and results found to be maximum at higher Reynolds number.Fig 25 Pressure drop at Re = 7000
Fig 26 Pressure drop at Re = 10000
Fig 27 Pressure drop at Re = 15000
© 2016, IRJET | Impact Factor value: 4.45 | ISO 9001:2008 Certified Journal
| Page 1712
Fig 28Turbulent kinetic energy Re = 7000
Fig 29 Turbulent kinetic energy Re = 10000
Fig 30Turbulent kinetic energy Re = 15000
3.9 Inner wall temperature contours for
Model 3(pitch = 10mm)
Figures 31 to 33shows the
contours for the inner wall temperatures, it is found that higher the Reynolds number higher the inner wall temperatures for plain pipe.Fig 31 Inner wall temperature at Re = 7000
Fig 32Inner wall temperature at Re = 10000
Fig 33 Inner wall temperature at Re = 15000
3.10 Heat Transfer Co-efficient contours for
Model 3
Figures 34 to 36 shows the contour plots of the wall heat transfer co-efficient, it is found that higher the Reynolds number greater wall heat transfer co-efficient.
Fig34 Heat transfer coefficient at Re = 7000
Fig 35Heat transfer coefficient at Re = 10000
Fig 36Heat transfer coefficient at Re = 15000
3.11 Pressure plots for Model 3
Figures 37 to 39 shows Pressure plots of Model 1 and results found to be maximum at higher Reynolds number.
Fig 37 Pressure drop at Re = 7000
© 2016, IRJET | Impact Factor value: 4.45 | ISO 9001:2008 Certified Journal
| Page 1713
Fig 39 Pressure drop at Re = 15000
3.12 Turbulent kinetic energy plots for Model
3
Figures 40 to 42 shows Turbulence kinetic energy plots which will be maximum for increasing Reynolds number.
[image:6.595.48.275.278.342.2]Fig 40 Turbulent kinetic energy Re = 7000
Fig 41 Turbulent kinetic energy Re = 10000
Fig 42 Turbulent kinetic energy Re = 15000
3.13 Velocity Streamlines for Model 1, 2 and
3
Figures 43 to 45 shows Streamlines for Mode 1, 2 and 3 respectively. It is observed that there is a increase in the velocity with respect to Reynolds number.
Fig 43 Velocity Streamline for Model 1
Fig 44 Velocity Streamline for Model 2
Fig 45 Velocity Streamline for Model 3
4.GRAPHS
Results obtained from the detailed analysis of all the three models the following graphs were drawn.
4.1Pressure v/s Reynolds number
Chart -1: Pressure v/s. Reynolds number
Chart -1shows variation in pressure drop for different Reynolds number. Referring to the graph the following
points were noted.
For plain pipe model pressure drop is less. For 5mm pitch threaded model pressure drop is
comparatively more.
[image:6.595.311.539.430.549.2]© 2016, IRJET | Impact Factor value: 4.45 | ISO 9001:2008 Certified Journal
| Page 1714
4.2 Temperature v/s Reynolds number
Chart-2: Temperature v/s. Reynolds number
Chart-2:shows variation in temperature for different Reynolds number. Referring to the graph the following points were noted.
Plain pipe, initially temperature increasing and then maximum after slowly increasing for the higher Reynolds number.
Pitch 5mm ,higher the Reynolds number higher temperature occurs.
Pitch 10mm,increasing Reynolds number at starting point temperature increases and then maximum after increasing.
4.3 Flow rate v/s Reynolds number
Chart-3: Flow rate v/s. Reynolds number
Chart-3 shows variation in flow rate for different Reynolds number. Referring to the graph it is observed that flow rate is more for plain pipe due to less friction.
5 CONCLUSIONS AND FUTURE SCOPE
5.1 Conclusion
CFD analysis is carried out to study the effect of varied threads for efficiency improvement of an heat transfer of the tube. Analysis is carried out for threaded pipes with 5mm and 10mm pitch and compared with the plain pipe for varied Reynolds numbers ranging from 7000, 10000 and 15000. Contours are plotted for Temperature, Turbulent Kinetic Energy, Pressure, Inner Wall Temperature and Wall Heat Transfer co-efficients and following conclusions were drawn.
Inner wall temperature increases with the increase in Reynolds no. and found to be higher for Threads with 10 mm pitch.
Wall heat transfer co-efficient for pitch with 10 mm found to be 90 W/m2K
Turbulence in the pipe found to be higher for the threaded pipe configuration. Pressure losses found to be higher due to
higher frictional losses
Higher the Reynolds no. higher the rate of heat transfer.
~10% improvement of heat transfer rate of hot air is found for 10mm pitch threaded pipe.
5.2 Future Scope
The present work would be carried for the following cases : By changing the diameter of the pipe. With different threads.
BIBLIOGRAPHY
[1] Pradip Ramdas Bodade, Dinesh Kumar Koli-Experimental Investigation On Convective Heat Transfer Analysis In A Circular Tube With Internal Threads Of Different Pitches.international Journal Of Engineering And Advanced Technology ISSN( 2249 – 8958) Volume-3 ( 2013)
[2] Pankaj N. Shrirao, Rajeshkumar U.Sambhe, Pradip R .Bodade.,Convective Heat Transfer Analysis In A Circular Tube With Different Types Of Internal Threads Of Constant Pitch.International Journal Of Engineering And Advanced Technology ISSN( 2249 – 89). Volume-2 ( 2013)
[3] Ajit Patil, D. B.Shelke., Convective Heat Transfer Analysis Through Circular Pipes Using Internal Threads Of Various Geometory. International Engineering Research Journal . ISSN 2395-1621 (2015)
[4] Dr.I. Satyanarayana , Ava Mallesh, P.Chandrashekar., Cfd Analysis Of A Tube With Different Internal Fin Profiles. International Journal Of Advancement In Engineering Technology Management And Applied Science Volume . Issn No (2349-3224)(2015)
[5] Sumit S. Kalmegh, Pramod R. Pachgharee.,ffect Of Heat Transfer In A Circular Tube by Using Different Surface Texture international Journal Of Science And Research (IJSR) ISSN ( 2319-7064) (2013)
[6] Pankaj N. Shrirao , Dr. Rajeshkumar U. Sambhe, Pradip R. Bodade., Experimental Investigation On Turbulent Flow Heat Transfer Enhancement In A Horizontal Circular Pipe Using Internal Threads Of Varying Depth.IOSR Journal Of Mechanical And Civil Engineering E-ISSN(2278-1684) Volume 5, ( 2013)