Evaluation of the new Design Summer
Year weather data using parametrical
buildings
Ji, Y, Korolija, I and Zhang, Y
Title Evaluation of the new Design Summer Year weather data using
parametrical buildings
Authors Ji, Y, Korolija, I and Zhang, Y
Type Conference or Workshop Item
URL This version is available at: http://usir.salford.ac.uk/47479/
Published Date 2017
USIR is a digital collection of the research output of the University of Salford. Where copyright permits, full text material held in the repository is made freely available online and can be read, downloaded and copied for noncommercial private study or research purposes. Please check the manuscript for any further copyright restrictions.
Evaluation of the new Design Summer Year weather data using
parametrical buildings
Yingchun Ji1, Ivan Korolija2 & Y Zhang3
1School of the Built Environment, University of Salford, Email: [email protected] 2UCL Energy Institute, University College London, London UK
3Energy Simulation Solutions Ltd, UK
Abstract: The Charted Institution of Building Services Engineers (CIBSE) updated the near extreme weather (Design Summer Year – DSY) for all 14 locations in the UK in 2016. This new release attempts to address the underlying shortcomings of the previous definition where the averaged dry bulb temperature was the sole metric to choose DSY among source weather years. The aim of this research is to evaluate whether the new definition of the probabilistic DSYs can consistently represent near extreme condition. London historical weather data and their correspondent DSYs were used in this research. Dynamic thermal modelling using EnergyPlus was carried out on large number single zone offices (parametric study) which represent a large portion of cellular offices in the UK. The predicted indoor warmth from the sample building models show that these new definitions are not always able to represent near extreme conditions. Using multiple years as DSY is able to capture different types of summer warmth but how to use one or all of these DSYs to make informed judgement on overheating is rather challenging. The recommended practice from this research is to use more warm years for the evaluation of overheating and choose the near extreme weather from the predicted indoor warmth.
Keywords: Design Summer Year, Overheating, EnergyPlus, Weather data, Parametric study
1. INTRODUCTION
In assessing potential overheating in free running buildings, near-extreme weather data were often used. The Charted Institution of Building Services Engineers (CIBSE) released standard weather data for three sites (London, Manchester & Edinburgh) since early 2000 (CIBSE Guide J 2002). Later release included 14 cities (16 sites) in total using the same selection criteria – the third warmest year (near extreme) among a 20 year source weather datasets, or the mid-year of the upper quartile if more than 20 years (Levermore & Parkinson 2006). The warmth of a weather year was judged by the average Dry Bulb Temperature from April to September. The appropriateness of this averaged Dry Bulb Temmperature method was
criticised on the fact that at some locations in the UK the predicted indoor warmth using DSY is cooler than its corresponding Test Reference Year (TRY) which represents a typical
weather (averaged condition) among the same source weather years (CIBSE TM48 2009; Nicol et al 2009; Smith & Hanby 2012). A detailed analysis on this averaged Dry Bulb Temperature method discovered a number of issues which could cause the chosen DSY less likely being representative as a near-extreme weather (Jentsch et al 2014). The latest release of CIBSE weather data in early 2016 (Virk & Eames 2016) was following the updated
temperature is the same as outdoor temperature for the ‘conceptual building’ could be unrealistic.
In light of the above, this research aims to evaluate whether the new release of near extreme weather data from CIBSE are fit for purpose. The purpose for developing (or selecting) weather data sets is to analyse building's performance, how various buildings designs respond to weather data is clearly a question in need of answering. For any particular building design in question, it is expected that a warm year should have higher likelihood of causing
overheating (in case of free running buildings) or have higher cooling demand (in case of air conditioned buildings). What have been lacking from previous researches are - the use of large number of building models to verify near extreme weather data against their baseline historical weather data; and the appropriate methods for investigating individual weather parameter’s contribution on indoor warmth prediction. In this paper a large number of single zone office models were used to examine how these models respond to the near extreme weather conditions.
2. METHODOLOGY
2.1 Historical weather data
London historical weather data from 1976 to 1995 were used in this work. Among these 20 years, the year 1976 and 1989 are the two out of three pDSYs proposed in the CIBSE latest release (CIBSE TM49 2014). The key weather parameters within these source weather years include: global solar irradiation, diffuse solar irradiation, cloud cover, dry-bulb temperature, wet-bulb temperature, atmospheric pressure and wind speed. For free running buildings, dry-bulb temperature (DBT), global solar irradiation (GSR) and wind speed (WS) are thought to have direct influence on indoor operative temperature. Hereinafter, they will be referred as DBT, GSR and WS.
For the purpose of generating standard near extreme weather data, various analyses have been used in ranking the warmth of the historical weather data. Some ranking methods were using on DBT only (CIBSE Guide J 2002; Smith & Hanby 2012; CIBSE TM49 2014), others considered parameters such as GSR and WS in addition to DBT (Jentsch et al 2015; Ji et al 2016). Table 1 shows various warmth rankings for the 20 years historical weather data used in this research where individual column indicates from coolest to warmest (top to bottom). In the table, HO stands ‘number of hours over’ a base temperature. ADH stands ‘accumulated degree hours’ over a base temperature, it is the sum of the ‘degree hours (d·h)’ over that base temperature. For example, using 21°C as a base temperature, a temperature at 21.2°C has 0.2d·h; a temperature at 28.3°C gives 7.3d·h. ADH is the sum of all these degree hours. It is a metric to indicate the severity of warmth. AvgDBT here stands the averaged dry bulb temperature metric used in CIBSE Guide J (2002), WCDH is the weighted cooling degree hour metric used in CIBSE TM49 (2014), and is the sol-air temperature proposed in Ji et al (2016) which takes in to account, DBT, GSR & WS. It is evident in Table 1 that the warmth ranking position for an individual year does vary. The year 1976 was consistently warmer than other years, however, when the base temperatures are less than 17°C, the HO
Table 1 Ranking orders of London 1976 to 1995 weather data with various metrics (TRY is added as a reference)
>15 ºC >17 ºC >19 ºC >21 ºC >23 ºC >25 ºC >27 ºC >28 ºC >29 ºC
AvgDBT WCDH t'sa
HO ADH HO ADH HO ADH HO ADH HO ADH HO ADH HO ADH HO ADH HO ADH
L77 L77 L77 L77 L77 L88 L77 L88 L88 L78 L78 L78 L78 L78 L93 L93 L93 L93 L77 L78 L77 L86 L88 L88 L88 L88 L77 L88 L78 L78 L88 L80 L80 L88 L77 L78 L78 L88 L88 L86 L88 L78 L78 L78 L86 L78 L85 L78 L85 L77 L77 L80 L88 L88 L93 L93 L77 L77 L81 L81 L78 L93 L80 L88 L85 L78 L85 L78 L85 L78 L80 L80 L77 L85 L85 L79 L88 L80 L80 L80 L80 L79 L77 L79 L85 L86 L85 L80 L80 L80 L80 L85 L85 L85 L77 L77 L85 L80 L88 L81 L78 L78 L88 L85 L86 L87 L80 L81 L86 L86 L79 L86 L79 L79 L79 L79 L79 L80 L81 L91 L88 L77 L77 L85 L91 L88 L79 L79 L79 L79 L79 L86 L79 L93 L93 L93 L93 L93 L77 L85 L85 L85 L92 L92 L80 L81 L85 L81 L81 L80 L93 L81 L93 L87 L86 L86 L81 L81 L81 L81 L91 L81 L91 L91 L87 L81 L80 L81 L80 L87 L87 L81 L87 L87 L93 L87 L87 L87 L87 L91 L91 L79 L82 L82 L87 L82 L87 L79 L87 L93 L93 L93 L87 L93 L81 L81 L81 L81 L91 L91 L87 L82 L82 L79 L87 L85 L91 L91 L87 TRY L91 TRY TRY TRY TRY TRY TRY L91 L82 L86 L86 L82 L92 L92 L92 L92 L82 L85 L93 L82 L93 TRY L91 L91 L91 L82 L82 L82 L82 L91 L82 L82 L92 L87 L87 L87 L79 L79 L79 TRY L92 L91 L84 L82 L84 L82 L91 L91 L91 L92 L92 L92 L92 L86 L86 L86 TRY TRY L86 L86 L84 L86 L94 L94 L84 L94 L92 L84 L92 L92 TRY TRY TRY TRY TRY TRY TRY L86 L86 TRY TRY L94 TRY L84 L83 L92 L82 L84 L94 L84 L94 L84 L84 L84 L84 L84 L84 L84 L84 L84 L84 L84 L82 L84 L83 L90 L94 L92 L94 L92 L94 L84 L94 L94 L94 L94 L94 L94 L94 L94 L94 L94 L94 L83 L94 L82 L82 L83 L83 L83 L83 L83 L90 L83 L90 L83 L90 L89 L90 L89 L89 L89 L89 L89 L92 L83 L92 L95 L90 L90 L90 L90 L90 L83 L90 L83 L90 L83 L83 L89 L83 L83 L83 L83 L83 L90 L89 L90 L92 L95 L95 L89 L95 L89 L95 L89 L89 L89 L89 L90 L83 L90 L90 L90 L90 L95 L89 L90 L95
L76 L89 L76 L95 L89 L95 L89 L95 L95 L95 L95 L95 L95 L95 L95 L95 L95 L90 L95 L95 L89 L89 L76 L89 L76 L76 L76 L76 L76 L76 L76 L76 L76 L76 L76 L76 L76 L76 L76 L76 L76 L76
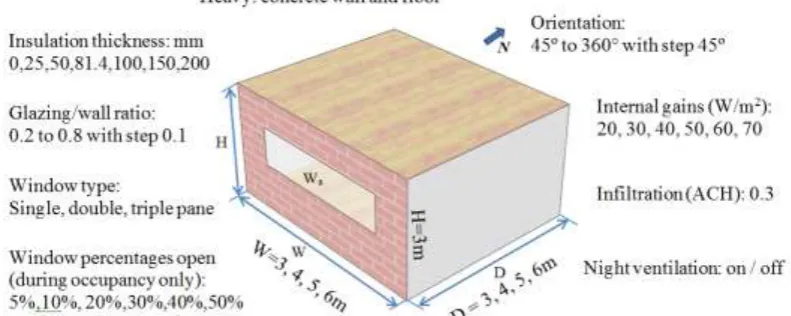
[image:4.595.98.494.475.633.2]2.2 Building parametric models
Figure 1 The single zone office model and their varying parameters
partition walls. Adiabatic condition is assumed for these internal surfaces. The cellular office is occupied from 9am to 5pm during which ventilation is provided by opening the window. A fixed night time ventilation schedule may be enabled, so that ventilation is employed when internal temperature is above 22°C between 1am and 8am. The model is created using EnergyPlus. In order to cover the wide variations of office spaces in the UK, parameters including orientation, wall construction, insulation level, window type, window sizes and openable area, internal heat gain, and night ventilation operation are applied to the model. The number of all variations resulted from the combinations of different parameter values are in the order of 106. Modelling the full population of building models is unrealistic therefore sampling is needed.
2.3 Building models sampling conditions
Four building models sampling scenarios are considered. Sample "i" examines the combined influence of temperature, solar radiation and wind using complete random building models.
Sample "ii" is also using the complete random building models but focuses on the sole influence of temperature, excluding the impact of solar radiation and wind completely. For solar, a spectrum filter applied as a shading device that stops all solar irradiance on the facade is employed. This setting prohibits visible light through the window for the whole simulation period. For wind, the weather data is filtered to remove wind speed, so that natural ventilation is only driven by buoyancy. Sample "iii" examines the maximum possible impact of solar radiation. The random building models are filtered by the ‘maximum window to wall ratio’ and the ‘south east window’ (315°) where it receives the most solar gains during occupancy period compared with other orientations. Influence of wind is also disabled using the same method as in Sample "ii". Sample "iv" assesses the maximum possible wind influence without the presence of solar radiation. By examining London's weather data, the prevailing wind direction is south west. Therefore the random building models have the following fixed conditions: south west facing (45°), maximum window to wall ratio (80%) and maximum openable area (50%), whereas solar is blocked using the shading device. Table 2 is a summary of the sampling conditions.
Table 2 Considered sampling scenarios
Sample index Descriptions
i Full parametric building models (complete random sample)
ii Full parametric building models but the influence of wind and solar is removed
iii Influence of wind is removed; random models are filtered by maximum glazing and south east facing
iv Influence of solar is removed; random models are filtered by maximum glazing, maximum opening area, and south west facing
2.4 Overheating criteria
There are various criteria which can be used to assess overheating in buildings. In this study, the single overheating criterion as defined in CIBSE Guide A (2006) and the adaptive overheating criteria from BS EN 15251 (2007) were used. CIBSE single temperature
(which corresponds 20 hours over a year) when operative temperature is over 28°C. Adaptive overheating criteria are based on extensive field studies that examine the relationship between indoor comfort conditions and the outdoor environment (Humphreys & Nicol 1998). The limiting comfort temperature defined as BS EN 15251 by:
where Eq. 01
Eq. 02
( and are the running mean and daily mean temperature previous day)
[image:6.595.164.434.357.519.2], as shown in Eq. 01, is no longer a fixed temperature, it varies with the daily running mean temperature (Figure 2). The overheating limiting temperatures in BS EN 15251 were divided into three categories (Category I, II & III) and the upper limit temperatures for these categories are 2°C, 3°C and 4°C, respectively, above the comfort temperature calculated using Eq. 01. Similarly as CIBSE single temperature criterion, the number of hours over these limiting temperatures can be used as a measure of overheating, i.e. number of hours over these upper limiting temperatures should be no more than 3% of total occupied hours (which corresponds around 61 hours) for that specific category the assessment falls within.
Figure 2 The limiting comfort temperature for the year of 1976 using Eq. 01 for April to September (the upper limits of Category I, II & III would be a parallel shift of Tcomf by 2, 3 &
4 degree Celsius).
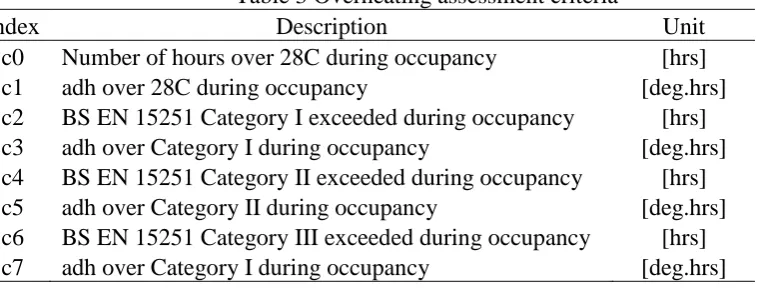
Table 3 Overheating assessment criteria
Index Description Unit
c0 Number of hours over 28C during occupancy [hrs]
c1 adh over 28C during occupancy [deg.hrs]
[image:6.595.84.463.588.732.2]As discussed in CIBSE TM52 (2013), overheating occurrence does not always reflect the actual overheating severity which is the accumulated degree hours over limiting temperatures (either a fixed temperature as CIBSE Guide A or varying ones as BS EN 15251). In this work the accumulated degree hours (adh) is calculated the same as CIBSE TM52. The predicted indoor warmth (including both overheating occurrence and severity) is ranked for each individual parametric model from the intended sampling conditions (i to iv in Table 2). A criteria index list is made to facilitate the indoor warmth assessment (Table 3 above).
2.5 Statistical ranking on predicted indoor warmth & sampling
The method for analysing the data is statistical ranking, i.e. to use statistics on the ranking orders of the results. The statistical ranking process is following the method used in Ji et al (2016):
1) A random sample of simulation cases is generated from the parametric model. 2) Simulations are carried out on the set of sample cases, with each of the 20 London
weather years (1976-1995) and the Test Reference Year, respectively.
3) Using the results of each simulated case, the 20 weather years are ranked by the predicted indoor warmth using the overheating criteria defined in Table 3.
4) The ranks of the weather years of each simulation case, according to each criterion, are collated, so that for each weather year, frequency histograms of the ranks are calculated.
In this work, the Latin Hypercube Sampling (LHS) method is used (Stein 1987). With LHS, a sample size of normally 10 times of the number of variables is sufficient for estimating mean values of the population (ref Figure 1, there are 10 varying parameters). As a result, 100 random building models for each weather year will be enough for producing reliable estimation of the average overheating profiles. For the analysis where statistical ranking of the weather years is of interest, the relationship between building characters and their overheating risks under different climatic conditions need to be examined, a larger sample is therefore required. After experimenting, a Quasi-Monte Carlo sample of 2,000 designs for each weather year, generated using the Sobol sequence, was used. Sampling and simulation of the parametric model is managed using the jEPlus tool (Zhang 2009). In total, 42,000 simulations have been performed for the years 1976-1995 plus TRY weather data.
3. RESULTS & DISCUSSIONS
Histograms were produced to illustrate the ranking probability of predicted indoor warmth for each weather year. With 20 years historical weather data, 32 of these graphs were made based on the 4 sets of samples and 8 overheating criteria (Tables 2 & 3). In this work, the analysis is primarily carried out against those warm weather years of interests: the top 6 warmer years (ref: Table 1, these years are: 76, 83, 89, 90, 94, 95), with the assumption that one of these weathers will be able to represent the ‘near-extreme’ weather, i.e. being the third warmest.
3.1 The ranking probability of the warmer years
excluding influences of both solar radiation and wind condition (Sample "ii" – only dry bulb temperature is the key driver for possible overheating), and to 74% for Sample "iv" where the random models have a maximum possible influence of wind speed and direction on top of
Sample "ii". There seems to be a tendency that the probability of being the warmest for 1976 increases when the sampling conditions can lead to less number of hours over the limiting temperature. On the contrary, significantly less probability (6%) of being the warmest for the year 1976 was resulted by Sample "iii" where the solar radiation is maximized as well as removing the influence of the counter factor of wind in terms of predicted indoor warmth. The year 1989 does not seem to sustain a ranking position with statistical significance apart from for Sampling "iii" where its probability of being the warmest is over 80%. For the c0 criterion, it is more likely for the year 1990, 1983 & 1994 to be in the 4th, 5th & 6th ranking position and same is true for the year of 1995 to be in the 2nd ranking position although this is less obvious and with the exception of Sample "iii". For all those concerned years Sample "iii" creates a more random order in terms of their ranking probabilities.
Sample "iii" random models emphasize the maximum influence of solar radiation and in the meanwhile excluding wind. This would result the highest level of overheating (by the number of hours over limiting temperatures) among the 4 sampling sets i to iv. The year of 1989 has the highest probability of being the warmest (slightly over 80%). This is ‘unusual’ as the year of 1989 has long been used as a near extreme year, never been deemed the warmest by any of the previous analysis (CIBSE Guide J 2002; Jetsch et al 2014; CIBSE TM49 2014; Ji et al 2016). In Table 1, when varying the base temperatures, the year 1989 has the highest number of hours over 15 ºC and 17ºC. The random models from Sample "iii" have the largest glazing ratio, facing south east (the highest solar gain orientation during occupancy), and no wind. These models may have caused overheating (i.e. indoor operative temperatures are higher than 28ºC or the upper limits of the adaptive comfort criteria) when outdoor temperature is below 17°C and this could be the reason why the year 1989 has the highest probability of being the warmest in terms of the predicted indoor warmth.
Similarly as observed in Figure 3 above, when examining the overheating severity (accumulated degree hours over 28ºC) in Figure 4, the 4 sampling sets i to iv + c1 show better consistency in terms of predicted indoor warmth ranking probability. The year 1976 is consistently the warmest. Even with Sample "iii", its ranking probability of being the
Figure 3 [samples i to iv + c0] Ranking probabilities by the ‘number of hours over’ 28°C (ref: Table 2 & 3) for the single zone office space during occupancy.
Figure 4 [samples i to iv + c1] Ranking probabilities by both ‘the accumulated degree hours (adh) over’ 28°C (ref: Table 2&3) for the single zone office space during occupancy.
[image:9.595.75.497.68.327.2] [image:9.595.74.498.367.633.2]between any of the discussed outdoor ranking methods (this work and existing literature such as CIBSE Guide J 2002; Nicol et al 2009; Jetsch et al 2014; CIBSE TM49 2014) and the predicted indoor warmth probability ranking was observed. It is clear that thermal responses of various building designs can be very different against the tested 20 years historical weather data in terms of predicted indoor warmth. Judging by the probability ranking of the predicted indoor warmth it is unlikely possible to choose a complete year which can always represent the ‘near extreme’ or being the third warmest.
3.2 TRY ranking probability
By definition TRY represents an averaged weather condition of the historical weather data from which it is generated. The 11th ranking position in Figure 5 with a higher probability is where ideally it should be. It is clearly not the case. For random model Sample "i", TRY is more likely being 7th warmest based on its highest probability ranking with the 20 source weather years, although for cases ‘i + c0’ (53%) and ‘i + c2’ (35%) the highest probabilities are not statistically significant. With the adh over ‘i + c1’ & ‘i + c3’, its probabilities of being the 7th warmest are both higher (around 60%). Sample "iv" shows more consistent high
ranking probability of being the 7th warmest position for all criteria (c0 to c3, table 3). TRY’s probability ranking positions vary for random models in sampling sets ii & iii, changing from the 5th warmest position (iii + c2, c3), the 6th warmest position (iii + c0) to the 7th warmest
[image:10.595.77.495.442.722.2]position for remaining cases with the case ‘ii+c1’ show 90% probability in Figure 5. The above observations on the probability ranking of the predicted indoor warmth for TRY do not correlate well with Table 1 – the highest ranking position for TRY is the 8th warmest in terms of outdoor warmth. With lower base temperatures, the TRY tends to move the middle. The above observation shows that the probability ranking of the predicted indoor warmth for TRY does indicate that TRY is warmer than expected.
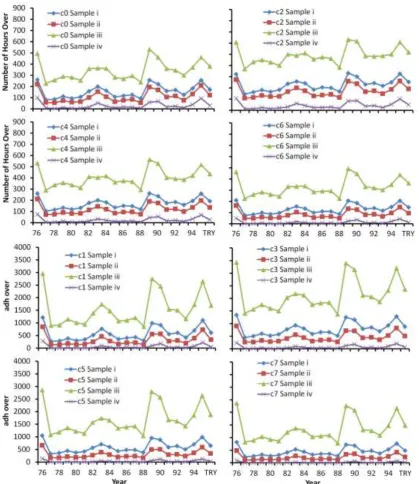
3.3 The averaged overheating occurrence and severity
Figure 6 Averaged ‘number of hours over’ and ‘adh over’ for all 4 sampling sets of random building models (Table 2) against the 8 criteria (Table3)
The averaged ‘number of hours over’ 28°C and the upper limiting temperatures from the adaptive Categories I, II & III for each sampling set (Table 2) are shown in Figure 6. In Figure 6, the averaged ‘number of hours over’ for Sample "i" is consistently higher than
overheating hours for Sample "iii" is higher than the level of decrease in overheating hours for Sample "iv" when using Sample "ii" as a baseline (see table 2). This also confirms the stronger influence on overheating hours from solar than from wind. When examining the averaged ‘accumulated degree hours (adh) over’ in Figure 6, the observation on the relative influences of solar and wind in overheating prediction is the same. For absolute quantities of the averaged adh over 28ºC and adaptive Category I to III limiting temperatures, the year 1989 becomes the second warmest for Sample "iii" which is consistent with Figures 3 & 4. Similarly for the averaged ‘number of hours over’ of Sample "iii" in Figure 6, the year 1989 becomes the warmest (as in Figures 3).
4. CONCLUSIONS
This paper sets out to assess the existing definition of standard near extreme weather data. The parametric model was made by a single zone office setting through which both physical changes (size, orientation, glazing, insulation, etc) and operational changes (window opening percentage, internal gains, with or without shading, etc) were randomly modified. The LHS sampling technique was used to generate 4 sampling sets and the building models from these sampling sets were used to examine the impact of building models on overheating
assessments. The 20 years historical weather data of London as well as their corresponding TRY were simulated on the sample models of each sampling set. Both single temperature overheating criteria from CIBSE Guide A and adaptive criteria from BS EN 15251 were used to assess overheating in these sample building models. By using a statistical voting
procedure, the ranking probability of each weather year on their predicted indoor warmth is presented against both overheating occurrence and severity.
The ranking probabilities of predicted indoor warmth for source weather years show no strict correlation with any existing ranking metrics discussed in this paper. The general observation of warmth from the examined weather years shows that the year 1976 is not always the warmest when using the ‘number of hours over’ criteria. There is a clear ranking position swap between 1976 and 1989 when the sampling models emphasize the maximized solar radiation scenarios, i.e. the year 1989 has highest probability of being the warmest for
Sample "iii". This observation conflicts with most of the existing outdoor warmth definitions apart from the ‘number of hours’ over lower based temperatures of existing weather data (Table 1). For the ‘accumulated degree hours (adh) over’ criteria, the year 1976 has been largely consistent of being the warmest with higher ranking probability of predicted indoor warmth. For Sample "iii" the year 1989 can become the warmest with the adh over but its probability is much lower than the overheating occurrence cases. Other examined weather years such as 1983, 1990, 1994 & 1995 could not hold any particular ranking position either, but relatively, they are more chances for them to appear in the 5th, 3rd, 6th &
2nd position although they do swap positions with different sampling sets and different criteria used to judge overheating.
20 source weather years. Even with this 7th position, the statistical significance is not always maintained as for some cases the probability of being the 7th warmest is less than 40%.
It is evident from this research that buildings themselves have significant influences on indoor overheating and the near extreme definitions using historical weather data do not always correlate with the predicted indoor warmth. As shown in this work, it is true that warmer years defined from historical weather data using various methods (i.e. averaged DBT, WCDH, SWCDH, TWCDH, FS statistics on DBT & Solar radiation, etc) are also warmer years based on their predicted indoor warmth ranking probability (1976, 1983, 1989, 1990, 1994 & 1995). However, the exact ranking sequence is not often maintained, i.e which year is the warmest and which year is the near extreme for individual buildings. This supports the notion of the CIBSE latest release of using pDSYs where multiple weather years are used to cover various types of warmth of historical weather. It is therefore sensible to suggest that more warmer years should be included to make sure one of which can always represent ‘near extreme’ weather for any individual building design.
REFERENCES
BS EN 15251 (2007). Indoor environmental input parameters for design and assessment of energy performance of buildings addressing indoor air quality, thermal environment, lighting and acoustics. BSI, EN 15251 (E). CIBSE Guide A (2006). Environmental Design, London: The Chartered Institution of Building Services
Engineers, ISBN-13: 978-1-903287-66-8.
CIBSE Guide J (2002). Weather, solar and illuminance data, London: The Chartered Institution of Building Services Engineers London, ISBN 1 903287 12 X.
CIBSE TM48 (2009). Use of climate change scenarios for building simulation: the CIBSE future weather years, London: The Chartered Institution of Building Services, ISBN 978-1-906846-01-5.
CIBSE TM49 (2014). Design Summer Years for London, The Chartered Institution of Building Services Engineers London. ISBN 978-1-906846-27-5.
CIBSE TM52. The Limits of thermal comfort avoiding overheating in European buildings. ISBN 978-1-906846-34-3, © July 2013 The Chartered Institution of Building Services Engineers London.
Humphreys M.A. & Nicol J.F. (1998) ‘Understanding the adaptive approach to thermal comfort’, ASHRAE Trans, 104(1): 991 - 1004.
Jentsch M F, Eames M E & Levermore G J (2015). Generating near-extreme Summer Reference Years for building Performance simulation. Building Serv. Eng. Res. Technol., 36(6): 701-727.
Jentsch M F, Levermore G J, Parkinson J B & Eames M E (2014). Limitations of the CIBSE design summer year approach for delivering representative near-extreme summer weather conditions. Building Serv. Eng. Res. Technol., 35(2): 155-169.
Ji Y, Zhang Y, Korolija I & Futcher J (2016). Design summer year weather – outdoor warmth ranking metrics and their numerical verification. Building Serv. Eng. Res. Technol., 37(6): 639-643, DOI:
10.1177/0143624416648179
Levermore G & Parkinson J (2006). Analyses and algorithms for new Test Reference Years and Design Summer ears for the UK. Building Services Engineering Research and Technology, 27(4): 311-325. Nicol J, Hacker J, Spires B & Davies H (2009). Suggestion for new approach to overheating diagnostics.
Building Research & Information, 37(4): 348-357.
Smith S T & Hanby V (2012). Methodologies for the generation of design summer years for building energy simulation using UKCP09 probabilistic climate projections. Building Serv. Eng. Res. Technol., 33(1): 9-17. Virk D & Eames M (2016). CIBSE Weather Files 2016 release: Technical Briefing and Testing.
Steadman, P., Bruhns, H. R., Holtier, S., Gakovic, B., Rickaby, P. A. & Brown, F. E. (2000). A classification of built forms. Environment and Planning B: Planning and Design, 27 (1): 73-91.
Stein, M. (1987) 'Large Sample Properties of Simulations Using Latin Hypercube Sampling'. Technometrics, 29(2): 43-151
![Figure 3 [samples i to iv + c0] Ranking probabilities by the ‘number of hours over’ 28°C ( ref: Table 2 & 3) for the single zone office space during occupancy](https://thumb-us.123doks.com/thumbv2/123dok_us/8687363.876273/9.595.74.498.367.633/figure-samples-ranking-probabilities-number-table-single-occupancy.webp)