International Journal of Emerging Technology and Advanced Engineering
Website: www.ijetae.com (ISSN 2250-2459, ISO 9001:2008 Certified Journal, Volume 7, Issue 4, April 2017)
66
Introduction to Machine Prediction of Personality from
Facebook Profiles
Nikita Gupta
1, Raj K. Waykos
2, Rashmi Narayanan
3, Anagha Chaudhari
4 1,2,3,4Student, Department of IT, PCCOE, Pune, IndiaAbstract—Social networks have become widely-used for information dissemination as well as facilitators of social interactions. People express themselves to other people in the community by sharing their experiences, ideas, activities, and memories. As a means, people mostly prefer to use social media such as Facebook, Twitter, Instagram. Early studies exist on the sharing of specific types of information (photos, posts, etc.), one area that has been less explored is how Facebook profiles can identify personality information and in a machine-readable fashion. In this study, we apply data mining and classifications in machine learning techniques which refers to the process of categorizing given input data pieces into certain given groups to predict users’ personality traits using the Big Five personality model. Text-based attributes are extracted from Facebook profiles. Then using these predictions we rank individuals in terms of the five traits. A similarity among individual’s personality traits and linguistic information is explored for analytics.
Keywords—Big-Five Personality, Regression, Source code metrics, Decision table, Pearson’s correlation
I. INTRODUCTION
Internet usage has been significantly increased during last two decades. As a new medium for information dissemination, social network has become a novel means of social interactions [3]. Users can be put into different classes based on their interactions. Web technologies including Blogs, Wiki Pages, Portals and Social Networking Sites [1] ,[8], provide a platform for users to interact. These technologies enable users to contribute and share content without requiring them to have any technical knowledge in web programming [1],[8].
Psychologists believed that user‟s personality traits were the driving force of user‟s behaviors and individual differences in personality traits may have an impact on user‟s online activities [3].The fact that people can judge each other‟s personality based on Facebook profiles implies two things: an individual‟s personality is manifested on their Facebook profile, and some aspects of Facebook profiles are used by people to judge others‟ personalities [8]. It is of great importance to allocate features‟ weights reasonably so as to be able to perform good prediction based only on scant knowledge of personality traits [3].
A number of different prediction models have been employed in this study, including regression, source code metrics and decision tables. These three models were chosen for use in this study because preliminary analysis showed they had the greatest performance [11].
The remainder of this paper is organized as follows: An overview of the literature review is presented in Section II. It includes the Big Five Model of personality prediction. The architecture of the system is summarized in Section III. It gives the flow of processes and also evaluates performance of the classifiers. A study of different methods and their comparisons are made in the further sections. Conclusions are drawn from the study followed by the references.
II. LITERATURE SURVEY
In recent years, the Big Five metric has become increasingly popular and some studies have examined how it can be used to better understand behavior on Facebook. In this, we present a brief explanation about Big 5 Personality Traits, their facet and Social Network Analysis (SNA) [1],[8].
Big 5 Personality Traits
In Psychology, there are five major characteristics known as “Big Five” that define human personality. These Big 5 Personality Traits (also known as OCEAN traits) can be evaluated by factor analysis of personality description questionnaires that have become a standard over the years. These personality traits are explained in detail below:
1. Agreeableness (social adaptability, likability, compliance, and love): These people are friendly, calm, peace keeper, optimistic, trust others and are nurturing people [1],[8].
International Journal of Emerging Technology and Advanced Engineering
Website: www.ijetae.com (ISSN 2250-2459, ISO 9001:2008 Certified Journal, Volume 7, Issue 4, April 2017)
67
3. Extraversion (active, energetic, assertive, forceful,outgoing, sociable, and talkative): They are outgoing people. They can make friends easily. They are also peaceful people. They believe themselves to overcome difficulties [1],[8].
4. Neuroticism (anxiety, dominant assured, and satisfaction): These people usually feel insecure. They do not trust others in their social life. They are so sensitive; therefore they can be easily depressed with negative emotions [1],[8].
5. Openness (culture, intelligence, intellect, intellectual interests):They are curious therefore they tend to find out new ways to do something new. They appreciate diverse views, ideas, and experiences [1],[8].
Social Network Analysis
Individuals who interact with each other create a social network. Within this network nodes represent individuals, while edges represent type of relationship between these nodes. Analyzing such networks is called social network analysis [1],[8]. The social network analysis is performed to figure out the role of each node in a network. Therefore, social networks analysis is essential to advertise of a product, prevent a crime, organize people for some mission and so on [1],[8].
Available Information on Facebook
Users disclose information about them with other users on Facebook. The information that is available on Facebook is used in inference of personality traits in the literature [1],[8].
Profile Information: It consists of all information about users‟ age, birth place, gender and other personal details etc. that users prefer to share on their timeline.
Activities on Facebook:This category contains information about users‟ activities on Facebook. Their likes, sharing, attending events, joining groups are considered in this group[1],[8].
[image:2.612.329.580.130.410.2]III. SYSTEM ARCHITECTURE
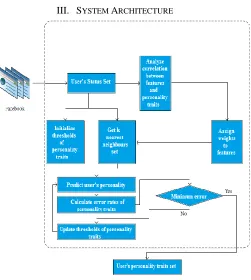
Fig 1: System Architecture
Figure 1 [3] depicts the architecture for predicting model for user‟s personality traits. Every feature has a different impact on user‟s personality traits prediction. Allocating features‟ weights reasonably so as to be able to perform good prediction based only on scant knowledge of personality traits is essential [3]. Contributions and activities of an individual provide a valuable insight to forecast his behaviour, experiences, opinions and interests. User‟s status set is used as an input to perform analysis of correlations between user‟s personality traits and features [3]. Calculation of weights is performed from this data.
Then, according to weights of features, 𝑘 nearest
International Journal of Emerging Technology and Advanced Engineering
Website: www.ijetae.com (ISSN 2250-2459, ISO 9001:2008 Certified Journal, Volume 7, Issue 4, April 2017)
68
Finally, given 𝑘 nearest neighbour‟s set, dynamic updated thresholds of personality traits, and correlations between personality traits, user‟s personality traits set is predicted [3]. The predicted values may differ from actual values. Hence, after predicting personality, it is essential to calculate error rates. If error is minimum, only then prediction is acceptable.IV. METHODS
In many application domains, large datasets are generated to be easily processed by humans. Although patterns exist, they require connecting of vast quantities of data together in ways which would take years to be discovered manually [11]. Using data mining and machine prediction techniques this data can be handled easily. A number of different numeric prediction models have been explained in this paper, including regression, source code metrics and decision tables.
Regression is a simple and widely-used form of numeric prediction [11]. In this approach, each instance has its independent attribute values multiplied by a chosen constant to produce a predicted value for the class attributes [11]. In this paper, we adopt two regression modeling
approaches, incremental regression and multitask
regression [6].
A) Incremental Regression Model:-Incremental regression is a linear regression which can be used to fit complex non-linear problems[6].
Algorithm:-
1.The training samples are first sorted.
2.According to the normalized magnitude of each
sample vector sorting of the samples is performed, from small to large.
3.Then it starts with one end of the sorted sample set and builds a simplest local regression model with fewest(n) samples for modeling . For example, if the target is a regression problem in two dimensional space, n will be set as 2 [6].
4.The error of the model is then tested with the next sample in the sample queue.
5.If the error is less than the threshold, the algorithm will refit the model with this new sample. Otherwise, the local model together with its domain will be saved into the line array [6].
B) Multi-Task Regression Model:-Multi-task learning is employed to use multiple task modelling strategies to improve performance beyond the single-task learning in the same scene. Consider n instances and T tasks.
Every instance is represented as a column vector x ∈Rm
(m features) and paired with a multi-dimensional output vector y ∈RT (T tasks)[6]. Therefore,
X={ ⃗ ⃗ ⃗ } (1)
Y={ ⃗ ⃗ ⃗ } (2)
The objective is to find an T ×m coefficient matrix W
such that
W = agr min{ ̂-WX} w
We start with an MTL formulation that jointly considers
T regressors, in a way similar to the primal form of the loss function as
min(L(X,Y,W;1:T)+λΩ(W)) (3)
w
Where L(X; Y;W;1:T) denotes the empirical loss function, Ω(W) is the regularization term, and λ is a trade-off constant. In this study, L(X; Y;W;1:T)is set as the least square loss and the regularize is set as Frobenius norm[6]. That is,
2
1 1
( , ,
;1: )
(
n)
T N
t th hn
t n h
L x y W
T
y
w x
(4)Ω(W) = tr(WT W) (5)
Substitute into equation (3), it has a unique optimizer,
W*= (XTX +λI)--1(XTY) (6)
The trade-off constant λ can be chosen in many ways. Here we choose the bias-variance decomposition which minimizes the expected loss (bias)2+variance [6].
Source code metrics is another prediction model. This eextracted metrics are used as input to the machine learning methods. These give enough information to get a close prediction of several personality traits [7]. Pieces of text, in form of source code, contain valuable information about the individual. During recent decades source code has become a source of valuable information as well [7].
Source code metrics must have a scale which can be:
Interval: given by a defined range of values.
Ratio: a value which has an absolute minimum or zero point.
International Journal of Emerging Technology and Advanced Engineering
Website: www.ijetae.com (ISSN 2250-2459, ISO 9001:2008 Certified Journal, Volume 7, Issue 4, April 2017)
69
[image:4.612.51.288.182.375.2]Ordinal: a categorization which is intended to order or rank, for instance levels of severity: critical, high, medium [7].
Fig. 2: Source Code Metrics
Figure 2 [7] represents the flow of processes in source code metrics. The first step involves separation of source examples into individual files. Using a source code analyzer, a set of metrics is extracted from the source codes.With the extracted metrics as an input, machine learning method are applied in order to predict the personality traits of individuals [7]. The results are then summarized.
Another popular form of numeric prediction is the decision table. Decision tables are classification models used for prediction. A decision table consists of a hierarchical table in which each entry in a higher level table gets broken down by the values of a pair of additional attributes to form another table [10]. The table at the top-most level contains a single row which represents all the data. The structure is similar to dimensional stacking [12]. It is the process of partitioning of the n-dimensional attribute space in 2-D subspaces, which are stacked into each other. Important attributes are used on the outer levels of the table and less priority ones are stacked inside.
A decision table is composed of two components:
(i) A list of attributes which is known as a schema. (ii) A multi-set of labeled instances known as the body [2].
When applying a decision table to personality classification, the Big5 traits are taken as the attributes. The posts, profile information or anything entered by the user is considered as labels.
The intersection of both of these forms a cell. A decision table is formed using these attributes/labels. A value is calculated for each cell using Pearson‟s Correlation coefficient. For instance, a neurotic person may have a tendency to experience unpleasant emotions easily, such as anger, anxiety, depression and vulnerability [3]. Let us assume that he makes a status update as “What an awful day! Life sucks.”
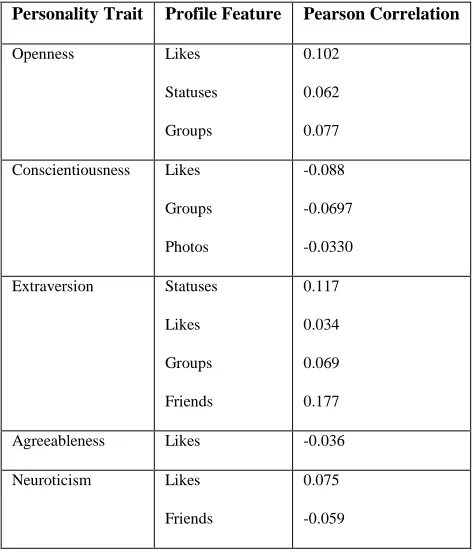
[image:4.612.326.563.325.601.2]By identifying use of specific keywords, this statement is assigned a higher neurotic value which is calculated using Pearson‟s coefficient as shown in Table I [4]. The other attributes will have relatively smaller values. These values are entered into decision table which gives a tabular representation of all the data.
Table I:
Relationship between Pearson’s correlation and Personality Traits
Personality Trait Profile Feature Pearson Correlation
Openness Likes
Statuses
Groups
0.102
0.062
0.077
Conscientiousness Likes
Groups
Photos
-0.088
-0.0697
-0.0330
Extraversion Statuses
Likes
Groups
Friends
0.117
0.034
0.069
0.177
Agreeableness Likes -0.036
Neuroticism Likes
Friends
0.075
-0.059
International Journal of Emerging Technology and Advanced Engineering
Website: www.ijetae.com (ISSN 2250-2459, ISO 9001:2008 Certified Journal, Volume 7, Issue 4, April 2017)
[image:5.612.52.285.162.404.2]70
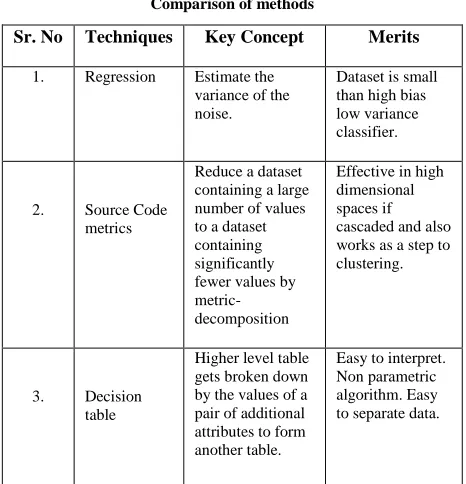
V. COMPARISON ANALYSISTable II: Comparison of methods
Sr. No Techniques Key Concept Merits
1. Regression Estimate the variance of the noise.
Dataset is small than high bias low variance classifier.
2. Source Code metrics
Reduce a dataset containing a large number of values to a dataset containing significantly fewer values by metric-decomposition
Effective in high dimensional spaces if cascaded and also works as a step to clustering.
3. Decision table
Higher level table gets broken down by the values of a pair of additional attributes to form another table.
Easy to interpret. Non parametric algorithm. Easy to separate data.
After this comparative analysis as shown in Table II, we conclude some of results decision table can give us best output for our analysis. Decision table is easy to interpret as it is broken into parts each part can be individually analyzed. Regression cannot handle large data set. In source code metrics, we can reduce a dataset having a large number of values by metric-decomposition but these may overlap while memory allocation.
VI. CONCLUSION AND FUTURE RESEARCH
In this paper, we have studied the five traits of the Big Five personality model (OCEAN). Manual assessment for targeting a specific group of users for advertising, social engineering attacks, or finding influential users will be a tedious job. For predicting personality, data mining and machine learning techniques applied on regression, source code metrics and decision table can prove to be more useful. This enables to predict users‟ traits using the Big Five personality model. We proposed an incremental regression model to prove the reliability of the dataset and the multi-task regression model to improve the predicting accuracy.
The source code metrics which is extracted is used as input to the machine learning methods to get a close prediction of several personality traits. Decision table classifiers presented here takes full advantage of interactive techniques to maximize user control of the model exploration process.
Future research will explore additional techniques to interpret users‟ personalities through automated data mining analysis of Facebook profiles (for example, by applying feature selection to reduce the number of independent attributes), as well as examine additional datasets from other social networks. In future, we will continue to collect users‟ data in Facebook, and invite more participants to get a larger dataset.
REFERENCES
[1] Ümit Ates “Inference of Personality Using Social Media Profiles” a thesis submitted to graduate school of Informatics Institute of Middle East Technical University on June 2014
[2] Suril Shah, Sagar Vikmani, Sahil Modak, “Evaluating Effectiveness of Classification Algorithms on Personality Prediction Dataset”, IJERT (Vol.4) on October-2015
[3] Mengmeng Wang, Wanli Zuo, “A Novel Adaptive Conditional Probability-Based Predicting Model for User‟s Personality traits” College of Computer Science and Technology, Jilin University, June 2015.
[4] Michal Kosinski, Yoram Bachrach“Personality and Patterns of Facebook Usage” University of Cambridge, 2012.
[5] Argyriou A., Evgeniou T., Pontil M. (2008). Convex multitask feature learning.Machine Learning, 73(3):243-272.
[6] ShuotianBai, BiboHao, Ang Li, Sha Yuan, RuiGao, "Predicting Big Five Personality Traits of Microblog Users" Chinese Academy of Sciences, Beijing, China on 2014
[7] Hugo A. Castellanos, “Personality Recognition Applying Machine LearningTechniques on Source Code Metrics”, Universidad Nacional de ColombiaBogotá, Colombia on 2016
[8] http://mypersonality.org/wiki/lib/exe/fetch.php?media=ates.pdf [9] Shally Bhardwaj “Personality Ambient Environments Using
Multiple Online Social Networks” a thesis submitted to the Faculty of Graduate and Postdoctoral Studies, 2014.
[10] Barry G. Becker, "Visualizing Decision Table Classifiers", Silicon Graphics Inc., 2011
[11] Randall Wald and Taghi Khoshgoftaar, "Machine Prediction of Personality from Facebook Profiles" IEEE Transactions on, August 8-10, 2011,©2011.\