International Journal of Emerging Technology and Advanced Engineering
Website: www.ijetae.com (ISSN 2250-2459, ISO 9001:2008 Certified Journal, Volume 4, Issue 1, January 2014)
Economic Load Dispatch Using Linearly Decreasing Inertia
Weight Particle Swarm Optimization
Anjali Tikalkar
1, Manju Khare
21
M.Tech. Student, 2Associate Professor, Department of Electrical & Electronics, LNCT Bhopal, India.
Abstract—Economic load dispatch (ELD) is an optimization task in power system. It is the process of allocating generation among the committed units such that the constraints imposed are satisfied and the fuel cost is minimized. Particle swarm optimization (PSO) is a population- based optimization technique that can be applied to a wide range of problems but it lacks global search ability in the last stage of iterations. This paper used a novel PSO with a inertia weight Improved (IWIPSO), which enhances the ability of particles to explore the solution spaces more effectively and increases their convergence rates. In this paper the power and usefulness of the NWIPSO algorithm is demonstrated through its application for 13 & 15 generator systems with constraints.
Keywords -Economic Load Dispatch (ELD), Particle swarm optimization (PSO), Novel weight improved Particle Swarm Optimization (NWIPSO).
I. INTRODUCTION
Electric utility system is interconnected to achieve the benefits of minimum production cost, maximum reliability and better operating conditions. The economic scheduling is the on-line economic load dispatch, wherein it is required to distribute the load among the generating units which are actually paralleled with the system, in such a way as to minimize the total operating cost of generating units while satisfying system equality and inequality constraints. For any specified load condition, ELD determines the power output of each plant (and each generating unit within the plant) which will minimize the overall cost of fuel needed to serve the system load [1]. ELD is used in real-time energy management power system control by most programs to allocate the total generation among the available units. ELD focuses upon coordinating the production cost at all power plants operating on the system.
Conventional as well as modern methods have been used for solving economic load dispatch problem
employing different objective functions. Various
conventional methods like lambda iteration method, gradient-based method, Bundle method [2], nonlinear programming [3], mixed integer linear programming [4], [5], dynamic programming [8], linear programming [7], quadratic programming [9], Lagrange relaxation method [10], direct search method [12], Newton-based techniques [11], [12] and interior point methods [6], [13] reported in the literature are used to solve such problems.
Conventional methods have many draw back such as nonlinear programming has algorithmic complexity. Linear programming methods are fast and reliable but require linearization of objective function as well as constraints with non-negative variables. Quadratic programming is a special form of nonlinear programming which has some disadvantages associated with piecewise quadratic cost approximation. Newton-based method has a drawback of the convergence characteristics that are sensitive to initial conditions. The interior point method is computationally efficient but suffers from bad initial termination and optimality criteria.
Recently, different heuristic approaches have been proved to be effective with promising performance, such as evolutionary programming (EP) [16], [17], simulated annealing (SA) [18], Tabu search (TS) [19], pattern search (PS) [20], Genetic algorithm (GA) [21], [22], Differential evolution (DE) [23], Ant colony optimization [24], Neural network [25] and particle swarm optimization (PSO) [26], [27]. Although the heuristic methods do not always guarantee discovering globally optimal solutions in finite time, they often provide a fast and reasonable solution. EP is rather slow converging to a near optimum for some problems. SA is very time consuming, and cannot be utilized easily to tune the control parameters of the annealing schedule. TS is difficult in defining effective memory structures and strategies which are problem dependent. GA sometimes lacks a strong capacity of producing better offspring and causes slow convergence near global optimum, sometimes may be trapped into local optimum. DE greedy updating principle and intrinsic differential property usually lead the computing process to be trapped at local optima.
Particle-swarm-optimization (PSO) method is a population-based Evolutionary technique first introduced in [26], and it is inspired by the emergent motion of a flock of birds searching for food. In comparison with other EAs such as GAs and evolutionary programming, the PSO has comparable or even superior search performance with faster and more stable convergence rates. Now, the PSO has been extended to power systems, artificial neural network training, fuzzy system control, image processing and so on.
International Journal of Emerging Technology and Advanced Engineering
Website: www.ijetae.com (ISSN 2250-2459, ISO 9001:2008 Certified Journal, Volume 4, Issue 1, January 2014) This new development gives particles more opportunity
to explore the solution space than in a standard PSO. The proposed method focuses on solving the economic load dispatch with Generator Ramp Rate Limits constraint. The feasibility of the proposed method was demonstrated for six bus system. The results obtained through the proposed approach and compared with those reported in recent literatures.
II. ECONOMIC LOAD DISPATCH PROBLEM FORMULATION
ELD is one of the most important problems to be solved in the operation and planning of a power system the primary concern of an ED problem is the minimization of its objective function. The total cost generated that meets the demand and satisfies all other constraints associated is selected as the objective function.
The ED problem objective function is formulated mathematically in (1) and (2),
(1)
(2)
(3)
Where, is the main objective function, ai, bi and ci are the cost coefficients, ei, fi are the constant of the valve point effects of the ith generator, D is power equilibrium, PD and PL represent total demand power and the total transmission loss of the transmission lines respectively.
III. CONSTRAINTS
This model is subjected to the following constraints,
1) Real Power Balance Equation
For power balance, an equality constraint should be satisfied. The total generated power should be equal to total load demand plus the total losses,
(4)
(5)
Where, PDemand is the total system demand and PLoss is the total line loss.
ijth element of loss coefficient symmetric matrix B, ith element of the loss coefficient vector and
loss coefficient constant. n =Number of generator.
2). Unit Operating Limits
There is a limit on the amount of power which a unit can deliver. The power output of any unit should not exceed its rating nor should it be below that necessary for stable operation. Generation output of each unit should lie between maximum and minimum limits.
(6)
Where, Pi is the output power of ith generator ,
and are the minimum and maximum power
outputs of generator i respectively.
3). Ramp Rate Limit
According to the operating increases and operating decreases of the generators are ramp rate limit constraints described in eq. (7) & (8).
1) As generation increases
(7)
2) As generation decreases
(8)
When the generator ramp rate limits are considered, the operating limits For each unit, output is limited by time dependent ramp up/down rate at each hour as given below.
=max( ) and
= min( ).
t) (9)
Where, current output power of ith generating unit,
Previous operating point of the ith generator, Down ramp rate limit (MW/time period) and Up ramp rate limit (MW/time period).
IV. OVERVIEW OF SOME PSOSTRATEGIES
A number of different PSO strategies are being applied by researchers for solving the economic load dispatch problem and other power system problems. Here, a short review of the significant developments is presented which will serve as a performance measure for the MRPSO technique [26] applied in this paper.
V. STANDARD PARTICLE SWARM OPTIMIZATION (PSO)
International Journal of Emerging Technology and Advanced Engineering
Website: www.ijetae.com (ISSN 2250-2459, ISO 9001:2008 Certified Journal, Volume 4, Issue 1, January 2014) The position and velocity vectors of the ith particle of a
d-dimensional search space can be represented as Pi=(pi1,pi2,………pid) and Vi=(vi1,vi2,………vid,) respectively. On the basis of the value of the evaluation function, the best previous position of a particle is recorded and represented as Pbesti=( pi1,pi2,………pid), If the gth particle is the best among all particles in the group so far, it is represented as Pgbest=gbest= (pg1,pg2,………pgd). The particle updates its velocity and position using (10) and (11)
(10)
(11)
Where, Vik is velocity of individual i at iteration k, k is pointer of iteration, W is the weighing factor, C1, C2 are the acceleration coefficients, Rand1( ), Rand2( ) are the random numbers between 0 & 1, Sik is the current position of individual i at iteration k, Pbesti is the best position of individual i and Gbest is the best position of the group. The coefficients c1and c2 pull each particle towards pbest and gbest positions. Low values of acceleration coefficients allow particles to roam far from the target regions, before being tugged back. on the other hand, high values result in abrupt movement towards or past the target regions. Hence, the acceleration coefficients cl and c2 are often set to be 2 according to past experiences. The term c1rand1 () x (pbest, -Sk1) is called particle memory influence or cognition part which represents the private thinking of the itself and the term c2Rand2( )×(gbest – S k 1 ) is called swarm influence or the social part which represents the collaboration among the particles. In the procedure of the particle swarm paradigm, the value of maximum allowed particle velocity Vmax determines the resolution, or fitness, with which regions are to be searched between the present position and the target position. If Vmax is too high, particles may fly past good solutions. If Vmax is too small, particles may not explore sufficiently beyond local solutions. Thus, the system parameter Vmax has the beneficial effect of preventing explosion and scales the exploration of the particle search. The choice of a value for Vmaxis often set at 10-20% of the dynamic range of the variable for each problem. W is the inertia weight parameter which provides a balance between global and local explorations, thus requiring less iteration on an average to find a sufficiently optimal solution. Since W decreases linearly from about 0.9 to 0.4 quite often during a run, the following weighing function is used in (10) (12)
Where, Wmax is the initial weight, Wmin is the final weight, Iter max is the maximum iteration number and iter is the current iteration position. Inertia Weight Improved PSO (IWIPSO) In this section, for getting the better global solution, the traditional PSO algorithm is improved by adjusting the weight parameter, cognitive and social factors. Based on [15], the velocity of individual I of IWIPSO algorithm is rewritten as, (13) Where, (14)
(15)
(16)
(17)
Where, wmin, wmax: initial and final weight,
c1min, c1max: initial and final cognitive factors and c2min, c2max: initial and final social factors.
VI. ALGORITHM FOR ED PROBLEM USING IWIPSO
The algorithm for ELD problem with ramp rate generation limits employing IWIPSO for practical power system operationis given in following steps:-
Step1:- Initialization of the swarm: For a population size the Particles are randomly generated in the Range 0–1 and located between the maximum and the minimum operating limits of the generators.
Step2:-Initialize velocity and position for all particles by randomly set to within their legal rang.
Step3:-Set generation counter t=1.
Step4:- Evaluate the fitness for each particle according to the objective function.
Step5:-Compare particles fitness evaluation with its Pbest and gbest.
Step6:-Update velocity by using (9)
Step7:- Update position by using (10)
International Journal of Emerging Technology and Advanced Engineering
Website: www.ijetae.com (ISSN 2250-2459, ISO 9001:2008 Certified Journal, Volume 4, Issue 1, January 2014) VII. CASE STUDY
Test Case-I
[image:4.595.311.555.170.287.2]The test results are obtained for three-generating unit system in which all units with their fuel cost coefficients. This system supplies a load demand of 150MW. The data for the individual units are given in Table 1. The best result obtained by NWIPSO for different population size is shown in Table 2 and Table 3.
Table 1
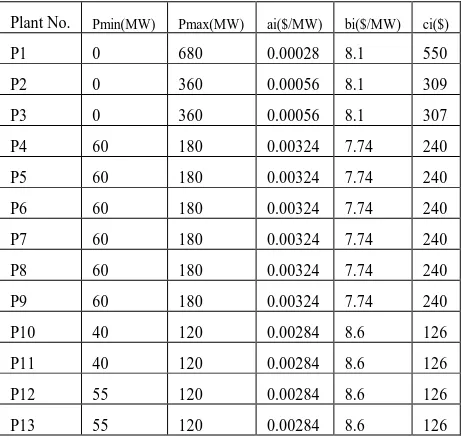
Capacity limits and fuel cost coefficients for thirteen generating units for the demand load of 1800MW
Table 2
Conversation results of 13 thermal generating units using NWIPSO for the different population size for the demand of 1800 MW.
Plant No. Pmin(MW) Pmax(MW) ai($/MW) bi($/MW) ci($)
P1 0 680 0.00028 8.1 550
P2 0 360 0.00056 8.1 309
P3 0 360 0.00056 8.1 307
P4 60 180 0.00324 7.74 240
P5 60 180 0.00324 7.74 240
P6 60 180 0.00324 7.74 240
P7 60 180 0.00324 7.74 240
P8 60 180 0.00324 7.74 240
P9 60 180 0.00324 7.74 240
P10 40 120 0.00284 8.6 126
P11 40 120 0.00284 8.6 126
P12 55 120 0.00284 8.6 126
[image:4.595.41.293.278.497.2]P13 55 120 0.00284 8.6 126
Table 3
Best convergence results of 13 thermal generating units for the demand of 1800MW.
Test Case –II
[image:4.595.318.544.400.622.2]The test results are obtained for six-generating unit system in which all units with their fuel cost coefficients. This system supplies a load demand of 1263MW. The data for the individual units are given in Table 4. The best result obtained by IWIPSO for different population size is shown in Table 5 and table 6.
Table 4
Capacity limit of generating units and fuel cost coefficients of 15 generating units for the demand of 2650MW.
Unit No. ai($/MW) bi($/MW) ci($) Pmin(MW) Pmax(MW)
P1 0.000299 10.1 671 150 455
P2 0.000183 10.2 574 150 455
P3 0.001126 8.8 374 20 130
P4 0.001126 8.8 374 20 130
P5 0.000205 10.4 461 150 470
P6 0.000301 10.1 630 135 460
P7 0.000364 9.8 548 135 465
P8 0.000338 11.2 227 60 300
P9 0.000807 11.2 173 25 162
P10 0.001203 10.7 175 25 160
P11 0.003586 10.2 186 20 80 P12 0.005513 9.9 230 20 80
P13 0.000371 13.1 225 25 85
P14 0.001929 12.1 309 15 55 P15 0.004447 12.4 323 15 55
Costs($/h) )
Population sizes
10 15 20 25 30 50
Min. cost 18013.24 18038.46 18029.701 17995.82 18019.80 18011.72
Max. cost 18211.63 18123.60 18127.90 18149.59 18970.61 19015.021
Aver. cost 18086.45 18080.20 18075.80 18064.12 18170.21 18170.51
Generating units
Optimal power at different pop sizes(MW)
10 15 20 25 30 50
P1 502.007 364.51 362.43 578.053 546.310 491.81
P2 66.549 194.07 218.11 163.301 163.511 146.83
P3 265.761 248.547 148.012 151.21 191.978 186.76
P4 118.699 103.211 151.81 124.23 75.68 93.90
P5 119.208 86.462 126.587 85.58 59.72 146.42
P6 164.909 128.019 138.34 149.946 131.697 162.302
P7 86.669 160.216 169.95 102.915 99.29 83.65
P8 84.692 111.129 83.60 81.559 106.030 109.09
P9 126.113 73.170 118.924 103.628 97.236 107.20
P10 79.564 78.153 54.71 65.41 85.83 79.827
P11 52.554 62.031 71.035 66.46 81.94 56.5
P12 59.851 79.324 57.451 57.393 74.747 82.04
[image:4.595.49.280.525.745.2]International Journal of Emerging Technology and Advanced Engineering
Website: www.ijetae.com (ISSN 2250-2459, ISO 9001:2008 Certified Journal, Volume 4, Issue 1, January 2014)
Table 5
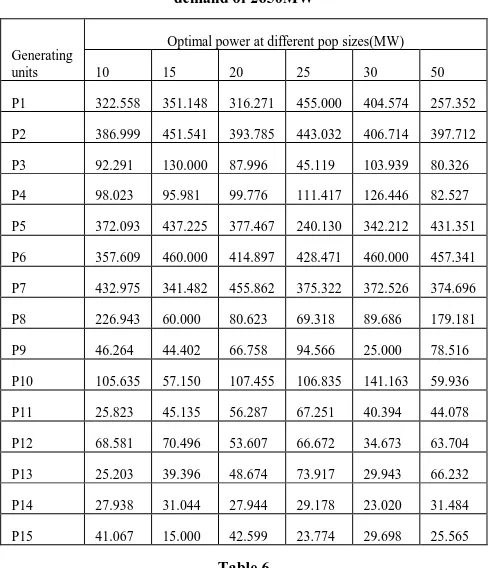
Conversance result of NWIPSO for 15 generating unit, load demand of 2650MW
Generating units
Optimal power at different pop sizes(MW)
10 15 20 25 30 50
P1 322.558 351.148 316.271 455.000 404.574 257.352
P2 386.999 451.541 393.785 443.032 406.714 397.712
P3 92.291 130.000 87.996 45.119 103.939 80.326
P4 98.023 95.981 99.776 111.417 126.446 82.527
P5 372.093 437.225 377.467 240.130 342.212 431.351
P6 357.609 460.000 414.897 428.471 460.000 457.341
P7 432.975 341.482 455.862 375.322 372.526 374.696
P8 226.943 60.000 80.623 69.318 89.686 179.181
P9 46.264 44.402 66.758 94.566 25.000 78.516
P10 105.635 57.150 107.455 106.835 141.163 59.936
P11 25.823 45.135 56.287 67.251 40.394 44.078
P12 68.581 70.496 53.607 66.672 34.673 63.704
P13 25.203 39.396 48.674 73.917 29.943 66.232
P14 27.938 31.044 27.944 29.178 23.020 31.484
[image:5.595.324.545.151.270.2]P15 41.067 15.000 42.599 23.774 29.698 25.565
Table 6
Best results for the 6 thermal generating unit using IWIPSO.
VIII. RESULT ANALYSIS
To assess the efficiency of the proposed IWIPSO approaches Sin this paper, tested for a case study of 3 thermal generating units and 6 thermal generating units data given in table 1 and table 3. The proposed algorithm runs on a 1.4-GHz, core-2 solo processor with 2GB DDR of RAM.
The ELD data tested for different population size as shown in table 2 and table 4 and 100 iteration used for obtaining results. Constants are taken in this study are acceleration coefficients are c1=c=2, Wmax=0.9 and Wmin=0.4.
The optimum result obtained by proposed approach for 13 thermal generating units is given in table2 and table3. The minimum cost, Maximum cost and average cost is 17995.82 $/h, 18149.59$/h and 18064.12$/h obtained by NWIPSO for the population size of 20. Fig.1 shows the improvement in each iteration for the six generation unit system respectively.
0 20 40 60 80 100
0 2 4 6 8 10
itermax
obj
ect
[image:5.595.42.287.161.445.2]ive
Figure 1: NWIPSO for 15 thermal generating units
Similarly result obtained by NWIPSO for 15 thermal generating units shown in table 6 shows that minimum average cost is 15325.591 $/h for the population size of 20. Convergence characteristic of IWIPSO for 6 thermal generating units is shown in figure1.
0 20 40 60 80 100
0 500 1000 1500 2000 2500 3000
itermax
ob
jec
tiv
e
Fig.2.Convergence characteristic of IWIPSO for 15 generating units
IX. CONCLUSIONS
This paper introduces NWIPSO optimization approach for the solution of power system economic dispatch with constraints. The proposed method has been applied to different test case. The analysis results have demonstrated that NWIPSO outperforms the other methods in terms of a better optimal solution. However, the much improved speed of computation allows for additional searches to be made to increase the confidence in the solution. Overall, the IWIPSO algorithms have been shown to be very helpful in studying optimization problems in power systems.
REFERENCES
[1] M.E. EI- hawary & G.S. Christensen, ―Optimal economic operatiom of Electrical power system,‖ New York,Academic,1979. [2] Mezger Alfredo J & Katia de Almeida C, ―Short term hydro thermal scheduling with bilateral traction via bundle method,‖ International Journal of Electrical power & Energy system 2007, 29(5), pp-387-396.
Costs
($/h)
Population sizes
10 15 20 25 30 50
Min.
cost 15282.976 15292.891 15290.384 15300.216 15283.757 15281.656 Max.
cost 15423.231 15375.257 15357.536 15515.031 15422.025 15394.327 Aver.
[image:5.595.319.542.360.514.2]International Journal of Emerging Technology and Advanced Engineering
Website: www.ijetae.com (ISSN 2250-2459, ISO 9001:2008 Certified Journal, Volume 4, Issue 1, January 2014)
[3] Martinez Luis Jose, Lora Trancoso Alicia & Santos Riquelme Jesus, ―Short term hydrothermal coordination based on interior point nonlinear programming and genetic Algorithm,‖IEEE porto power Tech Confrence,2001.
[4] M. Gar CW, Aganagic JG,Tony Meding Jose B & Reeves S, ―Experience with mixed integer linear programming based approach on short term hydrothermal scheduling,‖ IEEE transaction on power system 2001;16(4),pp.743-749.
[5] G.Torres and V. Quintana, ―On a non linear multiple-centrality corrections interior-point method for optimal power flow,‖ IEEE. transaction on power system, vol.16,no2,2001,pp.222-228. [6] K.Ng and G.Shelbe, ― Direct load control –a profit-based load
management using linear programming,‖ IEEE transaction on power system,vol.13,no.2,1998,pp.688-694.
[7] Shi CC, Chun HC, Fomg IK & Lah PB., ― Hydroelectric generation scheduling with an effective differential dynamic programming
algorithm,‖ IEEE transaction on power system
1990,5(3),pp.737-743
[8] Erion Finardi C, silva Edson LD, & Laudia sagastizabal CV., ―Solving the unit commitment problem of hydropower plants via Lagrangian relaxation and sequential quadratic programming,‖ Computaional & Applied Mathematics 2005,24(3).
[9] Tkayuki S & Kamu W., ― Lagrangian relaxation method for price based unit commitment problem,‖ Engineering optimization taylor Francis 2004,pp. 36-41.
[10] D.I. sun, B.Ashley,B.Brewer,A.Hughes and W.F. Tinney, ― Optimal power flow by Newton Aproach,‖ IEEE transaction on power system, vol.103,1984,pp.2864-2880.
[11] A.Santos and G.R. da Costa, ―Optimal power flow by Newtons method applied to an augmented Lagrangian function,‖ IEE proceedings generation, Transmission & distribution, vol.142,no.1,1989,pp.33-36.
[12] X.Yan & V.H. Quintana, ― Improving an interior point based OPF by dynamic adjustments of step sizes and tolerances,‖ IEEE transaction on power system , vol.14,no.2,1999,pp.709-717. [13] J.A. Momoh and J.Z. Zhu, ― Improved interior point method for
OPF problem,‖ IEEE transaction on power system, vol.14,no.2,1999,pp.1114-1120.
[14] Nidhul Sinha, R.Chakrabarti & P.K. Chattopadhyay, ― Evolutionary programming techniques for Economic load Dispatch,‖ IEEE transactions on Evolutionary Computation, Vol.7 No1,2003, pp.83-94.
[15] K.P. wong & J. yuryevich, ―Evolutionary based algorithm for environmentally constraints economic dispatch,‖ IEEE transaction on power system , vol.13,no.2,1998,pp.301-306.
[16] K.P. Wong & C.C. Fung, ―Simulated annealing based economic dispatch algorithm,‖ proc. Inst. Elect. Eng. C., Gen., transm.,Distrib.,vol.140,no.6,nov.1993,pp.505-519.
[17] W.M. Lin,F.S. Cheng & M.T. Tsay, ―An improved Tabu search for economic dispatch with multiple minima,‖ IEEE transaction on power system , vol.17,no.2,2002,pp.108-112.
[18] J.S. Al-Sumait, A.K. Al-Othman & J.K. Sykulski, ― Application of pattern search method to power system valve point economic load
dispatch,‖ Elect. Power energy system,
vol.29,no.10,2007,pp.720-730.
[19] D.C.Walter & G.B.Sheble, ― genetic algorithm solution of economic dispatch with valve point loading,‖ IEEE transaction on power system , vol.8,no.3,1993,pp.1325-1332.
[20] Tarek Bouktir, Linda Slimani & M.Belkacemi, ― A genetic algorithm for solving for the optimal power flow problem,‖ Leonardo journal of sciences, Issue-4,2004,pp.44-58.
[21] K. Vaisakh & L.R. Srinivas, ―Differential Approach for optimal power flow solutions,‖ Journals of theoretical and applied information Technology, 2005-08, pp. 261-268.
[22] Boumediene Allaoua & Abedellah Laoufi, ―Optimal power flow solution Unsing ant manners for electrical network,‖ Advance in Electrical & Computer engg.,‖ Vol.9, 2009, pp.34-40.
[23] L.L. Lai & Mata Prasad, ―Application of ANN to economic load dispatch,‖ proceeding of 4th
international conference on Advance in power system control, Operation and management, APSCOM-97, Hong-Kong, nov-1997, pp.707-711.
[24] J.Kennedy & R.C. Eberhart, ―Particle Swarm Optimization,‖ proceeding of IEEE international conference on Neural networks , Vol.4, 1995, pp. 1942-1948.
[25] C.H. Chen & S.N. Yeh, ― PSO for Economic power dispatch with valve point effects,‖ IEEE PES transmission & Distribution conference and Exposition Latin America, Venezuela,2006. [26] K.S. Swarup, ― Swarm intelligence Approach to the solution of
optimal power flow,‖ Indian Institute of science,oct-2006, pp. 439-455.