M e l ti n g c u r v e a n d p h a s e di a g r a m
of v a n a di u m u n d e r h i g h-p r e s s u r e
a n d h i g h-t e m p e r a t u r e c o n di tio n s
E r r a n d o n e a , D, M a c l e o d , SG, B u r a k ov s ky, L, S a n t a m a r i a-P e r e z, D,
P r o c t or, JE, Cy n n , H a n d M e z o u ar, M
h t t p :// dx. d oi.o r g / 1 0 . 1 1 0 3 / P h y s R e vB. 1 0 0 . 0 9 4 1 1 1
T i t l e M el ti n g c u r v e a n d p h a s e d i a g r a m of v a n a d i u m u n d e r h i g h-p r e s s u r e a n d h i g h-t e m h-p e r a t u r e c o n d i tio n s
A u t h o r s E r r a n d o n e a , D, M a cl e o d , SG, B u r a k o v s ky, L, S a n t a m a r i a-P e r e z, D, a-P r o c t or, JE, Cy n n , H a n d M e z o u ar, M
Typ e Ar ticl e
U RL T hi s v e r si o n is a v ail a bl e a t :
h t t p :// u sir. s alfo r d . a c . u k /i d/ e p ri n t/ 5 2 7 1 0 / P u b l i s h e d D a t e 2 0 1 9
U S IR is a d i gi t al c oll e c ti o n of t h e r e s e a r c h o u t p u t of t h e U n iv e r si ty of S alfo r d . W h e r e c o p y ri g h t p e r m i t s , f ull t e x t m a t e r i al h el d i n t h e r e p o si t o r y is m a d e f r e ely a v ail a bl e o nli n e a n d c a n b e r e a d , d o w nl o a d e d a n d c o pi e d fo r n o
n-c o m m e r n-ci al p r iv a t e s t u d y o r r e s e a r n-c h p u r p o s e s . Pl e a s e n-c h e n-c k t h e m a n u s n-c ri p t fo r a n y f u r t h e r c o p y ri g h t r e s t r i c ti o n s .
1
Exploring the behavior of vanadium under high-pressure and
high-temperature conditions
D. Errandonea1, S. G. MacLeod2,3, L. Burakovsky4, D. Santamaria-Perez1, J. E. Proctor3,†, H. Cynn5, and M. Mezouar6
1
Departamento de Física Aplicada-ICMUV, Universidad de Valencia, MALTA Consolider Team,
Edificio de Investigación, C/Dr. Moliner 50, 46100 Burjassot, Valencia, Spain
2
Atomic Weapons Establishment, Aldermaston, Reading, RG7 4PR, United Kingdom
3
SUPA, School of Physics and Astronomy, and Centre for Science at Extreme Conditions, The
University of Edinburgh, Edinburgh, EH9 3FD, United Kingdom
4
Theoretical Division, Los Alamos National Laboratory, Los Alamos, New Mexico 87545, USA
5
Physics Division, Lawrence Livermore National Laboratory, Livermore, CA 94550, USA
6
ID27 Beamline, European Synchrotron Radiation Facility, 71 Avenue des Martyrs, 38000
Grenoble, France
†
Present address: School of Computing, Science, and Engineering, University of Salford,
Manchester M5 4WT, UK
2
1. Introduction
Since the early study by the Mainz group reported nearly two decades ago [1], the melting of transition metals at high pressure (P) has been the focus of several research groups. The main motivation for these studies was to resolve the discrepancies in the values of melting temperatures (T) from diamond anvil cell (DAC) and shock-wave (SW) experiments, and density-functional theory (DFT) calculations. Most of the studies have focused on iron (Fe) [2-4], tantalum (Ta) [5-7], and molybdenum (Mo) [8-10]. Several hypotheses have been proposed to explain the apparent disagreements [11-14]. In the case of Mo, a recent study [9] has shown that microstructure formation could be the cause of the underestimation of melting temperature in the early studies.
Unlike other transition metals, vanadium (V) has scarcely been studied at high pressure (HP) and high temperature (HT). In fact, its melting T has only been calculated at one pressure point above ambient P [15]. This calculated melting T is higher than those estimated from both DAC [1] and SW [16] experiments, which are themselves separated by more than 1000 K at a pressure of 100 GPa. Clearly, further efforts should be dedicated to the study of the behavior of V under HP-HT conditions. The accurate determination of the melting curve of V is not only important from a fundamental physics point of view, but also from a technological one, since most of the V produced is for usage in metallurgy as a steel additive, to increase the strength of steel.
3
is predicted to be reversible [19]. However, this prediction has yet to be tested by experiments. This, and the findings described above indicate the appropriateness of performing HP-HT studies on V.
In this work, we report synchrotron powder x-ray diffraction (XRD) studies on V up to 120 GPa and 4000 K. These studies are combined with experiments where the observation of temperature plateaus is used as a melting diagnostic. DFT calculations are carried out to validate the experimental results. These studies have allowed us to accurately determine the melting curve and the bcc-rhombohedral phase boundary of V, and its HP-HT equation of state (EOS). The reported results will be discussed and compared with previous DAC and SW experiments.
2. Methods
Angle-dispersive XRD measurements were performed at beamline ID27 of the European Synchrotron Radiation Facility (ESRF) in five different samples to reduce the
chances of chemical reactions. Platelets of V (99.99% purity, Aldrich) of around 25 µm in
diameter and 5 µm thick were loaded into DACs with anvil culets of 200-280 µm. We used
rhenium gaskets pre-indented to a 30 µm thickness. NaCl was the pressure-transmitting
4
Pressure was increased at room temperature (RT) up to the target pressure, and then the samples were gradually heated under constant load. For the experiments we used a double-side laser heating system equipped with infrared YAG lasers, previously described [22]. The temperature was determined from the thermal emission of the samples [23]. The
x-ray beam (λ = 0.3738 Å) was focused on a 2 x 2 µm2 area. During each run, XRD and
thermal emission spectra were recorded simultaneously every 2 seconds. XRD was measured using a MAR CCD detector. The indexing and refinement of the powder XRD patterns were performed using PowderCell [24].
In addition to synchrotron experiments, a second set of experiments was performed to determine melting based upon the appearance of a plateau in the temperature as a function of applied laser power [2, 6]. In this case, single-side laser heating was used [25], NaCl was the pressure medium, temperatures were measured using the same technique employed in HP-HT synchrotron experiments, and pressures were measured using the ruby fluorescence technique at RT [26] and corrected by taking account of the thermal pressure [27].
We have also calculated the melting curve of V using the Z method [28] implemented with quantum molecular dynamics (QMD) simulations using VASP. These simulations are based on DFT. They were performed using the Perdew-Burke-Ernzerhof (PBE) exchange-correlation functionals and considering thirteen valence electrons per atom (3s, 3p, 3d, and 4s orbitals). We used a 432-atoms (6 × 6 × 6) supercell with a single Γ-point. For such a large supercell, full energy convergence (to ≤ 1 meV/atom) is already
5
carried out the calculation of six melting points corresponding to six different unit cells with lattice constants of (in Å) 3.35, 3.15, 2.90, 2.75, 2.60, and 2.45. The duration of the runs was 15000-25000 time-steps of 1 fs each. The P-T coordinates of the six melting points that these QMD simulations produced are (P in GPa, T in K) (-14.7, 1540), (6.7, 2410), (40.1, 3060), (101, 4060), (207, 5230), (390, 6870). The error in T is about half of the initial T increment for a sequence of runs at a given fixed supercell volume. This increment was 250 K for the two lowest-P points, and 312.5 K for the remaining four points; hence the corresponding errors are (approximately) ±125 K and ±160 K, respectively. The error in P is negligibly small: less than 1 GPa for the two lowest-P points, and a few GPa for the remaining four points.
3. Results and discussion
6
phase). The broadening of the two peaks of V can be accounted for by assuming a rhombohedral distortion of bcc as proposed by Ding et al. [17]. As shown by the Rietveld refinement in Fig. 1, the pattern measured at RT and 64 GPa can be assigned to a rhombohedral structure belonging to space group R-3m with unit-cell parameters a =
2.431(1) Å and α = 109.47(5)º. The rhombohedral phase is observed in our measurements
at RT up to 120 GPa. At HT, the rhombohedral structure is observed up to 1560 K at 64 GPa (see Fig. 1) and up to 1700 K at 120 GPa. At higher temperatures the bcc phase is recovered as can be seen by the pattern measured at 64 GPa and 1840 K (notice that the three peaks of V are sharp again). This observation is consistent with both the predictions made by Wang et al. [18] and the calculations of Landa et al. [15] who find that bcc-V is stable at 75 GPa and 2500 K. This suggests that the phonon anomalies triggering the rhombohedral lattice distortion in V at HP [31] can be canceled at HT by effects from phonon-phonon scattering [32].
7
also been observed in Mo below the melting temperature [9], and which is probably related to pre-melting effects. At 2930 K, we observed the complete disappearance of the peaks of V and the increase of the background. In addition, we then observed that beyond this point, the estimated temperature of V did not increase with further increases in laser power of up to 20%. These observations can be interpreted as the onset of melting [34-36]. In Fig. 3, we zoom in and focus on the XRD patterns in the 8º - 12º region to ease the identification of the background increase.
Using the method described above we have been able to determine the melting temperature of V at 27, 32, 53, and 64 GPa. At 120 GPa, V remained solid up to the highest temperature reached at this pressure (3750 K), but recrystallization of V was observed from 3300 to 3750 K. We have also determined the melting temperature from experiments where melting was detected using the temperature plateau criterion [34]. These melting temperatures were obtained at 40, 58, and 85 GPa. The results are summarized in Fig. 4, where we present a P-T phase diagram for V. We not only include the melting curve from this study, but the present and previous [15-19] results on the bcc-rhombohedral phase boundary, the results from previous DAC [1] and SW [16] experiments, the experimental Hugoniots measured by McQueen [37] and by Foster et al. [38], and the theoretical Hugoniot calculated by ourselves. A tentative bcc-rhombohedral phase boundary is drawn (dashed blue line) which qualitatively resembles the phase boundary calculated by Wang et al. [19] and is consistent with all the results available in the literature [15-19]. Notice that
8
The first comment we would like to make, based on our results, is that both experimental techniques give melting points that are consistent with each other and agree within error bars with our computational study. The simulations determined the melting temperature at higher pressures than those covered in our experiments, the melting T at 390
GPa being equal to 6870±160 K. As in many other metals [39], the experimental melting
curve can be described by a Simon-Glatzel equation [40]: 𝑇𝑇𝑀𝑀(𝐾𝐾) = 2183 ×�1 + 𝑃𝑃 32�
0.46 ,
9
is consistent with the spalling and fragmentation induced in laser-shocked V, causing damage to the surface that resembled melting [42].
10
use of the (rigid) muffin-tin approach to the calculation of the elastic constants of transition metals [44] leads to the overestimation of both C11 and C44 for V by a factor of ~ 2, hence the shear modulus, G, is overestimated by a factor of ~ 2 as well. Since the melting temperature is proportional to the shear modulus [45], it is reasonable to assume that the use of this method overestimates the melting temperature by a similar factor, which seems to be the case with Landa's value (~ 8000/5000 = 1.6).
11
that highly non-hydrostatic conditions can considerably affect the compressibility of V, as observed in other materials [49].
Regarding the HT results, Crichton et al. [46] have reported a thermal EOS that reproduces accurately their experimental results up to 1000 K and 11.5 GPa. They have used a Berman model [50] in which the dependence of the linear temperature on the bulk modulus and thermal expansion coefficient are assumed, with α0 = 4.8(6) 10−5 K-1, α1 = −2.4(9) 10−8 K-2, and dK/dT = −0.0446(7) GPa K−1 [46]. However, these parameters lead to
unphysical results if the thermal EOS is extrapolated to the P-T range of our study. For instance, for temperatures higher than 2000 K, the thermal expansion becomes negative, and at pressures higher than 30 GPa the HT isotherms cross the RT isotherm. We have therefore fitted the parameters again, by including all the results shown in Fig. 5. We obtained α0 = 4.6(6) 10−5 K-1, α1 = −1.2(5) 10−8 K-2, and dK/dT = −0.011(1) GPa K−1. The constant term of the thermal expansion (α0) agrees with the value reported by Crichton et al. [46], but α1 is reduced to half of their value (however, the upper limit of our error bar overlaps with the lower limit of the error bar of the previous results). Regarding dK/dT, our value is one fourth of the previously reported value, but is similar to the values reported for this parameter in most metals [51, 52].
4. Conclusions
12
from the previous DAC experiment, but considerably lower than that reported in SW experiments. Explanations for these discrepancies have been provided. Finally, a PVT EOS for V is generated, which is valid for the P-T range covered in our experiments. These results will contribute to an improvement in the understanding of the HP-HT behavior of transition metals.
Acknowledgments
13
References
[1] D. Errandonea, B. Schwager, R. Ditz, C. Gessmann, R. Boehler, and M. Ross, Phys. Rev. B 63,
132104 (2001).
[2] S. Anzellini1, A. Dewaele, M. Mezouar, P. Loubeyre, and G. Morard, Science 340, 464 (2013).
[3] R. Boehler, D. Santamaría-Pérez, D. Errandonea, and M. Mezouar, J. Phys.: Conf. Ser. 121,
022018 (2008).
[4] T. Sun, J. P. Brodholt, Y. Li, and L. Vočadlo, Phys. Rev. B 98, 224301 (2018).
[5] D. Errandonea, M. Somayazulu, D. Hausermann, and H. K. Mao, J. Phys.: Condensed Matter
15, 7635 (2003).
[6] A. Dewaele, M. Mezouar, N. Guignot, and P. Loubeyre, Phys. Rev. Lett. 104, 255701 (2010).
[7] L. Burakovsky, S. P. Chen, D. L. Preston, A. B. Belonoshko, A. Rosengren, A. S.
Mikhaylushkin, S. I. Simak, and J. A. Moriarty, Phys. Rev. Lett. 104, 255702 (2010).
[8] D. Santamaría-Pérez, M. Ross, D. Errandonea, G. D. Mukherjee, M. Mezouar, and R. Boehler, J
Chem Phys. 130, 124509 (2009).
[9] R. Hrubiak, Y. Meng, and G. Shen, Nature Communications 8, 14562 (2017).
[10] C. Cazorla, M. J. Gillan, S. Taioli, D. Alfè, J. Chem. Phys. 126, 194502 (2007).
[11] C. J. Wu, P. Söderlind, J. N. Glosli, and J. E. Klepeis, Nature Materials 8, 223 (2009).
[12] D. Errandonea, Nature Materials 10, 170 (2009).
[13] M. Ross, D. Errandonea, and R. Boehler, Phys. Rev. B 76, 184118 (2007).
[14] A. Belonoshko, L. Burakovsky, S. P. Chen, B. Johansson, A. S. Mikhaylushkin, D. L. Preston,
S. I. Simak, and D. C. Swift, Phys. Rev. Lett. 100, 135701 (2008).
[15] A. Landa, P. Söderlind, and L. Yang, Phys. Rev. B 89, 020101(R) (2014).
[16] C. Dai, X. G. Jin, X. M. Zhou, J. Liu, and J. Hu, J. Phys. D: Appl. Phys. 34, 3064 (2001).
[17] Y. Ding, R. Ahuja, J. Shu, J. P. Chow, W. Luo, and H. K. Mao, Phys. Rev. Lett. 98, 085502
(2007).
[18] Z. Jenei, H. P. Liermann, H. Cynn, J. H. P. Klepeis, B. J. Baer, and W. J. Evans, Phys Rev B.
83, 054101 (2011).
[19] Y. X. Wang, Q. Wu, X. R. Chen, H. Y. Geng, Scientific Reports 6, 32419 (2016).
[20] P. I. Dorogokupets and A. Dewaele, High Press. Res. 27, 431 (2007).
[21] K. D. Litasov, P. N. Gavryushkin1, P. I. Dorogokupets, I. S. Sharygin1, A. Shatskiy, Y. Fei, S.
V. Rashchenko, Y. V. Seryotkin, Y. Higo, K. Funakoshi, and E. Ohtani, J. Appl. Phys. 113, 133505
14
[22] E. Schultz, M. Mezouar, W. Crichton, S. Bauchau, G. Blattmann, D. Andrault, G. Fiquet, R.
Boehler, N. Rambert, B. Sitaud, and P. Loubeyre, High. Press. Res. 25, 71 (2005).
[23] G. Shen, M. I. Rivers, Y. B. Wang, and S. R. Sutton, Rev. Sci. Instrum. 72, 1273 (2001).
[24] W. Kraus and G. Nolze, J. Appl. Cryst. 29, 301 (1996).
[25] D. Errandonea, Phys. Rev. B 87, 054108 (2013).
[26] A. Dewaele, M. Torrent, P. Loubeyre. and M. Mezouar, Phys. Rev. B 78, 104102 (2008).
[27] C. K. Singh, B. K. Pande, and A. K. Pandey, AIP Conference Proceedings 1953, 130002
(2018).
[28] L. Burakovsky, N. Burakovsky, M. J. Cawkwell, D. L. Preston, D. Errandonea, and S. I. Simak
Phys. Rev. B 94, 094112 (2016).
[29] D. Errandonea, J. Phys. Chem. Sol. 70, 1117 (2009).
[30] V. B. Prakapenka, G. Shen, and L. S. Dubrovinsky, High Temp. High Press. 35, 2 (2003).
[31] D. Antonangeli, D. L. Farber, A. Bosak, C. M. Aracne, D. G. Ruddle, and M. Krisch, Scientific
Reports 6, 31887 (2016).
[32] P. D. Bogdanoff, B. Fultz, J. L. Robertson, and L. Crow, Phys. Rev. B 65, 014303 (2001).
[33] R. Boehler, M. Ross, and D. B. Boercker, Phys. Rev. Lett. 78, 4589 (1997).
[34] O. T. Lord, I. G. Wood, D. P. Dobson, L. Vočadlo, W. Wang, A. R. Thomson, E. Wann, G. Morard, M. Mezouar, and M. J. Walter, Earth Planet. Sci. Lett. 408, 226 (2014).
[35] A. Dewaele, M. Mezouar, N. Guignot, and P. Loubeyre, Phys. Rev. B 76, 144106 (2007).
[36] S. Anzellini, V. Monteseguro, E. Bandiello, A. Dewaele, L. Burakovsky, and D. Errandonea,
Scientific Report 9 (2019), in press.
[37] R. G. McQueen and S. P. Marsh, J. Appl. Phys. 31, 1253 (1960).
[38] J. M. Foster, A. J. Comley, G. S. Case, P. Avraam, S. D. Rothman, A. Higginbotham, E. K. R.
Floyd, E. T. Gumbrell, J. J. D. Luis, D. McGonegle, N. T. Park, L. J. Peacock, C. P. Poulter, M. J.
Suggit, and J. S. Wark, J. Appl. Phys. 122, 023517 (2017).
[39] D. Errandonea, J. Appl. Phys. 108, 033517 (2010).
[40] F. E. Simon and G. Glatzel, Z. Anorg. Chem. 178, 309 (1929).
[41] G. R. Gathers, J. W. Shaner, R. S. Hixson and D. A. Young, High T - High P 11, 653 (1979).
[42] H. Jarmakani, B. Maddox, C. T. Wei, D. Kalantar, and M. A. Meyers, Acta Mater. 58, 4604
(2010).
[43] S. I. Ashitkov, P. S. Komarov, E. V. Struleva, M. B. Agranat, and G. I. Kanel, JETP Letters
101, 276 (2015).
[44] Y. Ohta and M. Shimizu, Physica B 154, 113 (1988).
15
[46] W. A. Crichton, J. Guignard, E. Bailey, D. P. Dobson, S. A. Hunt, and A. R. Thomson, High
Press. Res. 36, 16 (2016).
[47 F. Birch, J. Geophys. Res. 83, 1257 (1978).
[48] D. Errandonea, Ch. Ferrer-Roca, D. Martinez-Garcia, A. Segura, O. Gomis, A. Munoz, P.
Rodriguez-Hernandez, J. Lopez-Solano, S. Alconchel, F. Sapina, Phys. Rev. B 82, 174105 (2010).
[49] D. Errandonea, A. Muñoz, and J. Gonzalez-Platas, J. Appl. Phys. 115, 216101 (2014).
[50] R. J. Angel, J. Gonzalez-Platas, and A. Alvaro, Z. Kristallogr. 229, 405 (2014).
[51] S. Anzellini, D. Errandonea, S. G. MacLeod, P. Botella, D. Daisenberger, J. M. De’Ath, J.
Gonzalez-Platas, J. Ibáñez, M. I. McMahon, K. A. Munro, C. Popescu, J. Ruiz-Fuertes, and C. W.
Wilson, Phys. Rev. Mat. 2, 083608 (2018).
[52] D. Errandonea, S. G. MacLeod, J. Ruiz-Fuertes, L. Burakovsky, M. I. McMahon, C. W.
16
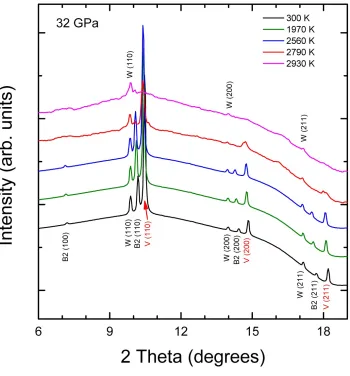
Figure 1: (Color online) XRD patterns at selected pressures and temperatures (indicated in the
figure). In the two lowest traces, experiments are shown with symbols and Rietveld refinements and
residuals are shown with solid lines. The ticks correspond to positions of V peaks. The splitting of
V peaks due to the rhombohedral distortion can be clearly seen. All peaks are labeled (V peaks in a
different color to facilitate the identification). W identifies peaks from tungsten and B1 and B2
peaks from the different phases of NaCl. Bcc and Rh are used to identify the bcc and rhombohedral
17
Figure 2:(Color online) XRD patterns for a heating run at 32 GPa. The peaks of V, W, and B2
NaCl are identified. Temperatures are given in the figure. The pattern measured at 2790 K
18
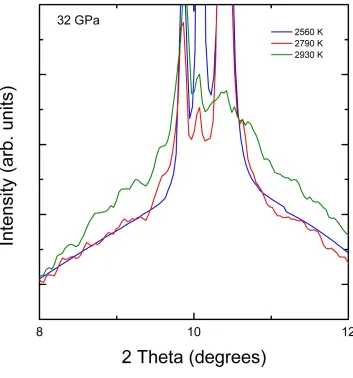
Figure 3: (Color online) Zooming in on the region of the XRD patterns measured at 32 GPa to
illustrate the disappearance of the (110) peak of V and the increase of the background.
19
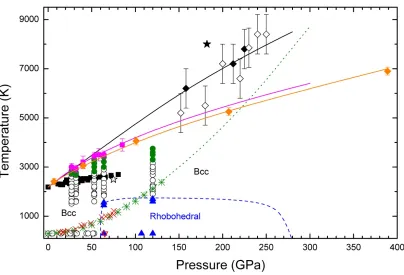
Figure 4: (Color online) P-T phase diagram of V. White circles: bcc V. Blue triangles:
Rhombohedral V. Upside-down pink triangle: Rhombohedral V from Ref. 17. Blue dashed line is
the tentative bcc-rhombohedral phase boundary based upon present and previous studies [17, 19].
White star represents the bcc stability point calculated by Landa et al. [15]. Green circles are the
points where rapid recrystallization is observed. Pink circles are the melting points determined from
present synchrotron experiments. Pink squares are the melting points determined from temperature
plateaus. The pink line is the Simon-Glatzel fit to the present melting results. Orange line and
diamonds is the calculated melting curve using the Z method. Green asterisks belong to the
Hugoniot measured by McQueen [37] and red crosses to the Hugonot measured by Foster et al.
[38]. Green dotted line is our calculated Hugoniot. White diamonds are the Hugoniot points
measured by Dai et al. [16]. Black diamonds are the melting points determined by the same authors
in SW experiments, and the black line is the melting curve proposed by them. Black squares are the
20
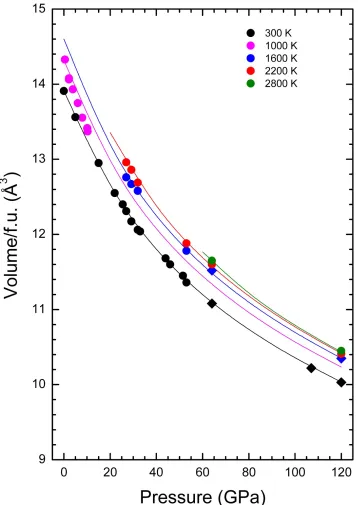
Figure 5: (Color online) Pressure evolution of the unit-cell volume per formula unit (f.u.) for
different isotherms identified by colors (temperatures are indicated in the figure). Circles
correspond to the bcc phase and diamonds to the rhombohedral phase. The results at 1000 K were