i
NOVEL MARKERS FOR HUMAN T
REGULATORY CELLS IN HEALTHY
DONORS AND CANCER PATIENTS
May Abd al SAMID
University of Salford, Salford, UK
School of Environment & Life Sciences
ii
Table of contents
Page
List of Tables ... vii
List of Figures... viii
List of publications derived from this work ... xii
Declaration ... xiii
Acknowledgments ... xiv
Dedication... xv
List of Abbreviations ... xvi
Abstract... xviii
Chapter 1 Introduction ... 1
Cancer ... 2
1.1 1.1.1 Pancreatic malignant cancer ... 5
1.1.2 Liver metastases from colorectal cancer ... 10
Adaptive immune system ... 15
1.2 1.2.1 Introduction to T regulatory cell subsets ... 21
1.2.2 The different suppressive mechanisms of T regulatory cells ... 24
1.2.3 Thymus-derived naturally occurring T regulatory cells ... 28
1.2.4 Peripherally-induced T regulatory cells ... 30
iii
1.2.6 CD8+ T regulatory cells ... 38
Transplantation tolerance and the Immunosuppressive Drugs ... 41
1.3 T regulatory cells in cancer ... 44
1.4 1.4.1 Depletion of Tregs to improve the treatments of cancer ... 47
Different markers for T regulatory cells ... 51
1.5 1.5.1 Neuropilin-1 ... 52
1.5.2 GARP and LAP... 54
1.5.3 Glucocorticoid-induced tumour necrosis factor receptor (GITR) ... 57
1.5.4 Identification of T regulatory cells by Helios ... 58
1.5.5 Ki-67 antigen marker ... 61
Flow cytometry ... 62
1.6 1.6.1 Flow cytometry functional assay ... 63
Hypothesis ... 65
1.7 Objective ... 65
iv Blood samples ... 67 2.1
Reagents and antibodies ... 70 2.2
Blood isolation ... 72 2.3
Extracellular and Intracellular Staining ... 74 2.4
Statistical methods... 78 2.5
Gating strategy ... 79 2.6
Results ... 81 Chapter 3
Expression of FoxP3, Helios, GARP and LAP in CD3+CD4+ and 3.1
CD3+CD4- T cells ... 82 3.1.1 FoxP3 is expressed mainly on CD3+CD4+ T cellscompared to CD3+CD4- (CD8+) T cells ... 82 3.1.2 Expression of GARP/LAP is significantly higher on CD4+FoxP3+ T cells compared to CD4-FoxP3+ T cells ... 85 3.1.3 CD4+GARP+LAP+ T cells express significantly higher level of Helios and FoxP3 compared to CD4-GARP+LAP+ T cells ... 89
Analysing the expression level of FoxP3, Helios, GARP and LAPin CD4+ 3.2
T cells isolated from healthy donors ... 92
3.2.1 LAP expressed significantly higher than GARP on activated CD4+ T cells in healthy donors ... 92
v 3.2.4 GARP/LAP expressed on a subset of CD4+FoxP3-Helios+ in
non-activated setting ... 99
3.2.5 GARP/LAP expressed on Helios+, regardless of FoxP3 expression, in activated CD4+ T cells ... 101
Investigating the expression level of FoxP3, Helios, GARP and LAP in 3.3 CD4+ T cells isolated from healthy donors, chronic pancreatitis, pancreatic cancer, and liver metastatic from colorectal cancer patients ... 103
3.3.1 LAP is expressed significantly higher than GARP on activated CD4+ T cells in healthy donors and pancreatic cancer patients ... 103
3.3.2 Levels of FoxP3+LAP–, FoxP3+LAP+, and FoxP3-LAP+ Treg subsets in cancer patients and controls... 106
3.3.3 Levels of Helios+LAP–, Helios+LAP+, Helios-LAP+ Treg subsets in cancer patients and controls ... 110
3.3.4 FoxP3+/–Helios+ T cells are expanded in liver metastatic from colorectal cancer patients in rested and activated setting ... 113
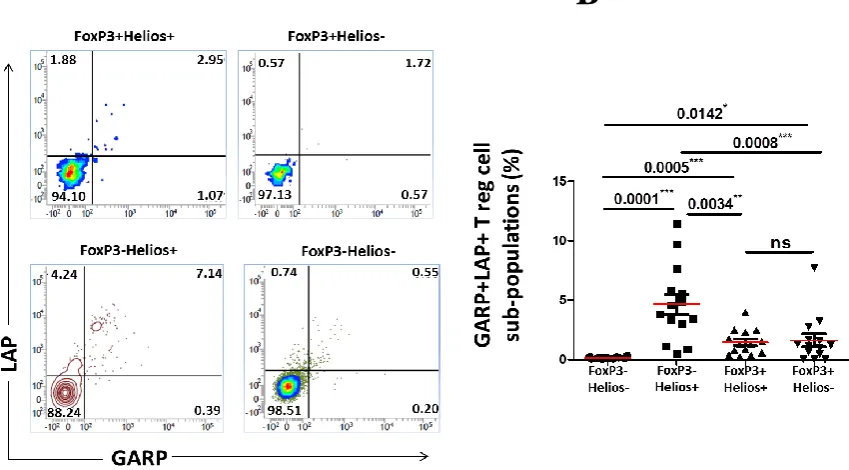
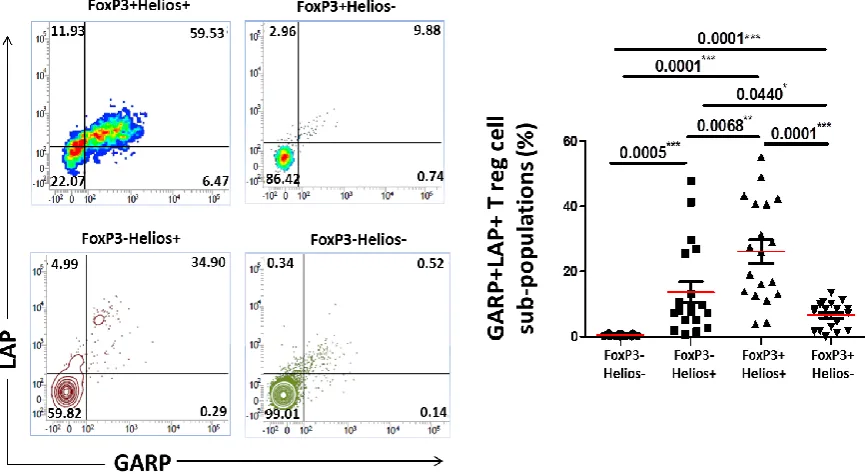
Expression of GARP/LAP on FoxP3+/−Helios+/− T cell subsets in cancer 3.4 patients, compared to controls ... 116
Results ... 127
Chapter 4 The expression level of GARP or LAP on FoxP3+/-Helios+/- T cells ... 128
4.1 4.1.1 LAP expression on FoxP3+/-Helios+/- non-activated T cells ... 128
4.1.2 LAP expression on FoxP3+/-Helios+/- activated T cells ... 132
4.1.3 GARP expression on FoxP3+/-Helios+/- non-activated T cells ... 136
vi Results ... 144 Chapter 5
Secretion of IL-10 and IFN-γ from GARP+LAP+ T cells and 5.1
FoxP3+Helios+ T cells ... 145 5.1.1 CD4+ T cells expressing GARP/LAP secrete IL-10 but not IFN-γ ... 145 5.1.2 FoxP3+Helios+ Tregs secrete high level of the suppressive cytokine IL-10 .... 149 Discussion ... 152 Chapter 6
Conclusion ... 170 Chapter 7
References ... 177
Appendix 1 ... 220
vii
List of Tables
Table 1: Regulatory T cells subsets and suppressive mechanisms... 23
Table 2: A study of the characteristic features of the subpopulations ... 69
Table 3: Antibodies ... 71
Table 4: The scheme that PRISM uses to report the P values ... 78
viii
List of Figures
Figure 1: Anatomy of the pancreas. ... 8
Figure 2: Tumours in pancreas ... 9
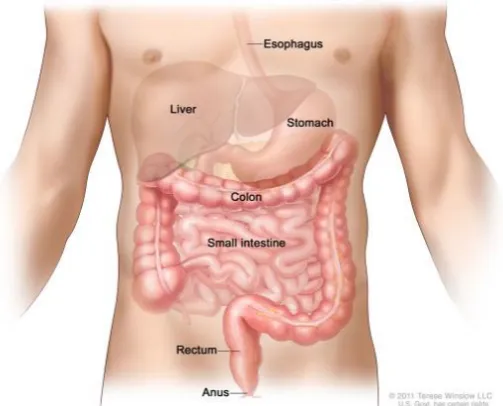
Figure 3: Anatomy of the small and large intestine ... 11
Figure 4: Stages of colon cancer ... 14
Figure 5: The derivation of the key cells involved in the innate and adaptive immune systems ... 17
Figure 6: Mechanisms of rested and activated T cells ... 19
Figure 7: CD4+ T cells subsets ... 20
Figure 8: Thymic and Peripheral generation of FoxP3+ Tregs ... 33
Figure 9: Dendritic cells induce Tr1 differentiation ... 34
Figure 10: Tregs cascade following induction of Th3 type Tregs by oral antigens or oral anti-CD3 ... 35
Figure 11: T regulatory cell markers. ... 51
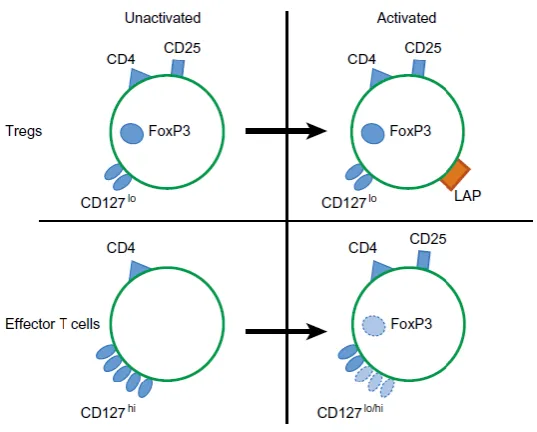
Figure 12: Expression of LAP on activated FoxP3+ Tregs. ... 56
Figure 13: Image of BD FACSVerse Flow Cytometry machine. ... 62
Figure 14: Schematic diagram of flow cytometry ...62
Figure 15: Primary system of flow cytometry ... 64
Figure 16: Gating strategy. ... 80
Figure 17: Expression level of CD4 on CD3+FoxP3+ resting T cells. ... 83
Figure 18: Expression level of CD4 on CD3+FoxP3+ activated T cells. ... 84
Figure 19: Expression of GARP and LAP on CD3+CD4+/-FoxP3+/- non-activated T cells. ... 86
xii
List of publications derived from
this work
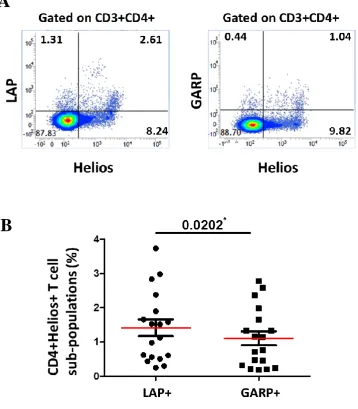
Abd Al Samid, M., Chaudhary, B., Khaled, Y. S., Ammori, B. J., & Elkord, E. (2016). Combining FoxP3 and Helios with GARP/LAP markers can identify expanded Treg subsets in cancer patients. Oncotarget, 7(12), 14083-14094.
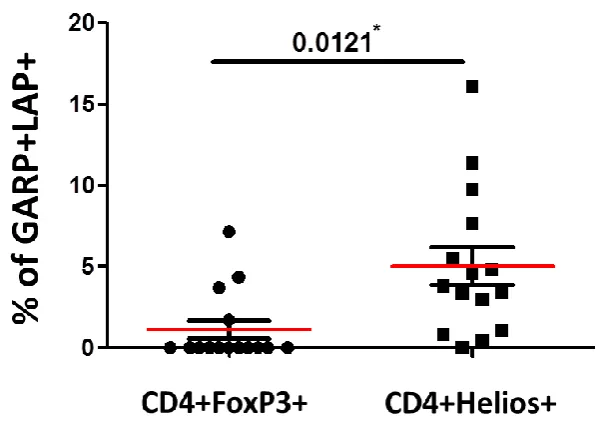
Elkord, E., Abd Al Samid, M., & Chaudhary, B. (2015). Helios, and not FoxP3, is the marker of activated Tregs expressing GARP/LAP. Oncotarget, 6(24), 20026-20036.
xiii
Declaration
xiv
Acknowledgments
xv
Dedication
This piece of work is dedicated to my wonderful parents; Mr Mohammed Abd Al Samid, the greatest dad ever, and to the best mum in the whole world, Mrs Bushra Abd Al Jabbar. To my wonderful dear husband, Mr Diyar Bazgir. To my
lovely brothers (Ahmed & Ali) and sisters (Yasmin, Marwah & Fatimah).
Finally, to my entire family specifically; mother in law (Amira), father in law (Ibrahim) and brother in law (Dana).
Our dream finally comes true.
xvi
List of Abbreviations
AIRE: Autoimmune regulator AP-1: Activator Protein-1 APC: Antigen presenting cells CD: Cluster of differentiation CP: Chronic pancreatitis CRC: Colorectal cancer
CTL: Cytotoxic T lymphocytes
CTLA-4: Cytotoxic T-lymphocyte-associated antigen-4 DCs: Dendritic cells
FoxP3: Forkhead box P3
GARP: Glycoprotein A Repetitions Predominant
GITR: glucocorticoid-induced TNFR family related gene HDs: healthy donors
IFN-γ: Interferon gamma
ICS: Intracellular cytokine staining Ig: Immunoglobulin
IL-10: Interleukin-10 IL-2: Interleukin-2
IPEX: Immunodysregulation, Polyendocrinopathy, Enteropathy, X-linked LAP: Latency-associated peptide
LI/CRCs: liver metastases from colorectal cancer LTBP: latent TGF-β binding protein
xvii miRNAs: MicroRNAs
NK: Natural killer Nrp-1: Neuropilin-1
PBMCs: Peripheral blood mononuclear cells PC: Pancreatic cancer
pTregs: peripherally-induced T regulatory cells TCR: T cell receptor
TF: Transcription Factor
TGF-β: transforming growth factor-beta Th: T helper
TNF-α: Tumour necrosis factor-α
TNFR-II: Tumour necrosis factor receptor-II Tr1: T regulatory type 1
xviii
Abstract
1
Chapter 1
2
Cancer 1.1
Cancer requires a succession of genetic changes and epigenetic events to be capable of developing (Nowell, 1976). The epigenetic changes can occur by disease state, the environment, lifestyle, age, and other factors (Deans and Maggert, 2015). The entire process of cancer development is involved in two stages: initiation, which is the genetic mutation in a single cell, and promotion, which are the successive carcinogenic events that complete the neoplastic transformation of initial mutated cell and forms multiplications of tumour cells. A later course of cancer’s further stages is the progression: when a malignant
tumour starts in any tissue and continues to grow and metastatic spread into surrounding tissues (Pitot, 1993).
3 an important etiologic role in cancer occurrence. Many cancer types are also associated with chronic inflammation and by infectious agents such as viruses (Pagano et al., 2004; de Martel and Franceschi, 2009). Patients treated with immunosuppression for tissue transplantation or another medical reason is at significant risk of developing non-Hodgkin’s lymphoma (Kinlen, 1985; Curtis et al., 1997; Dantal et al., 1998). Cancer is a genetic disease that occurs from mutations of proto-oncogenes and tumour suppressor genes or polymorphic gene activity governing enzyme systems that either activate or detoxify environmental carcinogens (Pitot, 1993). As a result of errors that occur as cells divide or because of damage to DNA caused by certain environmental exposures include substances, such as radiation (Azzam et al., 2016), the chemicals in tobacco smoke, and ultraviolet rays from the sun (Hitrik et al., 2016; Zhao et al., 2016). Cancer death is increasing widely year after year because of the increasing human populations, pollutions, and other cancer causing atmospheres (Jemal et al., 2011). Referring to several studies, expose to chemicals and radiations, or inherit germline mutations such as BRCA1 arise carcinogenic mutations (Pitot, 1993).
Most cases, early detection of cancer led to better cancer prognosis and more successful treatment. Screening for cancer is a strategy that contributes to morbidity and mortality reduction by both identifying and treating malignancy or by diagnosing invasive diseases at an early stage (Eddy, 1980). Moreover, to establish the basis staging and treatment of cancer, a biopsy of any potential cancer site should be performed in the early process.
4 with acute lymphoblastic leukaemia (ALL), lymphoma and multiple myeloma
5 Pancreatic malignant cancer
1.1.1
The pancreas function as a digestive organ that secret pancreatic juice, which contains digestive enzymes that enrich the absorption of nutrients and the digestion in the small intestine (Sherwood, 2006) (Figure 1), it consists of both exocrine and endocrine functions. The role of the endocrine is to produce chemicals and hormones, such as insulin, glucagon, somatostatin, and polypeptide to regulate the blood sugar, while exocrine compartment is to produce digestive enzymes such as amylase, protease and lipase (Imai et al., 2013; Hougaard et al., 1986).
Through gene mutations or chronic pancreatic infections, the pancreatic mechanisms can be disturbed, leading to serious pancreatic diseases including different types of pancreatic cancer (Figure 2) (Bloomston et al., 2007). Most pancreatic cancers form in exocrine cells. It is usually hard to diagnose this type of pancreatic cancer early because these tumours do not secrete hormones neither they cause signs or symptoms. For most patients with exocrine pancreatic cancer, current treatments do not cure cancer (Matracci et al., 2015). Endocrine tumours of the pancreas are rare, and it is considered being neuroendocrine neoplasms and classified as APUDomas (an endocrine tumour that arises from APUD cell). Insulinoma is the most characteristic of the pancreatic endocrine tumours, which is distributed evenly throughout the gland (Doppman et al., 1995).
6 likewise, this type of cancer is difficult to treat (Hruban et al., 2008). Eventually, the detection and treatment of early non-invasive pancreatic neoplasia have a significant role on pancreatic cancer mortality (Hruban et al., 2008). The most typical lesions of non-invasive pancreatic neoplasia are the pancreatic intraepithelial neoplasia (PanIN) (Hruban et al., 2008). The main non-inherited risk factors that cause PDAC are cigarette smoking, and it believes to be 20% of PDACs (Fuchs et al., 1996). Furthermore, 4% of patients with chronic pancreatitis are also at risk of developing PDAC after 20 years of the disease (Lowenfels et al., 1993). Likewise, approximately 30% of patients with pancreatic cancer have been associated with Diabetes Mellitus (DM) (Chari et al., 2008). Referring to Chari et al., 2008 people with DM are at high risk to develop pancreatic cancer, which suggests that new-onset DM can be cancer-related symptoms that occur shortly before the diagnosis of pancreatic cancer (Chari et al., 2008). Interestingly, a case study demonstrated that insulin-dependent diabetes is more risk of having pancreatic cancer than diabetic patients using metformin (Li et al., 2009). Further studies have proved that obesity (especially at an older age) is also a high-risk factor that is associated with pancreatic cancer development (Li et al., 2009).
7 only related to pancreatic cancer but also with a variety of cancers is the Peutz-Jeghers syndrome (PJS), which is an inherited mutation in the STK11/LKB1 gene. Patients with PJS are at very high risk of developing PDAC (Giardiello et al., 2000).
There is considerable evidence of the critical role played by the immune system in controlling the growth of malignant cells. Referring to Yamamoto et al., (2012) patients with pancreatic cancer have a relatively high level of the immunosuppressive Tregs, and it has reported that most patients with pancreatic cancer have immune destruction. Weak anti-tumour immunity leads to immunologic toleration of malignant cells and contribution to the development and progression of malignancies (Abd-Elgaliel et al., 2013). The development of pancreatic cancer could be associated with an unbalanced immune function in the human body (Abd-Elgaliel et al., 2013). However, it is still challenging to fully understand the precise mechanisms by which the immune system modulated in patients with malignant disease.
8 Figure 1: Anatomy of the pancreas.
9 Figure 2: Tumours in pancreas
Tumour cells develop in the pancreas and extend around the pancreas. The majority of pancreatic cancer is the pancreatic ductal adenocarcinoma (Source: Medicine World, 2008).
10 Liver metastases from colorectal cancer
1.1.2
Colorectal cancer commonly occurs in the large intestine and located in the appendix and rectum (Figure 3) (Deans et al., 1994; Kulke & Mayer, 1999). A study by Foiri et al. demonstrated that 63.6% of obstructive malignancy was found to be in the rectum and 36.3% in the sigmoid/rectosigmoid colon (Foiri et al., 2004). However, cancer in the small intestine does happen, but it is much rarer, and due to the rarity of the small bowel cancer, many patients do not have any symptoms until the late stage of the disease which leads to a delay in diagnosis and therapies (Masselli et al., 2009; Masselli et al., 2013).
11
[image:30.595.185.437.65.268.2]
Figure 3: Anatomy of the small and large intestine
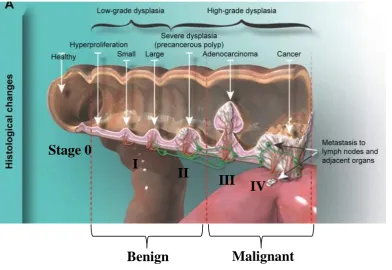
14 Figure 4: Stages of colon cancer
Colorectal cancer initiates in the colon or rectum. There are four stages of tumour size in colon cancer (Stage: I, II, III, and IV). Early stages of CRC (stage I and II) are a benign tumour that is no tendency to spread or has not spread outside the bowel yet. Adenocarcinoma is late-stage (stage III) of malignant CRC which is uncontrolled proliferation with the invasion of other tissue. In stage IV, the tumour has grown out from the colon wall to the other nearby organs (metastases). The figure is taken from (Simon, 2016).
I
II
III IV
Stage 0
15
Adaptive immune system 1.2
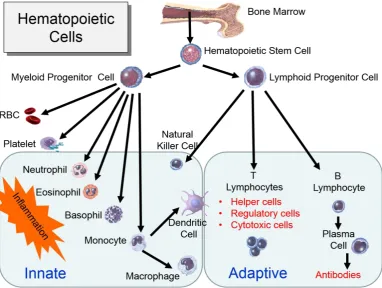
The immune system function as a defence mechanism against all types of germs and pathogens such as bacteria, viruses, fungi, and other kinds of organisms that cause diseases. The human immune system is divided into innate and adaptive immunities and is involved in both humoral and cell-mediated immunities (Mosier, 1967). The innate immune system is a non-specific, immediate immune response with no immunological memory. It consists of white blood cells known as leukocytes that differentiate and diverse to five different types that distinguished by their physical and functional characteristics; natural killer cells, basophils, mast cells, eosinophils and the phagocytic cells including macrophages, monocytes, dendritic cells and neutrophils (Abbas, 2009). The adaptive immune system is specific and provides long lasting protection because of their memory immune system, for example, memory B and T lymphocytes (Abbas, 2009) (Figure 5).
17 Figure 5: The derivation of the key cells involved in the innate and adaptive immune systems
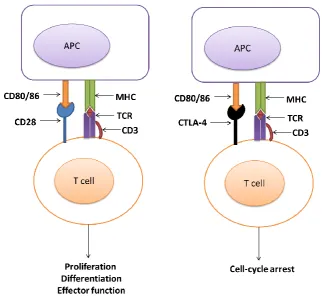
18 T cells need two signals to be activated. The first signal is when their TCR in association with CD3, a protein complex that consist of CD3γ, CD3σ, and two of CD3ε chains, generate an activation signal by binding to a peptide antigen that is
19 Figure 6: Mechanisms of rested and activated T cells
20
Figure 7: CD4+ T cells subsets
21 Introduction to T regulatory cell subsets
1.2.1
Gershon and Kondo (1970) discovered that lymphocytes could suppress T cell responses in an antigenic-specific manner. The types of T cells that can lead to an antigen-specific tolerance by attenuating T cell activity were named “suppressor cells”, and these cells are known to be a homeostatic immune-regulator (Gershon
and Kondo, 1970). Penhale et al., (1973) supported the hypothesis that under normal circumstances the thymus plays a significant role in the prevention of autoimmune reactivity. In the presence of thymus-derived lymphocytes, several cells including B cells are prohibited from reacting against the self-antigens. Tregs are phenotypically distinct from other lymphocyte populations. Although numerous T cell populations have described as possessing suppressive activity, the T cell type that is well known as a regulator cell is the CD4+FoxP3+CD25high suppressive cell (Levings et al., 2001; Kuniyasu et al., 2000).
23 Table 1: Regulatory T cells subsets and suppressive mechanisms.
Tregs subsets express a range of different phenotypes and suppressive mechanisms that can be utilised for their identification (modified from Mougiakakos et al., 2010).
Cell type
Origin Phenotype Suppressive mechanisms
References
CD4 tTregs
Thymus CD4+,
CD25+, FoxP3+, CD127-/low, CTLA-4+, LAG-3+, GITR+ Cytotoxicity, IL-10, TGF-β, some require contact with other T cells to have effects. (Sakaguchi, 2004) CD8 tTregs
Thymus CD8+,
CD25+, FoxP3+, CTLA-4+, CD122+
Some secret IL-10 or TGF-β, some require contact (Fontenot et al.. 2005a.b) Induced CD4 pTreg
periphery CD4+,CD25+, FoxP3+, CTLA-4+, GITR+ Some require contact, requires IL-2 & TGF-β (Apostolou and von Boehmer, 2004)
Tr1 periphery CD4+, CD25
-/low
, FoxP3
-/low
,
IL-10 (Groux et
al., 1997)
Th3 periphery CD4+,
CD25+, LAP+, FoxP3
-IL-10,
TGF-βHigh (Chen et al.,
24 The different suppressive mechanisms of T regulatory cells
1.2.2
Sakaguchi and his group in 1995 showed that the transfer of thymic CD25-depleted T cells induced autoimmune disease in thymic nude mice, while adding a small number of CD4+CD25+ T cells was sufficient to maintain tolerance (Sakaguchi et al., 1995). Accordingly, CD25 is expressed by “suppressive cells”
25 secreted IL-2 is taken up by them, while on the other hand, they suppress the activation and proliferation of the effector T cells (Carbone et al., 2013). In the presence of TGF-β, the majority of peripheral Tregs that generated from naïve CD4+FoxP3- T cells will express FoxP3. In addition, IL-2 signals that secreted from the other PBMCs are critical to maintaining stable pTregs and tTregs levels by driving Tregs proliferation. FoxP3+ Tregs increase their proliferation level and regulate the production level of FoxP3-Helios- T cells and Th cells (Chen et al., 2012; Sakaguchi et al., 1995; Zheng et al., 2004; Carbone et al., 2013). Tregs has been known as naturally anergic cells because of their incapacity to proliferate in response to T cells receptor ligation in vitro. However, many recent studies suggesting that a greater proliferative capacity is the thymus-derived CD4+CD25+ Tregs (Walker, 2004). Apparently, the proliferation level of CD25+ T cells is not run by the same process as that of CD25- T cells. It appears that CD25+CD4+ T cells proliferate in the presence of IL-2 secretion. Blocking of IL-2 receptor on Treg cells leads to a loss of regulatory activity, which verifies that IL-2 is necessary to activate Tregs efficiently.
26 ectopic expression leads to the gaining of a suppressor function and the induction of an incomplete regulatory phenotype in human and mice (Khatteri et al., 2003).
The FoxP3 gene encodes a transcription factor (TF) of the Forkhead box/winged helix family, and it counts as a master regulator of tTregs development and function. FoxP3 binds to specific regions of DNA to control the activity of genes that are involved in regulating the immune system (Ziegler et al., 2006).
27 observations imply that more than FoxP3 is necessary for fully explaining the regulatory phenotype.
In the human system, it shows that FoxP3 is not expressed entirely in Tregs since it has also been found in FoxP3 effector T cells, particularly in conventional CD4+ T cells upon activation (Baron et al., 2007). However, FoxP3 expression in activated conventional T cells is only transient, unlike the sustained expression of FoxP3 in naturally occurring human Tregs, which require regulation on an epigenetic level (Baron et al., 2007). This investigation progress has led to a significant number of researchers being interested in investigating the function and the complexity of Tregs in different types of diseases including cancer.
28 et al., 2002). However, further investigation showed that CD4+CD25+ Tregs could expand, even without exogenous IL-2, when DCs are used as APCs (Yamazaki et al., 2013; Sakaguchi, 2004).
TGF-β is a homodimeric protein that is synthesised and secreted by many different cell types, including CD4+ Tregs. TGF-β is a cytokine that inhibits the proliferation and the effector function of T cells and the activation of macrophages (Tanchot et al., 2012); these inhibitory actions control the immune and the inflammatory responses (Abbas, 2009). Liu et al., (2007) have shown that proliferation of T cells and uncontrolled inflammation develops in mice when the gene encoding TGF-β is knocked out, or in which signalling is encoding TGF-β blocked. i.e. TGF-β signalling is critical to the thymic development of natural CD4+CD25+FoxP3+ Tregs and IL-2 is a principal driving force promoting the proliferation of natural CD4+CD25+FoxP3+ thymocytes that appear in the absence of TGF-β signalling (Liu and Wrong, 2007).
Thymus-derived naturally occurring T regulatory cells 1.2.3
29 The CD4+CD25+FoxP3+ tTregs possess a potent suppressive activity against both naïve and memory CD4+ and CD8+ T cell activation, proliferation and function (Levings et al., 2001; Piccirillo and Shevach, 2001). A previous study by Lim et al., (2005) reported that without the need to first suppress Th cells, Tregs could also directly suppress B cell response. FoxP3+ tTregs can directly suppress B cell immunoglobulin (Ig) response, partly mediated by TGF-β secretion. This direct suppression of the Ig production by tTregs is followed by inhibition of Ig class switch recombination (Lim et al., 2005; Nakamura et al., 2004).
Furthermore, tTregs that express the membrane-bound TGF-β are also able to directly inhibit the effector function of natural killer cells as well as the function and maturation of DCs (Azuma et al., 2003; Ghiringhelli et al ., 2005a; Misra et al., 2004). The mechanism behind T cell suppression, in vitro, appears to be IL-10 and TGF-β independent and does not require the presence of APCs but it requires cell contact between Tregs and responder T cells (Tiemessen et al., 2007). On the other hand, to inhibit T cell activation in vivo, in the presence of IL-10 and TGF-β, Tregs can form direct interactions with DCs in the lymph nodes. In this
30 Peripherally-induced T regulatory cells
1.2.4
31 production and cell cycle progression. Therefore, CTLA-4 co-stimulation is necessary for generating phenotypically and functionally similar adaptive CD4+CD25+ suppressor cells (Zheng et al., 2006). Peripheral naïve CD4+CD25 -FoxP3- T cells range from T regulatory 1 (Tr1) and T helper 3 (Th3) cells. Tr1 secret IL-10 and TGF-β (Groux et al., 1997) and are induced by the anti-inflammatory cytokine IL-10 (Roncarolo et al., 2006) to suppress immune and autoimmune responses (Groux et al., 1997). Another cytokine that identified as one of the important cytokines that promote the generation of Tr1 cells is the Interleukin-27 (IL-27), which is a member of the IL-12 heterodimeric cytokine family and it is also known as effector Th17 suppressor cytokine (Pot et al., 2011). Tolerogenic DCs conditioned in vitro or in vivo by FoxP3+ Tregs secrete IL-27 that was initially described as a pro-inflammatory cytokine that induces proliferation of naïve CD4+ T cells to induce Th1 cells responses (Takeda et al., 2003; Pflanz et al., 2002; Chen et al., 2000). Furthermore, during Tr1 differentiation, IL-27 induces the expression of Granzyme-B, which is a serine protease that through the Granzyme-B-mediated lysis, in a contact-dependent manner, Tr1 cells suppress the effector T cells responses (Pot et al., 2011) (Figure 9).
33
Figure 8: Thymic and Peripheral generation of FoxP3+ Tregs
34 Figure 9: Dendritic cells induce Tr1 differentiation
35 Figure 10: Tregs cascade following induction of Th3 type Tregs by oral antigens or oral anti-CD3
36 The difficulty in distinguishing tTregs from pTregs
1.2.5
Although numerous of molecules including CD28, TNFR, PD-1, and Toll-like receptors (TLRs) expressed on the surface of Tregs, these markers are not helpful in distinguishing tTregs from pTregs. Based on tTregs and pTregs similar surface markers it is hard to discriminate these two cell populations openly. Therefore, many studies tried to separate tTregs from pTregs based on molecular biology approaches instead. For example, a study by Floess et al. demonstrated that tTregs exhibit a completely demethylated FoxP3 locus, while pTregs despite their high FoxP3 expression display an incomplete DNA demethylation that is associated with unstable regulatory T cell phenotype (Floess et al., 2007). There is lots of lineage plasticity develops in these Treg subpopulations. For that reason, other studies suggesting that understanding the differentiation mechanisms of tTregs and pTregs will determine these cells commitment to lineage and plasticity towards other phenotypes (Komatsu et al., 2009; Povoleri et al., 2013).
37 repertoire of pTreg and tTreg cells, the study demonstrated that Tregs expressed a variable level of Helios and Nrp-1 both in tTreg and pTreg and therefore it could not support the nature differentiation of tTreg and pTreg.
Another finding that supports Szurek studies is by Gottschalk et al., 2012 which also demonstrated that Helios expression could be in pTregs both in vivo and in-vitro. Accordingly, in vitro, Helios expression in pTreg was dependent on the presence of APCs.
An additional study using human experiments indicated that ∼30–40% of naïve Foxp3+ Tregs in the peripheral blood were found to be Helios−. This data represent that tTregs could be Helios− and the absent of Helios is not a reliable marker for pTregs (Himmel et al., 2013).
38 has also demonstrated that high GARP expression can distinguish Tregs from Th17 lineage (Wang et al., 2009). Of note, further studies have proved that iTregs are not capable of expressing GARP or LAP (Tran, 2012). A study by Zhou et al. illustrated that forced expression of GARP on all T cells in GARP-transgenic mice caused a decrease in Tregs level in the thymus and periphery (Zhou et al., 2013). The cytokine TGF-β is important for inducing Th17 and pTreg, while the lack of GARP expression on Tregs surface did not compromise their suppressive function. However, IL-1 receptors are better expressed on activated Tregs but not on pTregs (Tran et al., 2009; Mercer et al., 2010). Another interesting study demonstrated that contrary to the human studies, mouse iTreg and pTreg could express GARP (Edward et al., 2013).
CD8+ T regulatory cells
1.2.6
39 markers indicate only the activation and the memory state and not the regulatory function of CD8+ T cells.
An interesting marker for detecting the alloantigen-Induced CD8+ Tregs is the CD103 (Uss et al., 2006). Few studies have documented the expression of CD103 on CD4+ Tregs, but approximately 4% of circulating CD8+ T cells expresses the CD103 (Uss et al., 2006). The αEβ7 integrin CD103 are expressed in both murine
40 Referring to the same study, Kim et al., (2015) have further analysed Helios deficiency on CD8+ Treg responses. The study reported that Helios-deficient CD8+ Tregs failed to suppress the T follicular helper cells, and it is also developed an unstable phenotype during inflammatory responses resulted in reduced FoxP3 expression and increased effector cytokine expression, including IFN-γ, IL-17, and TNF-α.
41
Transplantation tolerance and the Immunosuppressive Drugs 1.3
43 B cells have also been studied for the transplantation tolerance, and several studies demonstrated that the mechanism of B cells plays a prominent role in the induction of B cell tolerance and the antibodies can use as therapies for treating antibody-mediated graft rejection (Nicole and Turgeon, 2010).
Several experiments have confirmed Tregs role in peripheral tolerance and cancer. Achieving balance between transplantation tolerance and cancer is important. Therefore, Tregs therapy in allograft addresses multiple issues such as, the number of Tregs and their efficacy are important to obtain a therapeutic effect (Savage et al., 2013; Hanahan and Weinberg, 2011), the specificity of the antigen is necessary for effective control of rejection, a control of Tregs function and effector T cell/Treg ratios combination is a good strategy to target cancer and target specific Treg subsets to prevent tumour (Elkord et al., 2011).
44
T regulatory cells in cancer 1.4
CD4+FoxP3+ Tregs control many facets of the immune response reaching from autoimmune disorders to inflammatory diseases and cancer in an attempt to maintain immune homeostasis (Adeegbe and Nishikawa, 2013). Tregs suppressive activity is beneficial by limiting the T cell response against self-antigens to prevent autoimmune diseases and allergies. Considerable progress has made in understanding the phenotype, function, and mechanism of action of Tregs, and various subclasses of these cells have been defined (Adeegbe and Nishikawa, 2013). However, their inhibitory roles in curtailing immune response against pseudo-self-antigens as in tumours often culminate into negative outcomes (Adeegbe and Nishikawa, 2013). There are plenty of studies highlighting the elevated levels of Tregs in the tumour and/or in the circulation in human cancer patients (Whiteside et al., 2012) and it often correlates with poor antitumour effector response and enhanced tumour immunity (Elkord et al., 2010; Nishikawa and Sakaguchi, 2010). During persistent tumour burden and poor antitumour effector response, an accumulation of Tregs occurs at peripheral sites (spleen, peripheral blood) and in the local tumour microenvironment (Elkord et al., 2010; Nishikawa and Sakaguchi, 2010). Since Tregs increased in the peripheral blood and the tumour tissue of cancer patients, there are several lines of evidence suggesting that these tumour-infiltrating Tregs must play a significant role in dampening anti-tumour immunity (Adeegbe and Nishikawa, 2013).
45 enhance the reaction to autoimmunity, regulate the recruitment or reduced death (Zou et al., 2006). These many factors that tumour cells can secrete are induced Tregs and attract them locally (Zou, 2006). In vitro, there are several soluble or contact-dependent tumour factors contributing to Treg generation including cyclooxyhenase-2, CD70, Gall, TGF-β, and yet-to-be-identified factors (Bergman et al., 2007; Yang et al., 2007; Juszczynski et al., 2007; Liu et al., 2007; Li et al., 2007; Curti et al., 2007). These tumour micro-environmental factors are a reason for increased level of Tregs and improved their function. Not to mention, enhanced Tregs proliferation or reduced their apoptosis is an additional mechanism that could increase Tregs in the tumour. For instance, with the contribution of the indoleamine 2,3-dioxygenase enzyme, the plasmacytoid dendritic cells from mouse tumour-draining lymph node can directly activate Tregs (Sharma et al., 2007). Since the suppression by indoleamine 2,3-dioxygenase-activated Tregs requires the PD-1 ligand pathway, Tregs that have PD-1 suppressive mechanism various from Tregs that activates without indoleamine 2,3-dioxygenase (Sharma et al., 2007). Further functions of Tregs that assist tumour cells to survive are that Tregs not only induce macrophages to express inhibitory B7-H4 on its surface, which is a protein that negatively regulates T cell immunity (Sica et al., 2003) but also secretes IL-6 and IL-10 to demonstrate dysfunctional immune cell cross-talk (Kryczek et al., 2006).
47 Depletion of Tregs to improve the treatments of cancer
1.4.1
The type of cancer treatment depends on the kind of cancer that the patients have and how advanced it is because there are many types of cancer treatment. Metastatic cancer may be treated with local therapy (surgery, radiation therapy), systemic therapy (chemotherapy, biological therapy, targeted therapy, hormonal therapy, immunotherapy), or a combination of them. Some people with cancer will have only one treatment, but most people have a combination of treatments. The decision of therapy depends on the type of primary cancer, the size and location, metastatic tumours, the patient’s general health and age, and the types of treatment the patient have had in the past.
It has reported that by decreasing Tregs level in cancer patients, the efficacy of therapeutic vaccination for cancer could enhance. The vaccine induces antigen-specific effector cells and Tregs are also antigen-antigen-specific cells. For example, a cervical cancer vaccine induces CD4+CD25+FoxP3+ in human, but their function and specify were not assessed (Welters et al., 2008). To generate antigen-specific effector cells while limiting the generation of antigen-specific Tregs is critical to optimal immunotherapy strategies. Further similar strategies, including CD137 sFv-expression tumour cells (Yang et al., 2007), CD40 agonists plus Toll-like receptor activation (Ahonen et al., 2008), a liposomal vaccine (Chen et al., 2008), and specific dendritic cells (Palucka et al., 2007), have been also tested in several groups.
48 rate-limiting extracellular molecules, they are excellent targets for the products of the biotechnology industry, such as monoclonal antibodies and antibody-like receptor: Fc fusion proteins. The first big success of anti-cytokine therapy in the form of TNF-α blockade demonstrated in the autoimmune disease Rheumatoid Arthritis (RA). Blocking this single cytokine has marked beneficial efforts on all aspects of disease activity and can prevent further joint destruction (Elliott, 1993; Feldmann, 2001). Furthermore, in the control of leukemic cell growth, Smith and Griffin explore the role of cytokines and cytokine receptors (Smith and Griffin, 2008) chronologically. Previous observation and studies emerged assays for T cell growth factors (Gillis et al., 1978), the identification of its receptor, the purification of protein with growth factor activity, and the production of an antibody specific for the receptor (Leonard et al., 1982). These methods helped provide a new framework for lymphocyte growth as a response to antigen-induced growth factor release (Smith et al., 1980). In a mouse sarcoma model, Flt3-L and GM-CSF induced dysfunctional FoxP3+ cells (Berhanu et al., 2007). Tregs decrease the advantages of IL-12 gene therapy in a mouse model of hepatocellular carcinoma (Zabala et al., 2007). Systemic IL-2 change Tregs trafficking molecules and may enhance their accumulation in ovarian malignancies in humans (Wei et al., 2007).
49 Reducing Treg function is a logical therapeutic strategy given the large body of evidence suggesting that elevated Tregs are detrimental in cancer. Tregs arise and function in cancer as depletion; blocking differentiation, trafficking or effector functions; or raising effector cell suppression threshold (Ruter et al., 2007). Depleting Tregs is useful to consider managing Tregs, as strategies aside from elimination are also effective, and depletion might foster rapid Treg regeneration (Colombo and Piconese, 2007). Anti-CD25 antibody remains the prototypical reagent for depleting Tregs in mouse models. Denileukin diftitox is a combination of IL-2 and diphtheria toxin; this active drug is also called (Ontak). The cell dies, when Ontak binds to the IL-2 receptors on the cell surface, diphtheria toxin will release and enter into the cells that express IL-2 receptors. This drug mostly targets leukaemia’s and lymphomas cancer cells because some of these cells express these receptors (Litzinger et al., 2007). Also, cyclophosphamide depletes Tregs and improves the efficacy of a dendritic cell vaccine in mouse models for melanoma or colon carcinoma (Liu et al., 2007). Vaccines against FoxP3 improved tumour immunity in a model of renal cell carcinoma (Nair et al., 2007). LMB-2 is another drug that reduces Tregs in cancer patients. It is a CD25-directed Pseudomonas immunotoxin (Powell et al., 2007).
50 blood, but the tumour specific CD8+ T cell did not increase, and phenotypic Tregs rebounded quickly, even though their function was not precisely determined (O’Mahony et al., 2007). Furthermore, multiple mechanisms can be used to block
51
Different markers for T regulatory cells 1.5
Figure 11: T regulatory cell markers.
Tregs express a range of markers that can be utilised for their identification, as summarised in the figure. (i) Surface markers are useful for isolating viable cells and also offer the most accessible target for immunotherapies. (ii) Intracellular
markers, such as FoxP3 and Helios. (iii) Chemokine receptors are crucial for
52 Neuropilin-1
1.5.1
One of the specific markers for Tregs is the multifunctional transmembrane protein, Neuropilin-1 (Nrp-1/CD304). Nrp-1 together with plexin acts as a co-receptor for Class III semaphotins which is involved in controlling neuronal axon development and in modulating immune functions (Glinka & Prud’homme,
2008). A study by Bruder et al. showed that the expression of Nrp-1 was exclusively upregulated on murine Tregs but down-regulated on other T cell subsets. Nrp-1 expression correlated with FoxP3 expression throughout Tregs development from the selection of naïve thymocytes to Treg maturation. Both in vivo and in-vitro generated Nrp-1 Tregs showed increased immunosuppressive efficacy in vitro suppression assays (Bruder et al., 2004). Nrp-1 is also expressed on endothelial and tumour cells, correlating with increased tumour vasculature and progression (Bruder et al., 2004).
53 studies by Weiss et al., (2012), demonstrated that in vitro, the Nrp-1 expression is driven by TGF-β secretion while IL-6 inhibits TGF-β induced Nrp-1. In conclusion, Nrp-1 is a stable specific marker for murine tTregs, but it is not expressed consistently on human Tregs and cannot consider as a reliable marker of human tTregs.
54 population and Tregs, migrate into tumour site to expand in situ via some mechanisms.
GARP and LAP 1.5.2
LAP is a propeptide that is non-covalently associated with the amino-terminal domain of TGF-β, creating a latent complex that can associate with latent TGF-β binding protein (LTBP) to produce a large latent form (Tran et al., 2009). Human Tregs and several other cell types including Th clones secrete latent TGF-β. LAP prevents mature TGF- β from binding to its receptor, and hence from transducing a signal (Stockis et al., 2009a). TGF-β activation occurs when mature TGF-β is cleaved from LAP (Stockis et al., 2009b). Upon TCR stimulation, LAP bind to GARP on the surface of human Tregs, and produce the active TGF-β cytokine (Stockis et al., 2009b). Oida and colleagues (2003) identified a population of CD4+CD25-LAP+ T cells in the spleen (Oida et al., 2003), and another study identified CD4+LAP+ Tregs in the blood of humans that do not express FoxP3 but express the activation marker CD69, a human transmembrane C-type lectin protein that is expressed on activated NK and T cells (Ghandi et al., 2010). Other studies have found that TGF-β may induce surface LAP expression on CD4+ cells independently of FoxP3 induction (Oida and Weiner, 2010b).
55 large proportion of these mice develop spontaneous isolated optic neuritis), by inducing FoxP3 and by inhibiting IL-17 production (Chen et al., 2008).
56
Figure 12: Expression of LAP on activated FoxP3+ Tregs.
57 Glucocorticoid-induced tumour necrosis factor receptor (GITR)
1.5.3
GITR is also known as (TNFRSF18), cloned from a murine T cell hybridoma (Nocentini et al., 1997). GITR is a member of the TNF-receptor superfamily and has been implied as a costimulatory receptor on T cells. The removal of GITR expressing cells by treatment with anti-GITR monoclonal antibodies developed the organ-specific autoimmune disease (Shimizu et al., 2002).
58 Identification of T regulatory cells by Helios
1.5.4
Helios is a member of the Ikaros transcription factor family that has been described to be a part of Tregs genetic signature (Hill et al., 2007; Sugimoto et al., 2006). Ikaros proteins were found to be components of highly stable complexes. Helios is a p70 gene that contains four N-terminal zinc finger DNA-binding domains, as well as two C-terminal zinc fingers that show considerable homology to those within Ikaros family proteins (Halm et al., 1998).One study revealed that essentially all thymic Tregs were Helios+, but only about 70% of the peripheral Tregs were capable of expressing Helios (Thornton et al., 2010). In vitro and in vivo-generated pTregs failed to express Helios and therefore Thornton et al. (2010) published that Helios expression in murine and human Tregs could distinguish tTregs from pTregs (Thornton et al., 2010). In support of this, several studies in tumour-bearing mice and human cancers have demonstrated the expansion of tumour-infiltrating Tregs on Helios expression. Accordingly, some studies agreed that the Tregs within the tumours are most likely tTregs due to their expression of Helios (Elkord et al., 2011; Redjimi et al., 2012; Wainwright et al., 2011). Another study reported that the majority of tumour-infiltrating Tregs in a murine colon adenocarcinoma expressed low levels of Helios, and based on some additional markers the authors concluded that these were likely to be pTregs (Weiss et al., 2012). However, all these observations only support the possibility that the expression of Helios on tumour-infiltrating Tregs may class as a tTreg marker, but this transcription factor may not necessarily be an indication that they are derivatives of tTregs.
59 2012). Therefore, so far the expression of Helios is not a sufficiently reliable marker that distinguishes the origin of tumour-Tregs and it is crucial to understand its full subsets and functions.
Recently, a study by Baine and Basu reported that Helios regulates IL-2 production in Tregs by suppressing IL-2 gene transcription. The results of this study indicated that Helios is necessary for the suppression of IL-2 production in Tregs because Helios binds to the IL-2 promoter to maintain it in a deacetylated state and makes it transcriptionally inactive (Baine et al., 2013). Furthermore, referring to the same study both Helios and FoxP3 cooperate to enforce silencing of IL-2 transcription in Tregs, indicating that Helios regulates FoxP3 binding to the IL-2 promoter. Moreover, loss of Helios in Tregs results in activation of the IL-2 locus; allows Tregs to produce IL-2 upon re-stimulation and loses their anergic phenotype. In the absence of exogenous IL-2, resting Tregs failed to proliferate and died, while knockdown of Helios expression provided Tregs to remain and reproduce (Baine et al., 2013).
61 Ki-67 antigen marker
1.5.5
62
Flow cytometry 1.6
The data analysed on FACSVerse Flow cytometric BD Bioscience, USA with BD FACSuite software. The analyses were performed by gating lymphocytes with six-colour staining, and the acquisition run at 100,000 events.
Flow cytometry is a laser-based technology that simultaneously measures and then analyse multiple physical characteristics of different particles, mainly cells, as they flow in a fluid stream through a beam of light. This technology employed in cell counting, cell sorting, biomarker detection and protein engineering. These characteristics are determined using an optical-to-electronic coupling system that records how the cell or particle scatters incident laser light and emits fluorescence (Barsky et al., 2016).
63 Flow cytometry functional assay
1.6.1
Flow cytometry is a laser-based technique that used to count and analyse the size and shape of cells or particles. It consists of lasers, fluidic system, the optical system, electronics, and a computer. These components work as a backbone for the flow cytometer. The fluid cells in the fluidic system contain liquid stream or sheath fluids that help to carry a line or cells to pass in a single file through the light to the integration point. The fluidic system does also take away the waste. The laser provides a single wavelength that passes through the cells to scan and detects the cells. The optical system consists of several minors that deflect the lights to be detected by certain detectors to convert the analog signal into a digital signal, and there is an amplification system that amplifies that signal, and a computer for analysis of the signal (Shapiro, 2003).
The samples transported to the interrogation point for accurate data collection and it is important that particles or cells are passed to the laser beam one at a time. Most flow cytometers accomplish these by injection the samples that containing cells into a fluid stream of sheath fluid. The flow cytometry works when the beam of light of a single wavelength directed on to a hydrodynamic focus stream of liquid containing a single file of cells achieved by the sheath fluid. The hydrodynamic focusing is when sample stream becomes compress to roughly one cell in diameter. In fact, the flow cytometry can accommodate cells that spend approximately three orders of magnitude in size. In most cases, the cytometer detects cells between 1.0 and 15.0 µm in diameter, but it is possible to detect particles outside this range (Shapiro, 2003).
64 scattered in varies directions. The scattering in the direction of the beam is the forward scattering and the once that perpendicularly to the beam are called side scattering. Each suspended cells that pass through the beam scatter the ray and the fluorescence chemical that establishes in the particular or attached to the cells meet the light at a longer wavelength. This combination of scattering and fluorescent light is picked up by the detectors. Each detector analyses the fluctuation in brightness to drive various information about the physical and chemical structure of the cells. The forward scatter correlates to the cell volume, whereas the side scatters correlates to the inner complexity of the particular such as the shape of the nucleus, the amount type of side plasmid granules or membrane roughness (Shapiro, 2003).
Figure 15: Primary system of flow cytometry (Source: Semrock, (n.d.))
Fluidic System Optical System
Beam of light
65
Hypothesis 1.7
The hypothesis of this research is that the Treg level increases more in cancer patients as compared to patients with chronic pancreatitis and healthy individuals. Also, GARP and LAP are more highly expressed by CD4+CD3+FoxP3+Helios+ Tregs as compared to CD4+CD3+FoxP3-Helios- Tregs, speculating that the main key for targeting FoxP3+Helios+ suppressive Tregs is by the novel markers GARP and LAP.
Objective 1.8
Given the overwhelming evidence, this study is both justified and timely. The aim of this study is to examine the different suppressive factors and phenotypes of T regulatory cells (Tregs). Also, to compare the levels of Tregs in malignant pancreatic cancer and liver metastases from colorectal cancer with controls, by investigating the levels of various Tregs specific and novel markers such as GARP and LAP that are expressed on the surface of activated human FoxP3+ Tregs. The purpose of this study is to identify which of FoxP3 (+/-) Helios (+/-) Tregs express GARP and LAP significantly and to investigate if these receptors are vital markers for activated conventional Tregs.
66
Chapter 2
67
Blood samples 2.1
These studies approved by the UK National Research Ethical Committee, Salford Research Ethics Committee and the Local Research and Development Departments. Written consents obtained from all patients and healthy donors before blood collection. Whole blood samples were collected from patients with chronic pancreatitis, malignant pancreatic cancer and liver metastases from colorectal cancer at the Department of General Surgery at North General Manchester Hospital, UK. Also, blood samples that used as controls were either collected from healthy donors or obtained from UK National Blood Service. The ethics were approved by the University of Salford Research Ethics Committee and Northwest Centre for Research Ethics Committee (NREC), North Manchester General Hospital (NMGH) and Salford Royal Hospital (SRH).
68 Table 2 below demonstrate the characteristic features of study subpopulations that are suffering from different cancer types. Whole blood was taken from twenty patients with pancreatic cancer. Their ages were between 47 to 87 years old, and the majority of these patients were males. 75% of PC patients were in stage IV, 20% were in stage II while only 5% was in stage I of tumour malignancy.
Furthermore, whole blood was collected from eleven colorectal cancer patients. Their ages were between 71 to 83 years old, and 73% were male while only 27% were female. Only one was suffering from stage I while five were suffering from stage II and another five were suffering from stage III of tumour malignancy. No one was in stage IV of tumour malignancy.
69 Table 2: A study of the characteristic features of the subpopulations
PC (pancreatic cancer), CP (chronic pancreatitis), CRC (colorectal) CA19-9 (cancer antigen 19-9), CEA (carcinoembryonic antigen), *Data shown represent median (range).
PC CP CRC
Number n=20 n=9 n=11
Age (median) 62 (47-87)* 54 (31-84)* 73(71-83)*
Gender (Male: Female) 13:07 05:04 08:03
TNM stage
I 0 - 1
II 4 - 5
III 1 - 5
IV 15 - -
Tumour size (cm) 2.9 (1.9-5.5)* 4.2(1-13)*
Preoperative CA19-9 (0-37 U/ml)
371 (77-1230)* 49 63.9 (1169)*
Preoperative CEA (<2.5 ng/ml)
5 (5-13)* - 29.5(1-144)*
Tumour site
Head of pancreas 18 - Right
sided
7
Body of pancreas 0 - Left
sided
3
Tail of pancreas 2 - Others 1
Histological grade
Well/moderate 9 - 11
70
Reagents and antibodies 2.2
The medium used was Roswell Park Memorial Institute-1640 (Sigma, Dorset, UK).
Pre-warmed 5% complete medium was prepared from 500 ml of RPMI-1640 supplemented with 10% of heat-inactivated foetal calf serum (Thermo Scientific, UK), 1% L-glutamine 200 mM (Sigma-Aldrich, UK) and 1% of antibiotics that are based on 100 μg/ml of streptomycin and 100 U/ml of penicillin, (Live
Technologies, UK). A freezing medium that was prepared from 50% foetal calf serum, 40% RPMI-1640 and 10% dimethylsulfoxide (DMSO) (Sigma-Aldrich, UK) was used to freeze the tumour cell lines and the PBMCs,
IgG from human serum (10 µg/ml, Sigma-Aldrich, UK) were used to block the FcR on the surface of the cells to limit the non-specific binding. Normal rat serum (0.5 µg/ml, eBioscience, UK) and mouse serum (Sigma-Aldrich, UK) used for blocking the non-specific binding.
71 Table 3: Antibodies
Antibodies used for coating and activation:
Anti-human CD3 functional grade purified, clone HIT3a (2 µg/ml, eBioscience, UK)
Anti-human CD28 functional grade purified, clone CD28.2 (2 µg/ml, eBioscience, UK)
The monoclonal antibodies that used for T regulatory cells
surface staining:
Mouse anti-human CD4-PerCP-Cy5.5 antibodies (clone RPA-T4, 0.5µg/ml, eBioscience, UK)
Mouse anti-human CD3-APC-H7 antibodies (clone SK7, 0.5µg/ml, BD Bioscience, UK)
Mouse anti-human GARP-APC antibodies (Clone 7B11, 0.5µg/ml, BD Bioscience, UK)
Mouse anti-human LAP-PE antibodies (Clone TW4-2F8, 0.5µg/ml, BD Pharmingen, UK)
The monoclonal antibodies used for T regulatory cells
intracellular staining were:
Armenian hamster anti-mouse/human Helios-FITC (2µg/ml, 22F6 Clone, Biolegend, Cambridge, UK)
Rat anti-human FoxP3-PE-Cy7 (clone PCH101, 0.5µg/ml, eBioscience, UK)
Mouse anti-human IL-10-FITC (clone BT-10, 0.5µg/ml, eBioscience, UK)
Mouse anti-human IFNγ-PE-Cy7 (clone 4S.B3, 0.5µg/ml, BD Pharmingen, BD Biosciences, UK)
Rat anti-human IL-2-PE-Cy7 (0.5µg/ml, eBioscience, San Diego, CA)
Rat anti-human IL-10-APC (0.5 µg/ml, BD Pharmingen, BD Biosciences, UK)
72
Blood isolation 2.3
After blood collection from the donors, 20 ml of the blood was slowly layered over 20 ml of Ficoll-Hypaque (Sigma-Aldrich, UK) solution in a universal tube. Ficoll-Hypaque is a hydrophilic polysaccharide which dissolves in solutions, and it is used to separate whole blood components by their variant density. The tube was sealed and centrifuged (3000 RPM, 30 min at room temperature) with no brake. After centrifugation, the plasma was collected and transferred to another universal tube and centrifuged (3000 RPM, 10 min) to remove any cells and platelets, and then was kept in aliquots of 1 ml and stored at -80°C for further analysis. Subsequently, the mononuclear lymphocyte cell layer was transferred to a new universal tube and was washed with RPMI complete medium and centrifuged twice at 1500 RPM for 5 minutes. The cell pellet was re-suspended in 2 ml of RPMI complete medium and counted manually with trypan-blue dye; 1 part of cells was mixed with 1 part of trypan blue and was applied in a Disposal Haemocytometer (C-Chip, DHC-N01, Digital Bio) and placed under a light microscope. Trypan blue is a vital stain that is incorporated in dead cells and introduces a blue colour, while the live cells with intact cell membranes are not coloured. For counting cell numbers it was required to obtain the total number of viable (unstained) cells per ml of the aliquot.
Cells were counted by using the following formula: PBMC/mL = number of
PBMCs counted (average count per 4 squares) X dilution factor X 104 (slide
depth and dilution factor).
73 container containing isopropanol (Cryo1C ‘‘Mr. Frosty’’ USA) and placed at
74
Extracellular and Intracellular Staining 2.4
Characterisation of Tregs that express CD3, CD4, GARP, LAP, FoxP3, and Helios:
For cell activation, non-treated, 24 well plates coated with a combination of 2 µg/ml anti-human CD3 antibodies, 2 µg/ml anti-CD28 antibodies, and 1 ml of bicarbonate buffer (pH 9.6). At 37oC in 5% CO2 incubator, the plate incubated for
anti-75 human FoxP3-PE-Cy7 and 4 µl of Armenian hamster anti-mouse/ human Helios-FITC added to the tubes as intracellular markers for Tregs. The cells were incubated at 4oC in the dark for 30 minutes, which later on was washed twice with permeabilisation buffer. The cells were then suspended in 300 µl of flow cytometry staining buffer and analysed with BD FACSVerse Flow Cytometry machine.
For intracellular cytokines staining:
76 The steps of ICS are as follows:
As previously described, 24-well plates were coated with anti-human CD3 and anti-human CD28 functional grade purified antibodies for 2.5 hours in the 37 oC, CO2 incubator. Cells were then added to the coated wells for activation, after
18-20 hours incubation, 1 µg/ml of the protein transport inhibitor (Golgi Plug) (BD Biosciences) was added to 1 x 10⁶ cells and placed back to the incubator for 4 hours incubation. In response to the antigen stimulation, the activated T cells secrete cytokines. Golgi Plug blocks the intracellular protein transport process and allows the cytokines production level to accumulate, which then increases the ability to detect, measure, and analyse the cytokines with the flow cytometry.
After 4 hours incubation the cells were stained with the same surface antibodies (Mouse anti-human CD4-PerCP-Cy5.5, mouse anti-human CD3-APC-H7, mouse anti-human GARP-APC, mouse anti-human LAP-PE), washed with PBS and fixation/ permeabilisation buffer was added for 45 minutes, washed twice with permeabilisation buffer and added the mouse and rat serum and incubated for 15 minutes. For the intracellular staining, after blocking with serum 1.5 µl of
IL-10-FITC, and 1.5 µl of IFNγ-PE-Cy7 or 1.5 µl of IL-2-PE-Cy7 were added and
incubated for 30 minutes in 4oC. After the incubation, to keep the cells permeabilised, the cells were washed twice with the permeabilisation buffer and were analysed by flow cytometry.
Characterisation of cytokines secreted from CD3+CD4+FoxP3+Helios+ Tregs:
77 minutes. 1 µg/ml of IgG (100 ug/ml, Sigma) added to each tube, which then incubated at room temperature for 15 minutes. Cells were stained with 1.5 µl of
CD3-APC-H7 and CD4-PerCp-5.5 and were incubated at 4oC in the dark for 25
minutes. Cells in the FACS tubes were then washed with 2 ml of cold PBS and centrifuged at 1500 RPM for 5 minutes. The supernatant then removed, and 0.5 ml of freshly prepared BD Fix/Perm buffer added, and the tubes were incubated at 4oC in the dark for 45 minutes. The cells were then washed twice with 1 ml permeabiliastion buffer, and 2 µg/ml of normal mouse serum (Sigma-Aldrich) and 1 µg/ml of normal rat serum (eBioscience) was added to the cells, mixed, and incubated for 15 minutes at room temperature.
For the intracellular staining, without washing the cells, they were stained with 4 µl of FoxP3-PE and Helios-FITC, and 1.5 µl of IL-10-APC and IFNγ-PE-Cy7
78
Statistical methods 2.5
Comparisons of various lymphocyte subsets were made by using Microsoft Excel, and the correlation analyses were calculated using PRISM 5.0 (GraphPad Software) (Table 4). Paired T-test was used to compare different sub-populations between the same group and unpaired T-test was used to compare different groups between the same sub-populations. P value ≤0.05 was considered statistically significant. The data are presented as means ± SEM.
Likewise, analysis of variance (ANOVA) test was used to determine multiple comparisons. Both unpaired T-test and ANOVA test gave similar results in term of being significant differences or not.
The Mean, Standard Deviation and Standard Error of the Mean (SEM) were calculated with both Normality and Shapiro-Wilk normality test.
Table 4: The scheme that PRISM uses to report the P values
P value
Wording
Summary
< 0.0001 Extremely
significant
****
0.0001 to 0.001
Extremely significant
***
0.001 to 0.01 Very significant **
0.01 to 0.05 Significant *
79
Gating strategy 2.6
The blood samples tested were from twenty healthy donors, twenty pancreatic cancer patients, nine chronic pancreatitis patients, and eleven chronic liver metastatic cancer patients.
Because these four groups are not equally in numbers it is important to use Standard Error of the Mean to show the reliability of the mean. Interpret data when the values are plotted as error bars on a graph.
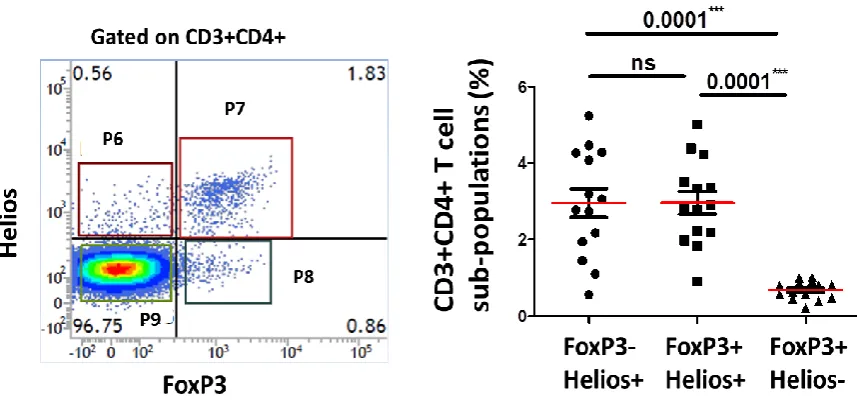
80 Figure 16: Gating strategy.
A representative example of activated healthy donor flow cytometric plots.
This figure shows the gating strategy to define lymphocytes based on forward and side scatter characteristics (plot 1), CD3+ T cells against side scatter (plot 2), CD3+CD4+ T cells (plot 3) and CD3+CD4- (CD8+) T cells (plot 12) are gated on
P2. CD4-FoxP3+ T cells (plot 4) and CD4+FoxP3+Tregs (plot 5) are gated on P2.
FoxP3-Helios+ Tregs (plot 6), FoxP3+Helios+ Tregs (plot 7), FoxP3+Helios- Tregs
(plot 8), and FoxP3-Helios- T cells (plot 9) are all gated on P3. The rest of the
81