en
t
re
v
ie
w
s
re
ports
de
p
o
si
te
d r
e
sea
rch
refer
e
e
d
re
sear
ch
interacti
o
ns
inf
ormation
growth of human cancer cell lines transplanted into mice
Chad Creighton
*
, Rork Kuick
†
, David E Misek
†
, David S Rickman
†
,
Franck M Brichory
†
, Jean-Marie Rouillard
†
, Gilbert S Omenn
‡
and
Samir Hanash
†
Addresses: *Bioinformatics Program, Human Genetics, and Public Health, University of Michigan, Ann Arbor, MI 48109, USA. †Department of Pediatrics and Communicable Diseases, Human Genetics, and Public Health, University of Michigan, Ann Arbor, MI 48109, USA. ‡Department of Internal Medicine, Human Genetics, and Public Health, University of Michigan, Ann Arbor, MI 48109, USA.
Correspondence: Chad Creighton. E-mail: [email protected]
© 2003 Creighton et al.; licensee BioMed Central Ltd. This is an Open Access article: verbatim copying and redistribution of this article are permitted in all media for any purpose, provided this notice is preserved along with the article's original URL.
Profiling of pathway-specific changes in gene expression following growth of human cancer cell lines transplanted into mice
Transcriptional regulation in eukaryotes often involves multiple transcription factors binding to the same transcription control region, and to understand the regulatory content of eukaryotic genomes it is necessary to consider the co-occurrence and spatial relationships of indi-vidual binding sites. The determination of conserved sequences (often known as phylogenetic footprinting) has identified indiindi-vidual tran-scription factor binding sites. We extend this concept of functional conservation to higher-order features of trantran-scription control regions
Abstract
Background: Tumor cells cultured in vitro are widely used to investigate the molecular biology of cancers and to evaluate responses to drugs and other agents. The full extent to which gene expression in cancer cells is modulated by extrinsic factors and by the microenvironment in which the cancer cells reside remains to be determined. Two cancer cell lines (A549 lung adenocarcinoma and U118 glioblastoma) were transplanted subcutaneously into immunodeficient mice to form tumors. Global gene-expression profiles of the tumors were determined, based on analysis of expression of human genes, and compared with expression profiles of the cell lines grown in culture.
Results: A bioinformatics approach associated genes that showed changes in their expression levels with functional classes as defined by either the GO gene annotations or MeSH terms in the literature. The classes of genes expressed at higher levels in cells grown in vitro indicated increased cell division and metabolism, reflecting the more favorable environment for cell proliferation. In contrast, in vivo tumor growth resulted in upregulation of a significant number of genes involved in the extracellular matrix (ECM), cell adhesion, cytokine and metalloendopeptidase activity, and neovascularization. When placed in comparable tissue environments, the U118 cells and the A549 cells expressed different sets of ECM and cell adhesion-related genes, suggesting different mechanisms of extracellular interaction at work in the different cancers.
Conclusions: Studies of this type allow us to examine the specific contribution of cancer cells to gene expression patterns within an in vivo tumor mixed with non-cancerous tissue.
Background
Since the 'seed and soil' hypothesis of Paget in the 19th cen-tury [1], it has been understood that the microenvironment,
or 'soil,' surrounding the tumor 'seed' plays a critical part in its development. However, investigations into the molecular biology of cancers are often carried out on cells grown in vitro
Published: 23 June 2003
Genome Biology 2003, 4:R46
Received: 24 March 2003 Revised: 16 May 2003 Accepted: 29 May 2003 The electronic version of this article is the complete one and can be
in culture, where the environment is unlike that of the in vivo
tissue environment in which cancers naturally develop. The effects of these environmental differences on cancer cells may account, in part, for the fact that only a small percentage of anticancer drugs that are found to effectively kill cells in vitro
are successful in subsequent animal and human studies. In this study, we explored the changes that occur at the tran-scriptome level as cells grown in vitro are transplanted into an in vivo environment, where they develop as a tumor. The
in vivo environment represented here is that of the subcuta-neous intrascapular region of the nude mouse. Two different cell lines were studied: A549, derived from human lung ade-nocarcinoma, and U118, derived from human brain glioblast-oma. Our study examined the differences in global gene expression between A549 mouse xenograft tumors and A549 cell cultures and between U118 xenograft tumors (grown in the same location as the A549 tumors) and U118 cultures. We looked for in vivo versus in vitro differences that were com-mon to the two cell lines, and for differences that were found in one cell line but not the other.
In modeling mechanisms of cancer development, global gene-expression profiling of human-derived cells grown as tumors in mice has some distinct advantages over profiling of tumors obtained from patients. Whereas a great deal of genetic variability exists among different tumors from differ-ent patidiffer-ents, lesser genetic heterogeneity would be expected in xenografts of cancer cells originally derived from a single patient. Furthermore, patient-derived tumors are composed of both cancer and non-cancer cells, making it difficult to pre-cisely ascertain gene-expression patterns specifically attrib-utable to cancer cells. For example, in many cancer microarray studies, the actual percentage of cancer cells in a profiled sample may be as low as 30-40% [2]. Even when using techniques such as laser capture microdissection, which can improve tumor purity [3], the relative contribution of cancer cells and non-cancer cells to the overall gene-expression profile remains uncertain. In contrast, profiling human genes expressed in a mouse xenograft using a human microarray chip might uncover genes specifically expressed in human cancer cells in xenograft tumors comprised of a mixture of human- and mouse-derived cells [4].
The data obtained in a microarray experiment can be over-whelming, and the challenge is to understand, on a global sys-tems level, the biology behind the differences in expression observed in hundreds of genes. In this study, we have searched for 'significantly enriched' classes of genes among all differentially expressed genes. These are classes or func-tional categories of genes that appear overrepresented in the set of differentially expressed genes. As a result, valuable clues could emerge as to the dominant biological features or processes that might underlie the coordinate expression of these genes. Such clues could be especially convincing if it can be shown that the enriched classes are unlikely to represent a
chance occurrence. Gene classes can be defined by common gene annotations or concepts from the biomedical literature.
Results
Global differences in gene expression between xenograft tumors and cell cultures
A549 and U118 cells were each transplanted subcutaneously into the intrascapular region of immunodeficient mice, within which sizable tumors developed after 21 days. Global mRNA expression profiles from these tumors, using Affyme-trix HuGeneFL chips, were compared with profiles obtained from the cell lines as grown in culture. Between the A549 xenograft tumors and the A549 cell cultures, 357 genes (375 probe sets) differed significantly at p < 0.01 with a fold change greater than two either way (134 genes being higher in tumors and 223 genes being higher in culture), a number much greater than the 24 to be expected by chance, as determined by permutation testing. Between the U118 xenograft tumors and cell cultures, 368 genes (387 probe sets) differed signifi-cantly (112 genes being higher in tumors and 256 genes being higher in culture), with 29 expected false positives due to chance. Table 1 shows the genes with highest expression in tumors compared with cultures, for each of the cell lines.
comm
en
t
re
v
ie
w
s
re
ports
refer
e
e
d
re
sear
ch
de
p
o
si
te
d r
e
se
a
rch
interacti
o
ns
inf
o
rmation
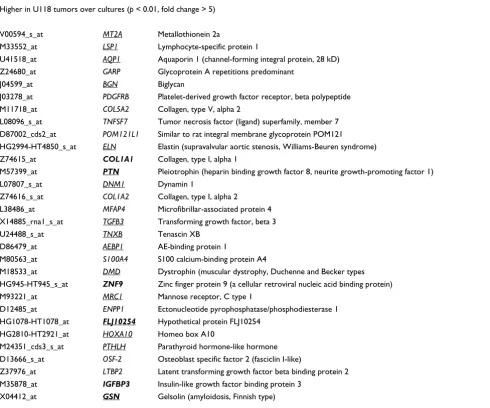
Top 30 genes showing higher expression in xenograft tumors over cultures for each cell line ranked by fold change
Probe set Gene Gene product description
Higher in U118 tumors over cultures (p < 0.01, fold change > 5)
V00594_s_at MT2A Metallothionein 2a
M33552_at LSP1 Lymphocyte-specific protein 1
U41518_at AQP1 Aquaporin 1 (channel-forming integral protein, 28 kD)
Z24680_at GARP Glycoprotein A repetitions predominant
J04599_at BGN Biglycan
J03278_at PDGFRB Platelet-derived growth factor receptor, beta polypeptide
M11718_at COL5A2 Collagen, type V, alpha 2
L08096_s_at TNFSF7 Tumor necrosis factor (ligand) superfamily, member 7 D87002_cds2_at POM121L1 Similar to rat integral membrane glycoprotein POM121
HG2994-HT4850_s_at ELN Elastin (supravalvular aortic stenosis, Williams-Beuren syndrome)
Z74615_at COL1A1 Collagen, type I, alpha 1
M57399_at PTN Pleiotrophin (heparin binding growth factor 8, neurite growth-promoting factor 1)
L07807_s_at DNM1 Dynamin 1
Z74616_s_at COL1A2 Collagen, type I, alpha 2
L38486_at MFAP4 Microfibrillar-associated protein 4
X14885_rna1_s_at TGFB3 Transforming growth factor, beta 3
U24488_s_at TNXB Tenascin XB D86479_at AEBP1 AE-binding protein 1
M80563_at S100A4 S100 calcium-binding protein A4
M18533_at DMD Dystrophin (muscular dystrophy, Duchenne and Becker types HG945-HT945_s_at ZNF9 Zinc finger protein 9 (a cellular retroviral nucleic acid binding protein)
M93221_at MRC1 Mannose receptor, C type 1
D12485_at ENPP1 Ectonucleotide pyrophosphatase/phosphodiesterase 1 HG1078-HT1078_at FLJ10254 Hypothetical protein FLJ10254
HG2810-HT2921_at HOXA10 Homeo box A10
M24351_cds3_s_at PTHLH Parathyroid hormone-like hormone D13666_s_at OSF-2 Osteoblast specific factor 2 (fasciclin I-like)
Z37976_at LTBP2 Latent transforming growth factor beta binding protein 2
M35878_at IGFBP3 Insulin-like growth factor binding protein 3 X04412_at GSN Gelsolin (amyloidosis, Finnish type)
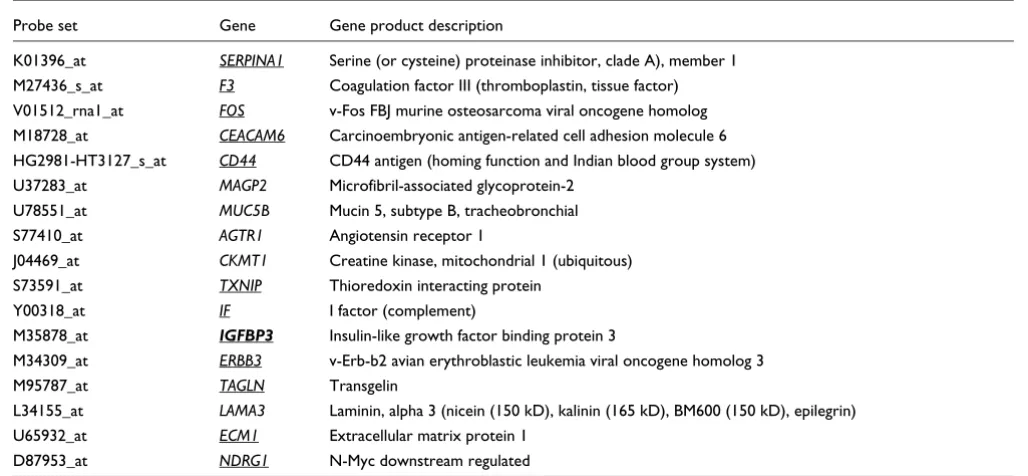
Higher in A549 tumors over cultures (p < 0.01, fold change > 10)
Z19574_rna1_at KRT17 Keratin 17
M29540_at CEACAM5 Carcinoembryonic antigen-related cell adhesion molecule 5 M35252_at TM4SF3 Transmembrane 4 superfamily member 3
HG371-HT26388_s_at MUC1 Mucin 1, transmembrane
X52003_at TFF1 Trefoil factor 1 (breast cancer, estrogen-inducible sequence expressed in)
U40434_at MSLN Mesothelin
Z48314_s_at MUC5AC Mucin 5, subtypes A and C, tracheobronchial/gastric
M57730_at EFNA1 Ephrin-A1
L24203_at TRIM29 Tripartite motif-containing 29
U17760_rna1_at LAMB3 Laminin, beta 3 (nicein (125 kD), kalinin (140 kD), BM600 (125 kD))
U04313_at SERPINB5 Serine (or cysteine) proteinase inhibitor, clade B (ovalbumin), member 5
[image:3.612.55.545.142.550.2]Principal components were extracted from the cell culture and xenograft expression data using all 7,069 probe sets con-sidered in the analysis. The first principal component cap-tures the greatest fraction of the overall variance in gene expression; the second captures the greatest fraction of vari-ance subject to being independent of the first, and so on. From the first two principal components, a pair of coordi-nates was determined for each xenograft and cell culture pro-file to construct a two-dimensional view that reflects the relative locations of the profiles in the higher-dimensional space. On the same two-dimensional view, we plotted one dataset of 86 profiles from lung adenocarcinomas and another dataset of 45 profiles from glioblastomas and astro-cytomas, generated from previous global gene-expression studies [5,6]. Figure 1 shows this principal components anal-ysis (PCA) plot of the gene-expression profiles from cell cul-tures, xenografts, and human lung and brain tumors. Although none of the human tumor profiles was used to define the principal components coordinate space, lung tumor profiles appear well separated on the plot from brain tumor profiles. A549 profiles (both xenograft and culture) are grouped with lung tumors rather than brain tumors, and U118 profiles, with brain tumors rather than lung tumors. Of the 134 genes found expressed more highly in A549 xenograft tumors over A549 cultures (p < 0.01, fold change > 2), 70 were also higher in stage I adenocarcinomas over A549 cul-tures (p < 0.05). Of the 112 genes upregulated in U118
xenograft tumors over cultures, 50 were also higher in high-grade glioblastomas over U118 cultures (p < 0.05).
Probe set Gene Gene product description
K01396_at SERPINA1 Serine (or cysteine) proteinase inhibitor, clade A), member 1
M27436_s_at F3 Coagulation factor III (thromboplastin, tissue factor) V01512_rna1_at FOS v-Fos FBJ murine osteosarcoma viral oncogene homolog
M18728_at CEACAM6 Carcinoembryonic antigen-related cell adhesion molecule 6
HG2981-HT3127_s_at CD44 CD44 antigen (homing function and Indian blood group system) U37283_at MAGP2 Microfibril-associated glycoprotein-2
U78551_at MUC5B Mucin 5, subtype B, tracheobronchial
S77410_at AGTR1 Angiotensin receptor 1
J04469_at CKMT1 Creatine kinase, mitochondrial 1 (ubiquitous)
S73591_at TXNIP Thioredoxin interacting protein
Y00318_at IF I factor (complement)
M35878_at IGFBP3 Insulin-like growth factor binding protein 3
M34309_at ERBB3 v-Erb-b2 avian erythroblastic leukemia viral oncogene homolog 3
M95787_at TAGLN Transgelin
L34155_at LAMA3 Laminin, alpha 3 (nicein (150 kD), kalinin (165 kD), BM600 (150 kD), epilegrin)
U65932_at ECM1 Extracellular matrix protein 1
D87953_at NDRG1 N-Myc downstream regulated
[image:4.612.51.565.118.356.2]Genes in bold were found upregulated in xenograft tumors over cultures for both cell lines with p < 0.05 in each. For A549, underlined genes were also found upregulated in lung tumors over A549 cultures with p < 0.05. For U118, underlined genes were also found upregulated in brain tumors over U118 cultures with p < 0.05.
Table 1 (Continued)
[image:4.612.315.557.476.665.2]Top 30 genes showing higher expression in xenograft tumors over cultures for each cell line ranked by fold change
Figure 1
Principal components analysis (PCA) plot of global gene-expression profiles from cell cultures, xenografts, and human lung and brain tumors. Principal components were extracted from the cell culture and xenograft expression data (but not the lung and brain tumor data) using all 7,029 HuGeneFL probe sets. The first two principal components are shown.
First principal component
Second principal component
U118 culture 20
15
15 10
10 5
5 0
0
−5
−5
−10
−10
−15
−15
−20
−20
comm
en
t
re
v
ie
w
s
re
ports
refer
e
e
d
re
sear
ch
de
p
o
si
te
d r
e
se
a
rch
interacti
o
ns
inf
o
rmation
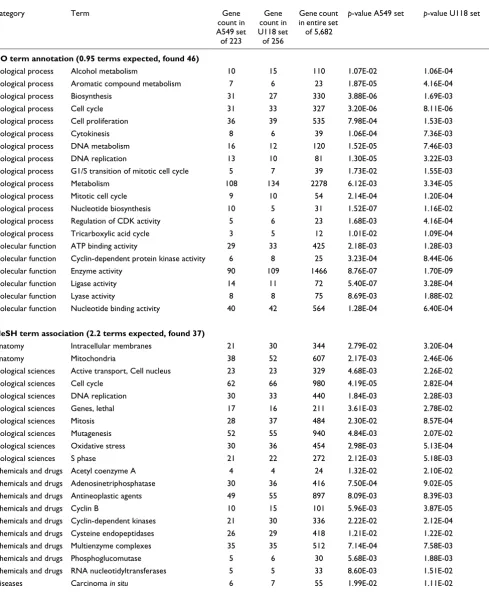
Significantly enriched classes arising both in genes higher in A549 cell cultures over tumors and in genes higher in U118 cell cultures over tumors (p < 0.05 in both sets)
Category Term Gene
count in A549 set of 223
Gene count in U118 set of 256
Gene count in entire set of 5,682
p-value A549 set p-value U118 set
GO term annotation (0.95 terms expected, found 46)
Biological process Alcohol metabolism 10 15 110 1.07E-02 1.06E-04
Biological process Aromatic compound metabolism 7 6 23 1.87E-05 4.16E-04
Biological process Biosynthesis 31 27 330 3.88E-06 1.69E-03
Biological process Cell cycle 31 33 327 3.20E-06 8.11E-06
Biological process Cell proliferation 36 39 535 7.98E-04 1.53E-03
Biological process Cytokinesis 8 6 39 1.06E-04 7.36E-03
Biological process DNA metabolism 16 12 120 1.52E-05 7.46E-03
Biological process DNA replication 13 10 81 1.30E-05 3.22E-03
Biological process G1/S transition of mitotic cell cycle 5 7 39 1.73E-02 1.55E-03
Biological process Metabolism 108 134 2278 6.12E-03 3.34E-05
Biological process Mitotic cell cycle 9 10 54 2.14E-04 1.20E-04
Biological process Nucleotide biosynthesis 10 5 31 1.52E-07 1.16E-02 Biological process Regulation of CDK activity 5 6 23 1.68E-03 4.16E-04
Biological process Tricarboxylic acid cycle 3 5 12 1.01E-02 1.09E-04
Molecular function ATP binding activity 29 33 425 2.18E-03 1.28E-03 Molecular function Cyclin-dependent protein kinase activity 6 8 25 3.23E-04 8.44E-06
Molecular function Enzyme activity 90 109 1466 8.76E-07 1.70E-09
Molecular function Ligase activity 14 11 72 5.40E-07 3.28E-04
Molecular function Lyase activity 8 8 75 8.69E-03 1.88E-02
Molecular function Nucleotide binding activity 40 42 564 1.28E-04 6.40E-04
MeSH term association (2.2 terms expected, found 37)
Anatomy Intracellular membranes 21 30 344 2.79E-02 3.20E-04
Anatomy Mitochondria 38 52 607 2.17E-03 2.46E-06
Biological sciences Active transport, Cell nucleus 23 23 329 4.68E-03 2.26E-02
Biological sciences Cell cycle 62 66 980 4.19E-05 2.82E-04
Biological sciences DNA replication 30 33 440 1.84E-03 2.28E-03
Biological sciences Genes, lethal 17 16 211 3.61E-03 2.78E-02
Biological sciences Mitosis 28 37 484 2.30E-02 8.57E-04
Biological sciences Mutagenesis 52 55 940 4.84E-03 2.07E-02
Biological sciences Oxidative stress 30 36 454 2.98E-03 5.13E-04
Biological sciences S phase 21 22 272 2.12E-03 5.18E-03
Chemicals and drugs Acetyl coenzyme A 4 4 24 1.32E-02 2.10E-02
Chemicals and drugs Adenosinetriphosphatase 30 36 416 7.50E-04 9.02E-05
Chemicals and drugs Antineoplastic agents 49 55 897 8.09E-03 8.39E-03
Chemicals and drugs Cyclin B 10 15 101 5.96E-03 3.87E-05
Chemicals and drugs Cyclin-dependent kinases 21 30 336 2.22E-02 2.12E-04
Chemicals and drugs Cysteine endopeptidases 26 29 418 1.21E-02 1.22E-02
Chemicals and drugs Multienzyme complexes 35 35 512 7.14E-04 7.58E-03 Chemicals and drugs Phosphoglucomutase 5 6 30 5.68E-03 1.88E-03
Chemicals and drugs RNA nucleotidyltransferases 5 5 33 8.60E-03 1.51E-02
[image:5.612.61.550.130.725.2]Overrepresentation of genes involved in cell division and metabolism among genes upregulated in cancer cells in culture relative to xenografts
Searches were made for significantly enriched gene classes, as defined by Gene Ontology (GO) annotation or Medical Subject Heading Index (MeSH) term association (see Materi-als and methods), for both the set of 223 genes upregulated in the A549 cell cultures over A549 tumors and the set of 256 genes upregulated in the U118 cell cultures over the U118 tumors (p < 0.01, fold change > 2). In each case, the p-values for the most enriched classes appeared highly significant compared to what would be expected, based on simulation results, in a randomly selected set of the same number of genes. For example, for the A549 set of 223 genes, 35 enriched LocusLink annotation terms were found that had a
p-value less than 1.9E-03, where one term with a p-value less than 1.9E-03 would be expected in a given set of 223 ran-domly selected genes. Out of 100 simulation tests, no single test had more than eight terms with a p-value less than 1.9E-03. Table 2 shows the top gene classes found in both the A549 set and the U118 set with p-values less than 0.05. There are far more gene classes common to both gene sets with p < 0.05 in each than would be expected in two randomly selected gene sets of 223 and 256 (for example, for the MeSH term classes, 37 were found to be significantly enriched in the actual data, whereas about two would be expected to occur by chance, see Table 2).
Taken together, the significantly enriched classes found for both the A549 and the U118 genes in cell culture compared with tumors are highly indicative of processes of cell division and metabolism, with significant MeSH term classes for the two gene sets including 'Cell cycle' (62 genes for A549, 66 genes for U118), 'DNA replication' (30,33), 'Mitosis' (28,37), 'Mitochondria' (38,52), and 'Cyclin-dependent kinases' (21,30); and significant GO terms including 'Cell prolifera-tion' (36,39), 'Metabolism' (108,134), 'Cytokinesis' (8,6), 'Tri-carboxylic acid cycle' (3,5), and 'G1/S transition' (5,7). A search for enriched gene classes was also made for 157 genes that were expressed more highly (p < 0.05, fold change > 2) in both A549 and U118 cell cultures over tumors, and the sig-nificant classes found were the same, or of the same nature, as the classes listed in Table 2. For the entire set of enriched classes for genes upregulated in cell cultures over the xenograft tumors, including which genes belong to which classes, see Additional data files and [7].
Overrepresentation of genes involved in cell adhesion, the extracellular matrix, and vascularization among genes upregulated in cancer cells in xenografts relative to cultures
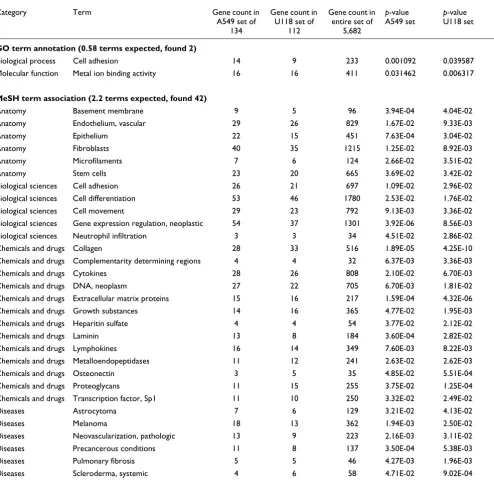
As with the genes expressed at higher levels in culture com-pared to xenografts, searches were made for significantly enriched GO and MeSH term classes for the set of 134 genes with significantly higher expression (p < 0.01, fold change > 2) in the A549 tumors over the A549 cell cultures and the set
of 112 genes upregulated in the U118 tumors over the U118 cell cultures. Again, in each case, the p-values for the most enriched classes found were quite significant over what would be expected by chance. For example, for the A549 set of 134 genes, 36 enriched MeSH terms were found that had a p -value less than 7E-04, where one term would be expected to have p less than 7E-04 in a set of 134 randomly selected genes; out of 100 simulation tests, no single test had more than six terms with a p-value less than 7E-04. Table 3 shows the top gene classes found in both the A549 set and the U118 set with p-values less than 0.05.
Taken together, the significantly enriched gene classes for A549 and U118 genes that were upregulated in tumors com-pared to cell culture are highly indicative of processes involv-ing cell adhesion and the extracellular matrix (ECM). Significant MeSH term classes for the two gene sets included 'Cell adhesion' (26 genes for A549, 21 genes for U118), 'Extra-cellular matrix proteins' (15,16), 'Cytokines' (28,26), 'Colla-gen' (28,33), 'Fibroblasts' (40,35), 'Metalloendopeptidases' (11,12), 'Growth Substances' (14,16), 'Proteoglycans' (11,15), and 'Transcription factor Sp1' (11,10). Sp1 is important for the basal expression of various collagens, and blocking Sp1 broadly inhibits expression of ECM genes [8]. Terms such as 'Pathologic neovascularization' (13,9) and 'Vascular endothe-lium' (29,26) can refer to processes of angiogenesis, the gen-eration of new blood vessels from preexisting vessels for the delivery of nutrients to tumors. Other disease-related terms include 'Precancerous conditions' (11,8), 'Pulmonary fibrosis' (5,5; a condition involving chronic inflammation and pro-gressive fibrosis of the pulmonary alveolar walls), and 'Sys-temic scleroderma' (4,6; characterized by hardening of affected tissues). Also of interest is the significant term 'Stem cells' (23,20), as similar signaling pathways are thought to regulate self-renewal in stem cells and cancer cells, and as tumors may include stem cells [9]. The entire set of enriched classes found for genes expressed more strongly in the xenografts over the cell cultures, including which genes belong to which classes, is available as additional data files and from [7].
Upregulation of genes specific to cell-line lineage in xenografts
metabo-comm
en
t
re
v
ie
w
s
re
ports
refer
e
e
d
re
sear
ch
de
p
o
si
te
d r
e
se
a
rch
interacti
o
ns
inf
o
rmation
lism may be more in common from one cancer to the next, processes of cell adhesion and ECM interaction are likely to be very different between different cell types. These observa-tions gave rise to the hypothesis that, when placed in compa-rable tissue environments, cancer cells from different lineages may express different cell adhesion and ECM-related genes.
To test our hypothesis that A549 cells and U118 cells each express a restricted set of ECM-related genes in tumors, we built a classifier for distinguishing between A549 and U118 cell-culture profiles. We used as the training dataset the A549 and U118 tumor profiles with the expression values for the 30 genes that had both an association in the literature with the MeSH term 'Extracellular matrix proteins' and were
signifi-Significantly enriched classes arising both in genes upregulated in A549 xenograft tumors over cell lines and in genes upregulated in U118 tumors over cell cultures (p < 0.05 in both sets)
Category Term Gene count in
A549 set of 134
Gene count in U118 set of
112
Gene count in entire set of
5,682
p-value A549 set
p-value U118 set
GO term annotation (0.58 terms expected, found 2)
Biological process Cell adhesion 14 9 233 0.001092 0.039587
Molecular function Metal ion binding activity 16 16 411 0.031462 0.006317
MeSH term association (2.2 terms expected, found 42)
Anatomy Basement membrane 9 5 96 3.94E-04 4.04E-02
Anatomy Endothelium, vascular 29 26 829 1.67E-02 9.33E-03
Anatomy Epithelium 22 15 451 7.63E-04 3.04E-02
Anatomy Fibroblasts 40 35 1215 1.25E-02 8.92E-03
Anatomy Microfilaments 7 6 124 2.66E-02 3.51E-02
Anatomy Stem cells 23 20 665 3.69E-02 3.42E-02
Biological sciences Cell adhesion 26 21 697 1.09E-02 2.96E-02
Biological sciences Cell differentiation 53 46 1780 2.53E-02 1.76E-02
Biological sciences Cell movement 29 23 792 9.13E-03 3.36E-02
Biological sciences Gene expression regulation, neoplastic 54 37 1301 3.92E-06 8.56E-03
Biological sciences Neutrophil infiltration 3 3 34 4.51E-02 2.86E-02
Chemicals and drugs Collagen 28 33 516 1.89E-05 4.25E-10
Chemicals and drugs Complementarity determining regions 4 4 32 6.37E-03 3.36E-03
Chemicals and drugs Cytokines 28 26 808 2.10E-02 6.70E-03
Chemicals and drugs DNA, neoplasm 27 22 705 6.70E-03 1.81E-02
Chemicals and drugs Extracellular matrix proteins 15 16 217 1.59E-04 4.32E-06
Chemicals and drugs Growth substances 14 16 365 4.77E-02 1.95E-03
Chemicals and drugs Heparitin sulfate 4 4 54 3.77E-02 2.12E-02
Chemicals and drugs Laminin 13 8 184 3.60E-04 2.82E-02
Chemicals and drugs Lymphokines 16 14 349 7.60E-03 8.22E-03
Chemicals and drugs Metalloendopeptidases 11 12 241 2.63E-02 2.62E-03
Chemicals and drugs Osteonectin 3 5 35 4.85E-02 5.51E-04
Chemicals and drugs Proteoglycans 11 15 255 3.75E-02 1.25E-04
Chemicals and drugs Transcription factor, Sp1 11 10 250 3.32E-02 2.49E-02
Diseases Astrocytoma 7 6 129 3.21E-02 4.13E-02
Diseases Melanoma 18 13 362 1.94E-03 2.50E-02
Diseases Neovascularization, pathologic 13 9 223 2.16E-03 3.11E-02
Diseases Precancerous conditions 11 8 137 3.50E-04 5.38E-03
Diseases Pulmonary fibrosis 5 5 46 4.27E-03 1.96E-03
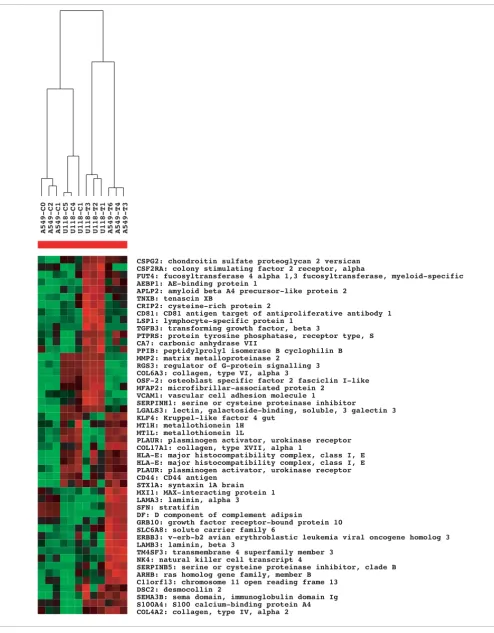
[image:7.612.59.553.131.617.2]cantly upregulated (p < 0.01, fold change > 2) either in A549 xenograft tumors over cultures or in U118 tumors over cul-tures. We then tested the classifier on the six profiles from A549 and U118 cell cultures. The classifier distinguished per-fectly between A549 and U118 profiles, which indicates that the expression pattern of ECM-related genes upregulated in the A549 tumors is more similar to the expression pattern of the same genes in the A549 cell cultures than it is to the expression of these genes in the U118 cell cultures, and vice versa. We built three other similar classifiers: one used the expression values of the 47 genes that are significantly higher in either A549 or U118 tumors and had an association with the MeSH term 'Cell adhesion'; the second used the values for 95 genes associated with 'Cell differentiation'; and the third used the expression values of all 236 genes higher in A549 or U118 tumors with p less than 0.01 and fold change greater than two. All three classifiers correctly distinguished between A549 and U118 cell cultures. Figure 2 shows a cluster diagram of the expression signatures of the 47 cell adhesion-related genes across all profiles, showing most of the genes as appear-ing more highly expressed in either the A549 tumors or the U118 tumors, but not in both.
Discussion
Cells grown in culture have unlimited access to nutrients under conditions most favorable for growth and proliferation and little exposure to extrinsic factors such as cytokines that modulate growth and differentiation. In contrast, cells in a tumor growing in a host tissue environment face conditions with more limited nutrients and oxygen and are subjected to or benefit from a wide variety of host factors. The ability of cancer cells to proliferate within a tissue depends on their response to adhesive and growth factor cues within the ECM [10], and self-sufficiency in growth signals is one of the hallmarks of cancer [11]. To stimulate their own growth and proliferation in tissue, tumor cells can overproduce and release their own growth factors or obtain them from the matrix as they are released by matrix metalloproteinases [12]. The endothelial vasculature grows into the tumor and pro-vides nutrients and oxygen [13]. This model is illustrated by the experimental results presented here, as both A549 (lung) and U118 (brain) cell lines are observed to upregulate one set of genetic programs related to cell growth and proliferation when in culture and another set related to cell adhesion, the extracellular matrix, growth substances, and neovasculariza-tion when developing as an in vivo tumor.
In terms of new biological insight into cancer development, our findings suggest that cancer cells of different origins interact in different ways with the same extracellular environ-ment to survive and proliferate as tumors. These lineage-spe-cific genetic programs for cell adhesion and ECM interaction, although less active in cell culture, are not lost, but may be reactivated when cells are transplanted back into an in vivo
environment, even if the new environment is different from the tissue of origin of the cancer. This conclusion is based on the significant representation of genes associated with cell adhesion and the ECM in both the A549 and the U118 xenograft tumors. However, the genes in each case represent two very distinct sets, the set in the U118 tumors being more similar in their expression pattern to that of the U118 cell cul-tures than to the A549 culcul-tures, and vice versa.
Although tumors are known to express high levels of genes involved in cell adhesion and the ECM, as we observed in the xenografts, assessment of the specific contribution of cancer cells to the increased expression may be difficult. In the case of human tumor xenografts in a mouse host, however, it can be determined conclusively that expression of cell adhesion and ECM genes is upregulated in the cancerous cells in the tumor tissue. This conclusion is based on the following two observations. First, profiling mouse tissue alone using probe sets designed for human genes gives poor hybridization, to the extent that the contribution from mouse genes would not have been enough to account for the differences in gene expression observed. Second, different cell adhesion and ECM-related genes are upregulated in tumors of different cell types (A549 versus U118); if the upregulation were due to a common mouse source, then the same genes should have appeared upregulated in both cell types, given that the cells were grown in the same site.
The findings presented here, suggesting that different ECM signaling pathways are active in different cancers, could have important clinical implications, as knowledge of the specific pathways dysregulated in a particular cancer may be valuable for devising effective therapy that targets those pathways. As candidates for further investigation, we have identified genes that appear upregulated in certain cancers in vivo compared to in vitro and that belong to distinct functional classes related to tumor progression. Also of interest are genes that are upregulated in both the cancers, including IGFBP3 (insu-lin-like growth factor binding protein 3), which, interestingly, is thought to have proapoptotic activities [14], and GSN
Figure 2 (see following page)
comm
en
t
re
v
ie
w
s
re
ports
refer
e
e
d
re
sear
ch
de
p
o
si
te
d r
e
se
a
rch
interacti
o
ns
inf
o
[image:9.612.57.551.83.716.2]rmation
Figure 2 (see legend on previous page)
CSPG2: chondroitin sulfate proteoglycan 2 versican CSF2RA: colony stimulating factor 2 receptor, alpha
FUT4: fucosyltransferase 4 alpha 1,3 fucosyltransferase, myeloid-specific AEBP1: AE-binding protein 1
APLP2: amyloid beta A4 precursor-like protein 2 TNXB: tenascin XB
CRIP2: cysteine-rich protein 2
CD81: CD81 antigen target of antiproliferative antibody 1 LSP1: lymphocyte-specific protein 1
TGFB3: transforming growth factor, beta 3
PTPRS: protein tyrosine phosphatase, receptor type, S CA7: carbonic anhydrase VII
PPIB: peptidylprolyl isomerase B cyclophilin B MMP2: matrix metalloproteinase 2
RGS3: regulator of G-protein signalling 3 COL6A3: collagen, type VI, alpha 3
OSF-2: osteoblast specific factor 2 fasciclin I-like MFAP2: microfibrillar-associated protein 2
VCAM1: vascular cell adhesion molecule 1
SERPINH1: serine or cysteine proteinase inhibitor
LGALS3: lectin, galactoside-binding, soluble, 3 galectin 3 KLF4: Kruppel-like factor 4 gut
MT1H: metallothionein 1H MT1L: metallothionein 1L
PLAUR: plasminogen activator, urokinase receptor COL17A1: collagen, type XVII, alpha 1
HLA-E: major histocompatibility complex, class I, E HLA-E: major histocompatibility complex, class I, E PLAUR: plasminogen activator, urokinase receptor CD44: CD44 antigen
STX1A: syntaxin 1A brain MXI1: MAX-interacting protein 1 LAMA3: laminin, alpha 3
SFN: stratifin
DF: D component of complement adipsin
GRB10: growth factor receptor-bound protein 10 SLC6A8: solute carrier family 6
ERBB3: v-erb-b2 avian erythroblastic leukemia viral oncogene homolog 3 LAMB3: laminin, beta 3
TM4SF3: transmembrane 4 superfamily member 3 NK4: natural killer cell transcript 4
SERPINB5: serine or cysteine proteinase inhibitor, clade B ARHB: ras homolog gene family, member B
C11orf13: chromosome 11 open reading frame 13 DSC2: desmocollin 2
(gelsolin), which has a role in cellular motility and acts as both a regulator and effector of apoptosis [15]. Further xenograft studies of the type presented here could examine the responses of the host tissue to the tumor (using a mouse microarray chip), as well as temporal changes in gene expres-sion within the developing tumor.
Materials and methods
Cell lines and tumorsBoth the A549 lung adenocarcinoma cell line and the U118 brain glioblastoma cell line were cultured at 37°C in a 6% CO2-humidified incubator in DMEM supplemented with 10% fetal calf serum, 100 U/ml penicillin and 100 U/ml strepto-mycin. The cells were passaged weekly upon reaching conflu-ence. We produced tumors in immunodeficient SCID C.B-17 mice by inoculating 5 × 10⁶ cells (either A549 or U118)
subcu-taneously per mouse in the intrascapular region. Tumors greater than 5 mm in diameter (range = 5-7 mm) were observed within 21 days in all the mice inoculated. The tumors were harvested under sterile conditions and trimmed of adipose and connective tissue. Total RNA was prepared from tumor tissue.
Gene-expression profiling
Three A549 xenograft tumors obtained from different mice, three U118 tumors from different mice, three A549 cell-cul-ture samples, and three U118 culcell-cul-ture samples were each pro-filed using HuGeneFL microarray chips (Affymetrix, Santa Clara, CA), which consist of 7,069 probe sets, each represent-ing an mRNA transcript. To assess the amount of hybridiza-tion with the HuGeneFL chip (designed for human mRNAs) that could be attributable to mouse mRNA in a xenograft tumor sample, a sample of mouse lung tissue was also pro-filed. Preparation of mRNA, hybridization of the arrays, and computation of probe-set intensities were as previously described [5,16,17]. The exogenous probe set controls on the HuGeneFL chip (probe sets that give constant hybridization from sample to sample) were used to determine scaling fac-tors for comparing the mouse lung profile with the xenograft and culture profiles. For each probe set, we computed the fold changes for human cell-line cultures (U118 and A549) with 20% mouse lung compared to the pure cell line, using the expression (0.8 × [human] + 0.2 × [mouse])/[human]. This assessed the potential impact of mouse tissue on differences observed between xenograft tumor and cell-culture profiles.
As criteria for determining significant differences in mean gene mRNA expression levels between groups of samples, we used both a p-value less than 0.01 using the two-sample t-test and a fold change greater than two either way. Probe-set intensities less than 50 were set to 50. Permutation testing was used to assess the number of genes that could be consid-ered significant for any arbitrary separation of the profiles into two groups. Hierarchical clustering, using the Eisen soft-ware [18,19], was applied using the average linkage method as
an aid to visualizing gene-expression patterns of interest. Global views of the variation in gene expression among cell specimens were obtained using PCA [17].
Significantly enriched classes within gene sets
For a given set of genes showing significant differences in expression between comparison groups, a search was made within the set for 'significantly enriched' functional classes of genes, as described previously [20]. For the entire set of genes profiled on the HuGeneFL chip, each gene was grouped into one or more classes as defined by one of the following criteria: a common Gene Ontology (GO) annotation term, where on the order of 1,000 terms were considered [21]; and a common MeSH literature term [22] association as defined below. GO term gene assignments related to categories of 'biological process' or 'molecular function' were obtained from LocusLink [23,24] and the GO term hierarchy was obtained from the Gene Ontology Consortium [25]. For each GO term assigned to a given gene in LocusLink, we also assigned all hierarchical parent terms of the term to the gene.
For each gene profiled in the study, the summaries of the 50 most recent articles that mention the gene by any one of its common aliases in the article abstract were downloaded from the web, using the Entrez utilities (described at [26]). An association was then made between the gene and any MeSH index terms included within those summaries. To reduce search time and spurious or uninteresting results, before searching for common MeSH term associations we first reviewed the MeSH terms downloaded for the entire set of genes profiled. We removed from further consideration any MeSH term that appeared to have no relevance to our study (for example, MeSH terms describing experimental protocols or the healthcare system). MeSH terms that were associated with fewer than 20 genes were also discarded, leaving some 4,000 MeSH terms that were considered in the analysis. Sim-ilarly, GO gene classes that applied to less than four of the genes under study were not considered.
For a given set of k significant genes, two separate searches were made for enriched GO term classes and MeSH term classes. For a given gene class common to n genes within the
comm en t re v ie w s re ports refer e e d re sear ch de p o si te d r e se a rch interacti o ns inf o rmation
sets, one with k genes and the other with l genes, with p -val-ues less than 0.05 in both cases, we calculated on the basis of simulation results the number of classes expected to be found in both a random k-gene set and a random l-gene set with p -values less than 0.05 in both. In this case, we carried out 100 simulation tests, in each of which one set of k genes and another set of l genes were each randomly selected from the entire set of G genes under study. For each gene class that was found to be represented in both random gene sets, p-values for enrichment were calculated for each of the two sets.
Classification of cell-line lineage based on gene expression
In order to determine whether the lineage, A549 or U118, of a given cell population could be predicted on the basis of its gene-expression profile, we built a classifier using a training set of profiles with a set of genes of interest to be used as markers. To classify a test sample as either A549 or U118, we computed the correlation coefficient between the expression values of the markers in the test sample profile and the same genes on each of the profiles in the training set (using log-transformed values). The class identity of the majority of the top five training profiles having the greatest correlation with the test profile was then assigned to that profile. This strategy is known in the classification literature as "five-nearest neigh-bors with majority voting" [16].
Additional data files
The following files are available with the online version of this article: expression datasets of the cell culture and xenograft profiles as a tab-delimited text file (Additional data file 1); a spreadsheet file including extra data, such as the scale-nor-malized means prior to quantile normalization, p-values from the 'present' test, a sheet of data from 60 control probe-sets on the Affymetrix chips, and data from the mouse lung tissue control profile (Additional data file 2); the search results for significantly enriched classes for GO annotation (Additional data file 3) and for MeSH term literature associations (Addi-tional data file 4) for genes found to significantly differ at p < 0.01, fold change > 2 between tumors and cell cultures for a given cell line; the values used in the classifications of cell cul-ture lineage using xenograft tumor profiles, together with the classification results, which correctly predicted the lineage of all six cell culture profiles, as an Excel spreadsheet (Addi-tional data file 5). The software for finding significantly enriched classes within gene sets is available from the authors' website [7].
Acknowledgements
Supported in part by grant MEDC-238 from the Michigan Life Sciences Corridor.
References
1. Paget S: The distribution of secondary growths in cancer of the breast. Cancer Metastasis Rev 1989, 8:98-101.
2. Bhattacharjee A, Richards WG, Staunton J, Li C, Monti S, Vasa P, Ladd C, Beheshti J, Bueno R, Gillette M, et al.: Classification of human lung carcinomas by mRNA expression profiling reveals dis-tinct adenocarcinoma subclasses. Proc Natl Acad Sci USA 2001, 98:13790-13795.
3. Rubin MA: Use of laser capture microdissection, cDNA micro-arrays, and tissue microarrays in advancing our understand-ing of prostate cancer. J Pathol 2001, 195:80-86.
4. Clark EA, Golub TR, Lander ES, Hynes RO: Genomic analysis of metastasis reveals an essential role for RhoC. Nature 2000, 406:532-535.
5. Beer DG, Kardia SL, Huang CC, Giordano TJ, Levin AM, Misek DE, Lin L, Chen G, Gharib TG, Thomas DG, et al.: Gene-expression profiles predict survival of patients with lung adenocarcinoma. Nat Med 2002, 8:816-824.
6. Rickman DS, Bobek MP, Misek DE, Kuick R, Blaivas M, Kurnit DM, Taylor J, Hanash SM: Distinctive molecular profiles of high-grade and low-high-grade gliomas based on oligonucleotide microarray analysis. Cancer Res 2001, 61:6885-6891.
7. Web supplement to "Profiling of pathway-specific changes in gene expression following growth of human cancer cell lines transplanted into mice". [http://dot.ped.med.umich.edu:2000/pub/ xeno/xeno.htm]
8. Verrecchia F, Rossert J, Mauviel A.: Blocking sp1 transcription factor broadly inhibits extracellular matrix gene expression in vitro and in vivo: implications for the treatment of tissue fibrosis. J Invest Dermatol 2001, 116:755-763.
9. Reya T, Morrison SJ, Clarke MF, Weissman IL: Stem cells, cancer, and cancer stem cells. Nature 2001, 414:105-111.
10. Wang F, Weaver VM, Petersen OW, Larabell CA, Dedhar S, Briand P, Lupu R, Bissell MJ: Reciprocal interactions between beta1-integrin and epidermal growth factor receptor in three-dimensional basement membrane breast cultures: a differ-ent perspective in epithelial biology. Proc Natl Acad Sci USA 1998, 95:14821-14826.
11. Hanahan D, Weinberg RA: The hallmarks of cancer. Cell 2000, 100:57-70.
12. Egeblad M, Werb Z: New functions for the matrix metallopro-teinases in cancer progression. Nat Rev Cancer 2002, 2:161-174. 13. Bissell MJ, Radisky D: Putting tumours in context. Nat Rev Cancer
2001, 1:46-54.
14. Furstenberger G, Senn HJ: Insulin-like growth factors and cancer. Lancet Oncol 2002, 3:298-302.
15. Kwiatkowski DJ: Functions of gelsolin: motility, signaling, apoptosis, cancer. Curr Opin Cell Biol 1999, 11:103-108.
16. Giordano TJ, Shedden KA, Schwartz DR, Kuick R, Taylor JM, Lee N, Misek DE, Greenson JK, Kardia SL, Beer DG, et al.: Organ-specific molecular classification of primary lung, colon, and ovarian adenocarcinomas using gene expression profiles. Am J Pathol 2001, 159:1231-1238.
17. Schwartz DR, Kardia SL, Shedden KA, Kuick R, Michailidis G, Taylor JM, Misek DE, Wu R, Zhai Y, Darrah DM, et al.: Gene expression in ovarian cancer reflects both morphology and biological behavior, distinguishing clear cell from other poor-prognosis ovarian carcinomas. Cancer Res 2002, 62:4722-4729.
18. Eisen MB, Spellman PT, Brown PO, Botstein D: Cluster analysis and display of genome-wide expression patterns. Proc Natl Acad Sci USA 1998, 95:14863-14868.
19. The Eisen lab [http://rana.lbl.gov]
20. Creighton C, Beer D, Hanash S: Gene expression patterns define pathways correlated with loss of differentiation in lung adenocarcinomas. FEBS Lett 2003, 540:167-170.
21. Ashburner M, Ball CA, Blake JA, Botstein D, Butler H, Cherry JM, Davis AP, Dolinski K, Dwight SS, Eppig JT, et al.: Gene ontology: tool for the unification of biology. The Gene Ontology Consortium. Nat Genet 2000, 25:25-29.
22. Masys DR, Welsh JB, Lynn Fink J, Gribskov M, Klacansky I, Corbeil J: Use of keyword hierarchies to interpret gene expression patterns. Bioinformatics 2001, 17:319-326.
23. Pruitt KD, Maglott DR: RefSeq and LocusLink: NCBI gene-cen-tered resources. Nucleic Acids Res 2001, 29:137-140.
26. Entrez Programming Utilities