MEASURING PERFORMANCE
IN SUPPLY CHAIN NETWORKS
Andreas Seiler
MEASURING PERFORMANCE
IN SUPPLY CHAIN NETWORKS
Andreas Seiler
Salford Business School
University of Salford, Salford, UK
Table of Contents
Table of Contents
Table of Contents ... i
List of Figures ... iii
List of Tables ... v
List of Equations ... viii
Glossary ... ix
Abstract ... x
1 Introduction ... 11
2 Measuring Supply Chain Performance ... 18
2.1 Supply Chain Development ... 18
2.1.1 General Business Trends... 19
2.1.2 Process Orientation ... 21
2.1.3 Supply Chain Management ... 23
2.2 Performance Measurement Development ... 26
2.2.1 Evolution of Performance Measurement ... 27
2.2.2 The aim of Overall Organisational Effectiveness ... 29
2.2.3 Internal and External Benchmarking ... 32
2.3 Shortcoming of Performance Measurement in a Supply Chain Network ... 35
2.3.1 Extension of Classical Performance Measurement ... 36
2.3.2 A Common Performance Measurement System ... 38
2.3.3 Towards an Advancement in Performance Measurement ... 40
2.4 Justification of Literature Research Results ... 41
2.5 Addressing of the Research Gap ... 42
2.5.1 Method to approach ... 43
2.5.2 Positioning and Research Themes ... 46
2.5.3 Impact and Consequences ... 49
Summary... 50
3 Theory... 52
3.1 Social Network Analysis ... 53
3.1.1 Preparatory Information ... 53
3.1.2 Main Subjects of Social Network Analysis ... 55
3.1.3 Fundamental Network Issues ... 56
3.2 The Influence of Context and Relationships ... 60
3.2.1 Two-Mode Networks ... 60
3.2.2 Ego-Network Quality ... 61
3.2.3 Hubs and Authorities ... 62
3.3 Social Network Analysis in a Supply Chain Context ... 63
3.3.1 The Network Concept ... 63
3.3.2 Key Theoretical Perspectives of Network Analysis ... 64
3.3.3 Role Theory ... 67
3.3.4 Network Perspective ... 68
3.4 Linking Social Network Analysis and Performance Measurement ... 69
Summary... 75
Table of Contents
4.1 Research Philosophy ... 78
4.2 Research Methods ... 80
4.2.1 Scope of the Analysis... 80
4.2.2 Explorative Network Analysis ... 81
4.2.3 Quantitative Business Report Analysis ... 86
4.2.4 Pilot talks ... 88
4.3 Sample and Data Access ... 89
4.3.1 Quick Test ... 90
4.3.2 The Supply Chain Network ... 93
4.3.3 Business Reports ... 94
4.4 Development of New Conceptual Work ... 95
4.4.1 Design of the Network Creator ... 95
4.4.2 Data Processing ... 96
4.4.3 Individual versus Network-based Research ... 98
4.5 Application of Social Network Analysis ... 101
4.5.1 Relational Data Linked to Statistics ... 101
4.5.2 Blockmodelling ... 104
Summary... 107
5 Data Analysis and Results ... 109
5.1 Initial Overview ... 110
5.2 Data Collection ... 112
5.3 Test of the Hypotheses ... 125
5.3.1 Strength of the Links ... 126
5.3.2 Centrality of the Nodes ... 133
5.3.3 Diversity of the Links ... 141
5.4 Results for Simple Linear Regressions ... 161
5.5 Verification by Ranking and Prestige ... 163
5.6 Statistical Performance Measurement Models ... 168
5.6.1 Revenue per Employee Model ... 174
5.6.2 Return on Assets Model ... 175
5.6.3 Operating Profit Model ... 176
5.7 Results for Multiple Linear Regressions ... 178
6 Implications ... 179
6.1 Advancement of Performance Measurement ... 179
6.2 Blueprint for Network Research ... 184
7 Conclusions ... 186
Appendices ... 188
List of Figures
List of Figures
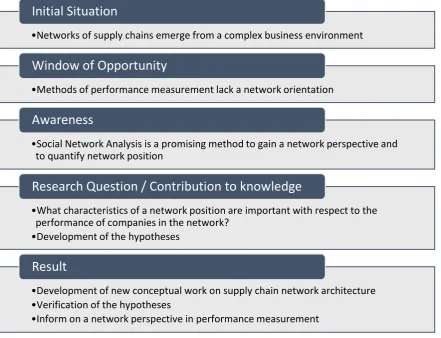
Figure 1: Outline of the problem to be addressed ... 11
Figure 2: Outline research methodology ... 14
Figure 3: Timeline of the research process with main tasks up to completion ... 17
Figure 4: Forces and Trends with Impact on the Supply Chain ... 19
Figure 5: Development of Transport and Communication Costs ... 20
Figure 6: Synchronisation of Supply and Demand across the Supply Chain ... 24
Figure 7: Concept of Supply Chain Management Software ... 25
Figure 8: Timeline of Performance Measurement ... 28
Figure 9: Fundamental ©EFQM Concept ... 31
Figure 10: Performance Pyramid... 32
Figure 11: Extended Timeline for Performance Measurement ... 35
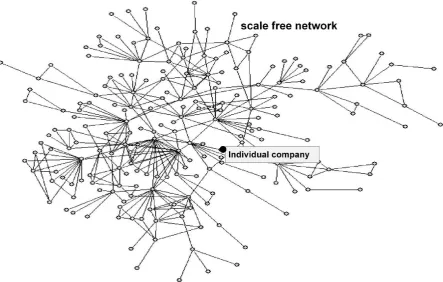
Figure 12: Scale Free Network Perspective ... 44
Figure 13: Percentage Distributions of the Number of Publications by Year ... 46
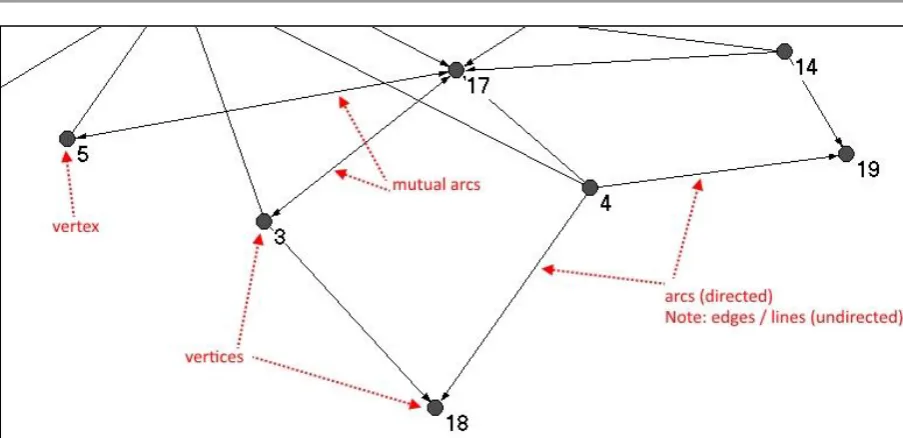
Figure 14: Exemplary Illustration of a Connected Graph ... 53
Figure 15: Exemplary Illustration of a Path ... 54
Figure 16: Exemplary Illustration of Triadic Closure ... 57
Figure 17: Exemplary Illustration of a Bridge ... 57
Figure 18: Exemplary Illustration of Strong and Weak Ties ... 58
Figure 19: Exemplary Illustration of Proportional Strength... 58
Figure 20: Exemplary Illustration of Structural Holes ... 59
Figure 21: Concept for Hubs and Authorities Scores ... 63
Figure 22: Summarised Research Approach of the Thesis ... 77
Figure 23: Illustration of the Scope of the Analysis ... 81
Figure 24: Segment of an Exemplary Graph (Sociogram) ... 82
Figure 25: Entity Relationship Model for Data Aggregation ... 96
Figure 26: The Network Creator Application (Cash Flows Tab) ... 97
Figure 27: First Exemplary Ego-network Illustration ... 99
Figure 28: Second Exemplary Ego-network Illustration ... 99
Figure 29: Exemplary Frequency Distribution by Classes of Quality ... 100
Figure 30: Ego-network Illustration of Focal Company 2 ... 116
Figure 31: Ego-network Illustration of Focal Company 8 ... 116
Figure 32: Frequency Distribution by Classes of Expenses Quality ... 118
Figure 33: Frequency Distribution by Classes of Customer Quality ... 119
Figure 34: Directed Graph, GD(V, A), of the Egocentric Network Study ... 121
Figure 35: Distribution of Nodes with each Given Degree (Degree > 1) ... 123
Figure 36: Extracted Subnetwork of GD(V, A) ... 128
List of Figures
Figure 39: Box Plot for OP ... 132
Figure 40: Linear Regression OP ex. Outlier = f(AS) ... 133
Figure 41: Linear Regression OP = f(C) ... 137
Figure 42: Linear Regression ROA = f(BPβ = 0.995/λ) ... 137
Figure 43: Linear Regression OP = f(BPβ = 0.995/λ) ... 138
Figure 44: Linear Regression OP = f(BC) ... 138
Figure 45: Directed Graph, GD(V, A), of the Egocentric Network Study (Product Types) ... 142
Figure 46: Linear Regression RE = f(HUB) ... 145
Figure 47: Affiliation Matrix of the Industry Network ... 148
Figure 48: Directed Graph HD(W, B) of the Egocentric Network Study ... 150
Figure 49: Subnetwork of the Directed Graph HD(W, B) of the Egocentric Network Study (Industries) ... 155
Figure 50: Linear Regression PFR = f(IND) ... 157
Figure 51: Box Plot for PFR ... 158
Figure 52: Linear Regression PFR ex. Outlier = f(IND) ... 159
Figure 53: Matrix Scatter Plot of All Variables of Interest ... 162
Figure 54: Framework for the Impact of Contemporary Performance Measurement ... 180
List of Tables
List of Tables
Table 1: SCOR® Model Performance Measures ... 33
Table 2: Metrics in the Supply Chain ... 39
Table 3: Morphological Analysis for a Network-oriented Approach in Performance Measurement ... 41
Table 4: Main Themes of Social Network Analysis ... 55
Table 5: Research Philosophy of the Pragmatist... 79
Table 6: Notation for Network Position Properties... 83
Table 7: Definition of Network Position Properties ... 84
Table 8: Illustration of Profit Calculation ... 87
Table 9: Definition of Financial Performance Measures ... 88
Table 10: Indicators of the Quick Test ... 91
Table 11: Quick Test Rating Scale... 92
Table 12: Results of the Quick Test of the Convenience Sample ... 112
Table 13: Overview of the Procurement Side in the Network ... 114
Table 14: Overview of the Revenue (Sales) Side in the Network ... 114
Table 15: Percentages of Overall Suppliers and Customers ... 115
Table 16: Calculation of the Average Number of Partners ... 117
Table 17: Ego-networks with Suppliers ... 118
Table 18: Ego-networks with Customers ... 119
Table 19: All-Degree Frequency Distribution ... 123
Table 20: Results of the Dependent Variable Performance ... 125
Table 21: Results of the Aggregated Strength of Focal Companies ... 129
Table 22: Correlation Results for Hypothesis 1 (AS) ... 130
Table 23: Test for Significance of Hypothesis 1 (AS) ... 131
Table 24: Descriptive Statistics (Quantitative Data) for OP ... 132
Table 25: Additional Correlation Result for Hypothesis 1 (AS)... 133
Table 26: Results of the Different Centrality Measures of Focal Companies ... 135
Table 27: Correlation Results for Hypothesis 2 (C)... 136
Table 28: Correlation Results for Hypothesis 2 (BPβ = 0.995/λ) ... 136
Table 29: Correlation Results for Hypothesis 2 (BC) ... 137
Table 30: Test for Significance of Hypothesis 2 (C) ... 139
Table 31: Test for Significance of Hypothesis 2 (BPβ = 0.995/λ) ... 139
Table 32: Test for Significance of Hypothesis 2 (BC) ... 139
Table 33: Summarised Correlation Results for Performance Influenced by BP ... 140
Table 34: Summarised Significance Results for Performance Influenced by BP ... 140
Table 35: Results of the Hubs and Authorities of Focal Companies ... 144
List of Tables
Table 38: Test for Significance of Hypothesis 3 (Hubs)... 146
Table 39: Formal Structure of WZ 2008 Code ... 147
Table 40: Frequency Distribution of Regularly Equivalent Nodes ... 148
Table 41: Results (nominal) of Industries and Performance of Focal Companies ... 151
Table 42: Determination of the Frequencies for the Contingency Table ... 152
Table 43: 2x2 Table for Diversity and Revenue per Employee ... 152
Table 44: Observed Frequencies for IND’ and RE ... 152
Table 45: Expected Frequencies for IND’ and RE ... 152
Table 46: Correlation Results for Hypothesis 3 (IND’) ... 154
Table 47: Test for Significance of Hypothesis 3 (IND’)... 154
Table 48: Overview Number of Participating Industries ... 156
Table 49: Correlation Results for Hypothesis 3 (IND) ... 156
Table 50: Test for Significance of Hypothesis 3 (IND) ... 157
Table 51: Descriptive Statistics (Quantitative Data) for PFR ... 158
Table 52: Additional Correlation Results for Hypothesis 3 (IND) ... 158
Table 53: Additional Test for Significance of Hypothesis 3 (IND) ... 159
Table 54: Additional Test for Significance of Hypothesis 3 (IND) Significance Level = 0.10 ... 159
Table 55: Summarised Test Results by Means of Simple Linear Regression ... 161
Table 56: Indegree Calculation Based on the Directed Graph GD(V, A) ... 164
Table 57: Correlation Results for Prestige and Performance Based on GD(V, A) ... 164
Table 58: Results for Proximity Prestige ... 167
Table 59: Correlation Results for Proximity Prestige and Performance (GD(V, A)) ... 167
Table 60: Multiple Linear Regression Models (All Dependent Variables) ... 169
Table 61: Multiple Linear Regression Results Including all Independent Variables ... 171
Table 62: Significance of the Standardised Regression Coefficients (All Beta Values) 173 Table 63: Multiple Linear Regression Results Including 5 Independent Variables (RE Model) ... 174
Table 64: Significance of the Standardised Regression Coefficients (5 Beta Values, RE Model) ... 174
Table 65: Multiple Linear Regression Results Including 4 Independent Variables (RE Model) ... 174
Table 66: Significance of the Standardised Regression Coefficients (4 Beta Values, RE Model) ... 174
Table 67: Final Model for the Dependent Variable RE ... 175
Table 68: Multiple Linear Regression Results Including 3 Independent Variables (ROA Model)... 175
List of Tables
Table 70: Final Model for the Dependent Variable ROA ... 176 Table 71: Multiple Linear Regression Results
Including 3 Independent Variables (OP Model) ... 177 Table 72: Significance of the Standardised Regression Coefficients
(3 Beta Values, OP Model) ... 177 Table 73: Final Model for the Dependent Variable OP ... 177 Table 74: Three Most Significant Test Results by Means of
List of Equations
List of Equations
Equation 1: Quality of an Alter as Ego-network Property ... 61
Equation 2: Calculation of a Hub Score ... 62
Equation 3: Calculation of an Authority Score ... 62
Equation 4: Quality of an Alter as Ego-network Property ... 100
Equation 5: Quality of an Alter as Ego-network Property ... 117
Equation 6: Exemplary Model Based on Linear Regression ... 125
Equation 7: t-value for the one-sided t-Test for the correlation coefficient ... 126
Equation 8: Calculation of the Chi-square Coefficient for 2x2 Scheme ... 153
Equation 9: Cramers Index ... 153
Equation 10: Calculation of the Phi-Coefficient ... 153
Equation 11: Exemplary Holistic Model Based on Multiple Linear Regression ... 168
Equation 12: Standardisation of the Regression Coefficients ... 170
Equation 13: Calculation of the F-Value ... 171
Equation 14: t-value of Standardised Correlation Coefficient ... 171
Glossary
Glossary
ABS absolute
AS aggregated strength AT asset turnover AUTH authorities
AVG average
BC betweenness centrality
BP Bonacich power
C degree centrality
CUM cumulative
CUST customer
DDR dynamic debt ratio DV dependent variable EC eigenvector centrality
EFQM European Foundation for Quality Management
empl. employee
ENAPS European Network for Advanced Performance Studies
FOC focal company
HUB hubs
IND number of complementary industries IV independent variable
m.m.u. millions in monetary units
NACE nomenclature statistique des activités économiques dans la communauté européenne NACE
OEM original equipment manufacturer OP operating profit
PAT profit after tax
PBIT profit before interest and tax PBT profit before tax
PFR profit fixed asset ratio PM performance measurement RE revenue per employee ROA return on assets
SC supply chain
SCM supply chain management
SCOR® Supply Chain Operations Reference SCS supply chain system
SNA social network analysis SUPPL supplier
Abstract
Abstract
1. Introduction
1
Introduction
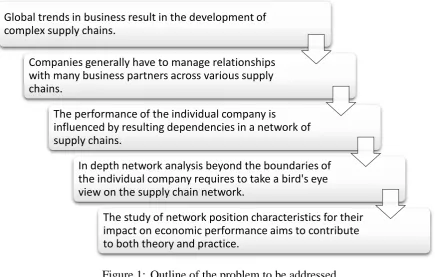
This brief overview illustrates the structure of the present study. This study deals with corporate performance measurement in order to make a contribution which adequately reflects recent developments such as supply chain networks. Chapter 1 defines the subject matter and introduces the aim of our1 study. The main objective is to enhance performance measurement by focussing on the degree to which companies are embedded into their supply chain networks. The awareness to address this topic becomes apparent by looking at Figure 1 which in advance outlines the problem that companies face.
Figure 1: Outline of the problem to be addressed
By definition, performance measurement is the process of identification and quantification of performance measures, also referred to as performance indicators or performance metrics. These performance measures allow to assess the extent to which goals are achieved in terms of quality, time and cost. Indeed, performance measurement is useful in that it can be applied to entire companies, divisions and departments from different perspectives (Gabler Wirtschaftslexikon, 2014). A shorter definition of performance measurement describes it as the process of quantifying the efficiency and effectiveness of action, while a performance measure can be defined as a metric used to quantify the efficiency and/or effectiveness of an action. In
1 Note: The author’s “we” respectively “our” (pluralis modestiae) primarily refers to the researcher and author of the present study. However, in this sense the “we” / “our” also indicates the involvement of the informed reader
Global trends in business result in the development of complex supply chains.
Companies generally have to manage relationships with many business partners across various supply chains.
The performance of the individual company is
influenced by resulting dependencies in a network of supply chains.
In depth network analysis beyond the boundaries of the individual company requires to take a bird's eye view on the supply chain network.
[image:13.595.92.528.257.534.2]1. Introduction turn, a performance measurement system can be defined as the set of metrics used to quantify both the efficiency and effectiveness of actions (Neely, Gregory & Platts, 1995, pp. 80–81).
As its name would suggest, embeddedness generally describes the extent to which economic activities find themselves embedded in socio-cultural relation systems or to which extent a company is embedded into its socio-cultural environment (Neumair & Haas, 2014).
It is not necessary to provide a definition for the term company here. While there are various interpretations of what a company is, at this point it is sufficient to say that this study focuses on small and medium-sized companies, manufacturers in the main, and their relations with customers and suppliers. The companies are to be viewed as economic-financial and legal units, for which the economic principle is constitutive.
Given the definition of the main term performance measurement, it is obvious that the methods to measure performance are influenced by the way companies do business and the resulting challenges. In fact, companies are nowadays part of supply chains which stretch across the globe and face a constant demand to bring products to the market both at a faster rate and at lower cost. These changing business conditions have initiated a continuous development in the research field of supply chain management (Gunasekaran, Patel & Tirtiroglu, 2001), (Webster, 2002). These challenges are accompanied by a change from a limited corporate perspective to a more integrative view that goes beyond the boundaries of a single company. Christopher (2011, pp. 23–24) relates the 4 R’s (responsiveness, reliability, resilience, relationships) to the challenges companies face. The 4 R’s describe influences which companies as part of competitive supply chains need to handle:
Responsiveness describes the need of just-in-time delivery together with the ability of immediate response to changing customer requirements.
Reliability of delivery becomes more complicated because of increased pressure resulting from reduced safety stocks.
Resilience of the supply chain deals with the increasing volatility as a result of unexpected events. There is the attempt to consider possible risks in order to make supply chains less susceptible to shocks.
Relationships refer to the tendency of customers willing to reduce their supplier base. Strong relationships may prove beneficial but increase dependencies.
1. Introduction chains has become increasingly complex. Therefore, the whole topic of supply chain management supports the administration of complex supply chains together with a framework for cooperation with business partners.
However, to meet the demands of globalisation, business processes need to be monitored and improved continuously. Corporate performance measurement is a key tool of supply chain management. It aims to provide appropriate solutions as basis for any adaptation of business processes. Various methods of performance measurement are suitable to collect relevant information and support managers who are responsible for the adaptation of business processes as alluded to above.
1. Introduction
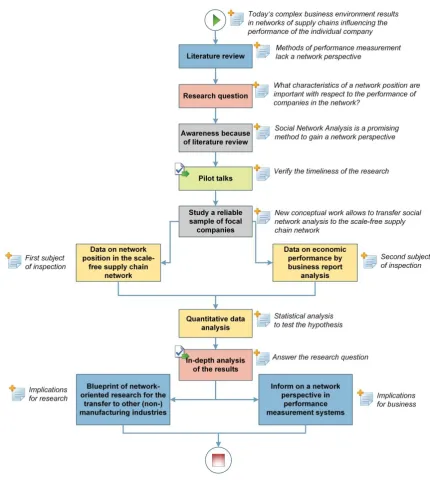
Figure 2: Outline research methodology
[image:16.595.91.522.63.544.2]1. Introduction suppliers. As several authors point out, existing measures of performance are inadequate to cover the needs for companies with respect to a network, because these methods lack a supply chain thinking and only encourage local optimisation (Chan & Qi, 2003, p. 209), (MacBryde, Shepherd & Günter, 2006, p. 243), (Gunasekaran et al., 2001, p. 71).
There are collaborative approaches; indeed even the possibility of a common performance measurement system exists. But both concepts are only appropriate for a limited number of partners. By speaking of a change from “monocultural to polycultural performance measurement” (Morgan, 2007, p. 256), Morgan provides an academic argument for this problem of enhanced performance measurement. The academic argument results from a debate addressing the supply chain network development and its analysis. By accomplishing a network perspective for performance measurement, this thesis comprising the development of a network-oriented approach contributes to polycultural performance measurement.
The development of performance measurement methods as presented in Chapter 2 explains the need for a further development of performance measurement. The determination of a lack of measures suitable to evaluate performance across the supply chain network points to the degree of originality of this thesis. Taking existing weaknesses in performance measurement, such as an overly narrow focus on dyadic relationships, as a starting point we reasonably assume that companies might benefit from a broader supply chain network approach. It is expected that companies depend on each other in more than just dyadic terms. Therefore, this study attempts to make a shift from the hierarchical structure of individual supply chains towards a network orientation. New conceptual work making the supply chain network visible helps us to learn from the existing connectedness within a network.
In Chapter 3 we introduce social network analysis, a method of social sciences with its focus on structure, as a solution to identify patterns within the network. Social network analysis not only focusses on the connections among all dyads in a given setting, but also on actors and relationships which are embedded in a larger structure. Thus, this method not only analyses the individual object, but also the object embedded within the network. By transferring social network analysis to the supply chain network, we can develop interdisciplinary research under the assumption that findings regarding the network position of a company influence the performance of that company.
1. Introduction formulate specific hypotheses that allow us to test influences on economic performance of a company by measuring key network position variables that express (i) strength of links, (ii) node centrality, and (iii) diversity of links.
By presenting our methodological approach in Chapter 4, we illustrate how the findings of our network analysis are linked to economic performance. We refer to two subjects of inspection, namely the scale-free (no clear boundaries) supply chain network and business reports. Following the definition of our sample of focal companies, we introduce our developed software which processes network flows between companies. In doing so, the focal companies are defined as small and medium-sized manufacturing companies from the German plastics processing industry. The so called plastic converters deliver finished parts or semi-finished parts that are incorporated into final products.
Using our developed software, we create one large network, our first subject of inspection. The network comprises the individual supply chain networks of focal companies. Each of these so called ego-networks consists of a focal company, its suppliers and its customers. We merge the individual supply chain networks, identify common business partners between focal companies and highlight the relationships as connections, illustrating a small section of the scale-free supply chain network. Based on the revenue that underlies each connection, we include the strongest suppliers and customers of each focal company.
In order to determine the performance of focal companies, we introduce wide-ranging financial performance measures. We explain our comprehensive analysis of business reports, the second subject of inspection. Among others, financial performance measures such as operating profit, return on assets and revenue per employee are illustrated.
1. Introduction would be interesting to see whether our results can be confirmed by transferring our research to other manufacturing supply chains.
In a nutshell, the entire thesis is constructed as follows: Subsequent to the just provided overview of this thesis (Chapter 1), Chapter 2 introduces the research field and describes the problem in more detail. Chapter 3 then explains the theoretical basis of the study and derives a number of hypotheses from this. Chapter 4 describes the methodological approach. We then analyse the gained data and present our results (Chapter 5), while Chapter 6 concludes with a general discussion on implications for both, theory and practice.
The timeline in Figure 3 provides a chronological overview of relevant tasks and milestones in order to write the thesis.
2. Measuring Supply Chain Performance
2
Measuring Supply Chain Performance
In order to place this thesis into a wider context, we describe in this chapter the existing business conditions and the development of supply chains. Section 2.1 demonstrates that in recent decades, several global trends have had a particular influence on supply chain development and contributed to the importance of supply chains in general. In order to be able to manage these increasingly complex supply chains, it is vital to use the entire topic of supply chain management to support the administration of the supply chains. Aiming at continuous optimisation of value creation, supply chain management deals with cooperation across the supply chain and goes beyond organisational boundaries. From this perspective it is clear why the topic of supply chain management is closely linked with performance measurement methods. Section 2.2 shows how existing performance measurement methods have evolved in order to meet new demands arising because of today’s importance of supply chains. We identify the reasons, why existing performance measurement theory fails in its support of strategy development, decision-making, and performance improvement in this context. Indeed in Section 2.3 it becomes clear that the existing tools are not sufficiently developed to meet the requirements of supply chain networks. In section 2.4 we justify the argumentation of our literature research by means of comprehensive literature synthesis on today's challenges in performance measurement. Finally, the advancement of new techniques as depicted in Section 2.5 explains why performance measurement needs to be adapted to the requirements of supply chain networks.
2.1 Supply Chain Development
Providing a clear definition for the supply chain is difficult, as the following statement underlines:
“The supply chain is a network of organizations that are involved, through upstream and downstream linkages, in the different processes and activities that produce value in the form of products and services in the hands of the ultimate customer” (Christopher, 1998, p. 15).
2. Measuring Supply Chain Performance Supply chains are characterised by closely linked customers and suppliers. General business trends such as the internationalisation of the markets, together with the advancement of technology are reasons for continuous change and increased complexity. The resulting dynamics in business relationships have the effect that supply chains need to be redesigned on a regular basis. According to the knowledge of a major global consultancy, Figure 4 summarises the prevailing key forces and trends.
Figure 4: Forces and Trends with Impact on the Supply Chain (Capgemini, 2008, p. 12)
We assume that the only way to master the increased level of complexity is more transparency across the supply chain. Thus, the individual company might certainly benefit from new network insights as a basis for future strategic decision making.
2.1.1 General Business Trends
2. Measuring Supply Chain Performance have evolved as a result of market liberalisation and political integration (Arndt, 2006, pp. 8– 9), (Koch, 2014, p. 13). Countries have reduced trade barriers to foster the import and export of goods and services. Due to the evolution in transport, technology and information technology, global economic integration has intensified. With the beginning of globalisation, worldwide transport capacity increased, even though ecological trends such as sustainability and the shortage of natural resources have become more influential. A reduction in energy costs with respect to the total distances is accompanied by a higher number of direct connections across the globe. The increasing capacity of aircraft is a further factor in reducing transport times (Koch, 2014, pp. 20–21). These different factors lead to a continuously higher volume of worldwide trade and a steady reduction of transport costs per transport unit. Figure 5 illustrates the development of transport and telecommunication costs since 1930.
Figure 5: Development of Transport and Communication Costs (Bundeszentrale für politische Bildung, 2009, p. 1)
2. Measuring Supply Chain Performance Companies take “make or buy” decisions in order to achieve a higher value creation for their manufacturing processes. More and more manufacturing steps are outsourced, in order to achieve a qualitatively higher, cheaper, faster, more reliable or more flexible result. An on-going concentration process aiming to reduce costs also leads to larger companies (Arndt, 2006, pp. 18–19), (Rolstadas, 1998, pp. 989–990). Through mergers and acquisitions, companies seek to benefit from synergies in terms of reduced costs, expanded markets, improved purchasing conditions and a wider product range. Beside the mentioned benefits of globalisation, the global economy also results in new entrepreneurial challenges like global competition and the coordination of the flow of goods across national borders and continents.
A changing customer-behaviour where “customers increasingly expect suppliers to meet their demand rapidly and accurately” (Webster, 2002, p. 353) is a further factor contributing to the complexity of the business conditions. Many markets have changed from sellers’ markets to customers’ markets over the last few decades (Arndt, 2006, pp. 18–20), (Rolstadas, 1998, pp. 989–990). It is the customer who decides what he wants. There no longer exists a given, pre-established system by which the producer and its suppliers determine what is available to the customer. Given the development of customers’ markets, global competition is reinforced because customers may have a wide range of possible suppliers at hand. Further, worldwide overcapacity such as in the automotive sector together with an easy and worldwide accessibility of information create even more pressure on suppliers. Customers can pit suppliers against each other and thus strengthen their negotiating power (Arndt, 2006, pp. 18–20). This increased competition, new customer requirements and technological progress force a trend towards shorter product life cycles and mass customisation (Arndt, 2006, p. 22), (Lowson, King & Hunter, 1999), (Chan & Qi, 2003, p. 209). The reduction of time-to-market creates additional pressure for product development, production processes and product introduction on the market, because products need to be available as quickly as possible.
The rapid development of information technology helps businesses to cope with the demands placed on them (Arndt, 2006, p. 24). Given a high degree of information exchange across the supply chain, it is possible to improve processes continuously. Technology and the standards of electronic data interchange allow the implementation of complex concepts such as just-in-time and vendor managed inventory.
2.1.2 Process Orientation
2. Measuring Supply Chain Performance process-orientation is to support the interconnection of all processes in order to fulfil the needs of the customers at the best possible level. Unnecessary activities with no additional value to the customer must be eliminated. Process-orientation results in a higher level of transparency because each contribution to fulfil the needs of the customers can be determined. Finally, due to the establishment of an organisation aligned to key processes, companies are able to improve material, information and cash flows by expanding their own narrow corporate perspective to a more integrative one, beyond their own boundaries.
Due to the mentioned general business conditions, purchasing behaviour is difficult to predict. Companies need to be prepared for fluctuations and equally capable of facing them. One major challenge for companies is therefore to achieve the best possible availability of a product. Together with the challenge to handle fluctuations, the described pressure of timely product availability which is a result of volatile purchasing behaviour is passed along the supply chain to suppliers and subcontractors. Nevertheless, customers expect a high reliability of delivery at all levels.
The phenomena of fluctuation is called the bullwhip effect, described by Forrester (1961). Based on the assumption that every single company acts in an isolated way, it is shown that variations in demand become progressively worse by following up each previous step along the supply chain. Since it takes some time to identify changes in demand, delays are the consequence. Further delays are a result of ordering management, as it takes time to transfer order information. Moreover, variation in demand occurs because the individual company does not know the exact reasons for stock changes upwards the supply chain. Therefore, it is important to create safety buffers by increasing stock levels. Indeed, suppliers receiving an adapted order possibly react by increasing safety buffers themselves.
The individual company alone has only limited opportunities to address fluctuations properly: (i) faster handling of orders, (ii) direct order placement by eliminating the distributor level and (iii) modification of the inventory policy (Forrester, 1961, pp. 33–34).
Thus, due to the dependencies between companies Capgemini (2008) identifies true collaboration as one major challenge for the future supply chain. The major global consultancy claims that true collaboration in the supply chain will be imperative for companies. In order to reduce fluctuations, the coming years will see a new era for industry collaboration, which will become an important factor for future success. In many cases, this will force companies to rethink their areas of competitive advantage (Capgemini, 2008, p. 15).
2. Measuring Supply Chain Performance supply chain. The implementation of standards led to new capabilities in terms of delivery reliability and traceability for supply chain managers. One example are the standards developed by the Association of the German Automotive Industry.
Addressing all the different challenges will require new ways of working, new tool sets and thus new supply chain management capabilities. Supply chain managers should not only look at efficiency, but also understand the potential of innovation and collaboration. If this vision of understanding the potential of innovation and collaboration is to be realised, this will require a change in the mindset on current management capabilities (Capgemini, 2008, p. 15), as will be discussed below.
We can conclude that the described pressure ((i) pressure resulting from reduced safety stocks, (ii) pressure on suppliers, (iii) pressure on product availability) together with a demand for high standards on all levels, make the concept of the supply chain and its management so important. Companies are forced to work together, and close interaction ensures reduced fluctuation across the supply chain (Gunasekaran et al., 2001, p. 71).
2.1.3 Supply Chain Management
Based on all these changing business conditions, the whole topic of supply chain management evolves continuously. Supply chain management needs to contribute to the overall performance of a company.
By definition, supply chain management refers to the design, planning, execution, control and monitoring of supply chain activities with the objective of creating net value, building a competitive infrastructure, leveraging worldwide logistics, synchronising supply with demand and measuring performance globally (Blackstone, 2008, p. 134).
Typically, supply chain management begins with the extraction of raw materials moving through the individual processing stages to the end customer. At the end, the entire process should be optimal in both time and cost. We can state that the main contribution of supply chain management is to help weaken the bullwhip-effect across the supply chain. On the one hand, this includes the use of strategic and tactical design concepts of supply chains, with methods of planning and control on the other. Models can be helpful in monitoring and improving performance of supply chain management activities.
2. Measuring Supply Chain Performance participating unit. All demands and possibilities of covering them are aggregated and matched across the supply chain as illustrated in Figure 6.
Figure 6: Synchronisation of Supply and Demand across the Supply Chain (Schönsleben, 2011, p. 15)
Assuming that companies decide to cooperate, implementing SCOR® helps to achieve a common process understanding between companies. As the individual objectives of quality, cost, delivery and flexibility are partly contradictory, cooperating companies have to achieve a balance between those objectives. The SCOR® reference model describes each task of the implementation.
Looking at SCOR® in detail, it becomes clear that this model is a very important contribution towards creating successful supply chains and cooperation. Nevertheless, to ensure that standardisation does not lead to stagnation, companies need to find an appropriate strategy between standardisation and customisation (Bolstorff, Poluha & Rosenbaum, 2007, p. 341).
2. Measuring Supply Chain Performance improve the capacity utilisation in terms of sales and distribution, materials management and production planning. The use of ERP software is inevitable regardless of the company size.
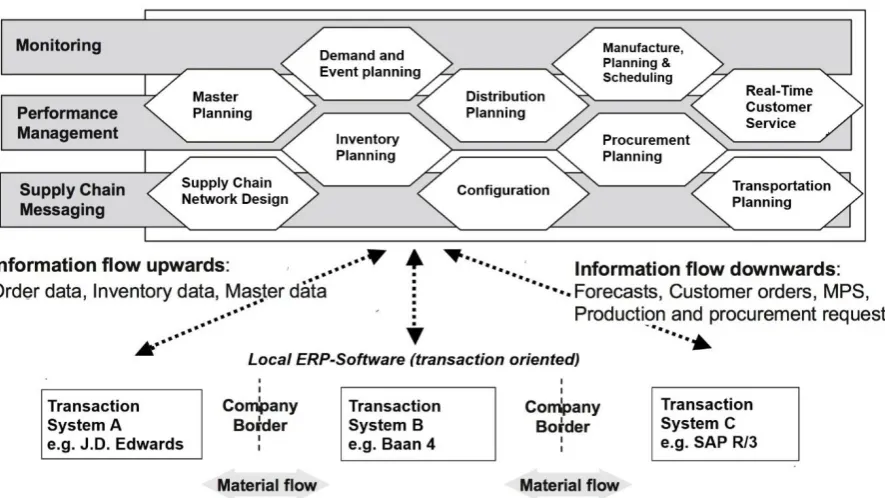
By using supply chain management software, the management of orders and master data still takes place in the local ERP context. Periodically, the supply chain management software receives the data from the local ERP software of each participating company, which is part of a logistics and production chain. The supply chain management software then performs network planning and sends the results back to each of the participating companies. The concept of supply chain management software is illustrated in Figure 7.
Figure 7: Concept of Supply Chain Management Software (Schönsleben, 2011, p. 446)
According to Schönsleben (2011, pp. 446–447), the main tasks of the network planning modules are:
supply chain network design, network inventory planning and real-time customer service.
The appropriate use of supply chain management software requires trust and reliable
relationships among business partners. In his work on supply chain management software,
Máximo J. Ortega (2006) investigates whether appropriate software is available for use. Ortega
criticises the available supply chain management systems in that they deal with situations only
[image:27.595.93.536.239.488.2]2. Measuring Supply Chain Performance highlighted by Jim Hagemann Snabe, the chief executive officer of the software company SAP (a technology leader in this field). According to Hagemann Snabe, the biggest challenge is to look for patterns and to plan more in the future, rather than simply to report on the past (DW Journal, 2013).
Given that companies recognise the importance of their supply chains, they still face difficulties. Such difficulties are the implementation of supply chain management software and a general change in control. Supply chains lead to a change in control from direct ownership to control based on networking, due to the blurring of boundaries between business partners. The integration of a company across interfaces becomes more important. It is no longer the company itself, but the supply chain together with partners that are considered to be important as a competitive unit. Indeed, the individual company must now see its own position as a contribution to competitiveness of a supply chain. Integration also influences the organisation of a company (Min & Zhou, 2002, p. 231), (Drucker, 1998). Instead of a static organisation, companies need to be flexible and demonstrate their ability to deal with agile and temporal forms of organisation (van Hoek, 1998, pp. 187–188). The question arises to what extent controlling and performance measurement in the corporate context can respond to the developments of integration and temporal organisational forms. Van Hoek (1998) even describes this problem of measuring performance in view of the supply chain context as the question of how to “measure the unmeasurable” (van Hoek, 1998, p. 187).
2.2 Performance Measurement Development
2. Measuring Supply Chain Performance Our literature review includes library-based search, internet search via google (google search, google scholar) and querying major electronic databases2. Important keywords are:
Supply Chain, Performance Measurement, Performance Management, and Performance Measures. We focus on performance measurement in a manufacturing environment. Further, we also rely on literature review articles. These kind of articles are very important because of the breadth of available literature on performance measurement. In many cases literature review articles add value because they offer a quintessence of relevant articles on a specific subject. 2.2.1 Evolution of Performance Measurement
In 2004, Gomes, Yasin and Lisboa carried out an extensive literature review on the topic of performance measurement and, in accordance with changing business conditions, provided an analysis of relevant articles published between the years 1988 and 2000. The authors cover a total of 388 published articles. About 40 % of the articles published in this period of time (1988 - 2000) are published by 10 different journals. Completed by library based search and relevant conference proceedings, Gomes et al. (2004) suggest several main stages of performance measurement, summarised as (i) performance measurement solely based on cost accounting, (ii) enrichment of the financial perspective by a non-financial perspective, (iii) development of a balanced integrated approach and (iv) the vision of overall organisational effectiveness (Gomes et al., 2004, p. 523):
Until the 1980s, performance measurement was based solely on cost accounting. The retroactive perspective allowed a comparison of the resulting costs to the once budgeted costs.
Due to the formation of systematic larger organisations, it was necessary to add financial data such as return on investment and a general profit orientation to performance measurement.
Starting in the 1980s, together with the beginning of globalisation, performance measurement was enriched with a non-financial perspective in addition to the financial perspective. As companies first used performance measurement only to improve their internal efficiency and to increase capital attraction, the performance measurement enriched with a non-financial perspective enabled them to scrutinise their entire organisation. Claims from Sink and Tuttle (1989) and Harrington (1991) contradict this development of performance measurement by arguing that it is not possible to manage what cannot be measured (Harrington, 1991, p. 43). Nevertheless, in essence we can state that the topic shifted from being a retroactive to a proactive tool.
2. Measuring Supply Chain Performance In the 1990s, performance measurement became even more proactive as a result of automated operations and the aim of obtaining suitable results to support an optimised organisational responsiveness. This led to a balanced integrated perspective taking into consideration all the stakeholders of an organisation. After comparing two performance measurement systems in companies, Caplice and Sheffi (1995) concluded that “the nonfinancial measures within their systems were recognized by both systems as being the drivers of future performance” (Caplice & Sheffi, 1995, p. 72). Similarly, Eccles (1991) already described a radical shift from “financial figures as the foundation for performance measurement to treating them as one among a broader set of measures” (Eccles, 1991, p. 131). One major tool in this context is the Balanced Scorecard developed by Kaplan and Norton (1992). Initially based on a financial perspective only, the Balanced Scorecard marked a change in that it integrated several dimensions into performance measurement.
Based on the vision of solutions capable to monitor both, each individual resource as well as the overall organisation, a need for a further adaptation in performance measurement is recognised around the year 2000. In the sense of continuous improvement, such performance measurement solutions would not only assess the effectiveness of each individual resource by using very specific measures, but also of the overall organisation by using very brought measures. To conclude, Figure 8 summarises the timeline of performance measurement.
Figure 8: Timeline of Performance Measurement (Gomes et al., 2004, p. 523)
2. Measuring Supply Chain Performance this, main characteristics are "inclusiveness, completeness, timeliness, universality, measurability, consistency, integrity and flexibility" (Gomes et al., 2004, p. 523).
The demand for such tools in performance measurement becomes even more evident by looking closer at recent changes in business conditions. Coming from the focal perspective of a single company, the formation of supply chains and dyadic relationships between companies highlight this turning point of a vision of overall organisational effectiveness in performance measurement. For reasons such as to take all relevant performance factors of the environment into account, the increasing integration of relations with customers and suppliers requires an extended performance measurement that goes beyond the company’s own corporate boundaries (Lambert et al., 1998), (Chenhall, 2005), (Piontek, 2009).
2.2.2 The aim of Overall Organisational Effectiveness
Having identified the turning point of a vision of overall organisational effectiveness in performance measurement, we evaluate the “state of the art” of performance measurement systems. In this respect, as with Bititci, Carrie and McDevitt (1997), performance measurement systems are at the heart of the performance measurement process within companies. Performance measurement systems are associated with reference models containing standard descriptions of management processes, a framework of relationships among the standard processes and metrics to measure process performance. In terms of the metrics, a wide categorisation is to distinguish between financial and non-financial performance measures (Merchant & Van der Stede, 2007).
In their literature review article, Kurien and Qureshi (2011) analyse existing performance measurement systems (so called frameworks) for their strengths and weaknesses in the light of overall organisational effectiveness. Thereby, the authors’ main concern is about overall organisational effectiveness in the sense of supply chain management and measuring performance beyond the individual cooperate boundaries. Specialist books on the subject matter confirm that these models are amongst the most popular performance measurement models and frameworks (Bititci, 2015, pp. 254–262).
The reasons for success or failure of certain models result either from characteristics of the frameworks themselves, or from the use of inappropriate performance measures and design:
2. Measuring Supply Chain Performance According to Kurien and Qureshi (2011, p. 20), appropriate performance measures need to have a clear purpose and need to be easy to use. The metrics should lead to the improvement of performance, rather than just monitoring it. Further, appropriate metrics support the improvement in accordance with the strategic goals of a company. Finally, a clear focus on both, the importance of customers and actions undertaken by competitors, is essential.
The design of a performance measurement system is based on the challenge to find the right measures, to access the right data, and to obtain broad support across the company by creating a common understanding, which in turn ensures permanent refreshing. One can distinguish the variety of existing approaches in (i) balanced models, (ii) quality models, (iii) models based on questionnaires, (iv) hierarchical models and (v) support models (Cagnazzo, Taticchi & Brun, 2010, p. 171).
With its financial and non-financial perspectives, the Balanced Scorecard is clearly an example for a balanced model. Aside from the financial perspective, the Balanced Scorecard includes internal business, innovation and customer perspectives. Balanced models usually show indicators of different categories. By considering every category for possible side-effects, companies may avoid a one-sided optimisation.
2. Measuring Supply Chain Performance
Figure 9: Fundamental ©EFQM Concept (EFQM, 1999)
A useful example of a questionnaire model is TOPP, which was generally developed by studying the manufacturing industry in Norway. This model attempts to measure the performance of a company by using a set of questions. The questionnaire consists of three different parts (general overview, operating of the company, specific areas such as marketing, design, technological planning, etc.). The system measures the performance along three dimensions, namely:
effectiveness (satisfaction of customer needs),
efficiency (economic and optimal use of enterprise resources) and ability to change (strategic awareness for handling changes).
An independent evaluator rates the answers given on three different levels (top management, middle management and manufacturing level) by qualitative evaluation (current status and status in two years) and their importance (Rolstadas, Andersen, Browne & Devlin, 2004).
[image:33.595.87.540.69.302.2]2. Measuring Supply Chain Performance
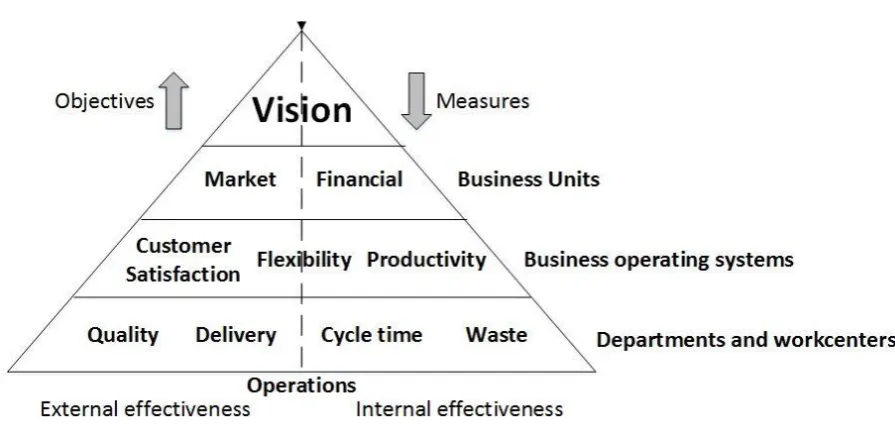
Figure 10: Performance Pyramid (Kippenberger, 1996, p. 10)
Support models do not directly build a performance measurement system but instead support the identification of relevant factors for performance. The Quantitative Model for Performance Measurement Systems by Suwignjo, Bititci and Carrie (2000) is one example in this category. Following Suwignjo et al. (2000, p. 232) the model consists of three steps:
Firstly, factors affecting performance and the possible relationships among them are identified.
Secondly, following hierarchical structuring, the effect of the factors on performance is quantified.
Thirdly, the method from Suwignjo, Bititci and Carrie supports managers by quantifying the level of impact for each factor concerning the overall performance. The described procedure contributes to improvement activities and, given its analysis of relationships, paves the way to a better understanding of dynamics.
2.2.3 Internal and External Benchmarking
As the broad categorisation for the variety of performance measurement systems shows, there is a trend to consider external influences starting around the year 2000. However, just because external influences (customers, suppliers, employees, society) are taken into account, one cannot conclude that the means for external benchmarking are available at the same time. In fact, as framework for analysing supply chain performance evaluation models by Estampe, Lamouri, Paris and Brahim-Djelloul (2013) points out, most models are only suitable for internal benchmarking.
2. Measuring Supply Chain Performance SCOR® reference model is one of the most popular approaches to include supply chain partners. SCOR® is one of few models including an internal and external focus.
Aside from the possibility of standardising the supply chain as referred to above, the SCOR® model also includes ways of measuring overall effectiveness. In their review, Huan, Sheoran and Wang (2004) point out that the SCOR® framework has the potential to become industry standard. It is one of the most common frameworks (Huan et al., 2004, p. 28). There are 12 performance measures classified into the categories (i) delivery reliability, (ii) flexibility and responsiveness, (iii) costs and (iv) assets. Table 1 provides an overview and classifies the performance measures.
Table 1: SCOR® Model Performance Measures (Huan et al., 2004, p. 25)
Delivery reliability Flexibility Costs Assets
Delivery performance Supply chain responsiveness
Total logistics management cost
Cash-to-cash cycle time
Fill rate Production flexibility Value-added employee productivity
Inventory days of supply
Order fulfilment lead
time Warranty costs Asset turns Perfect order
fulfilment
To explain network dynamics across the supply chain, it is possible to integrate software tools. The previously mentioned supply chain management software aims to support supply chain decision-making and profitability. However, as Huan et al. (2004, p. 26) point out, supply chain management software is criticised as being:
very expensive, hard to implement, difficult to use,
sensitive to compatibility problems.
2. Measuring Supply Chain Performance The ENAPS process performance model is another model with both an internal and external focus and was developed by the European Network for Advanced Performance Studies (Estampe et al., 2013), (Rolstadas et al., 2004). The ENAPS approach is based on a network of agents in most European countries. The aim of the project is to introduce a solution for advanced business process performance within the process oriented industry (Rolstadas et al., 2004, p. 1). The development of a benchmarking database is essential to ENAPS, the actual benchmarking of companies itself being performed by agents (Rolstadas, 1998, p. 994). The system includes performance indicators on three different levels:
the enterprise level is very general and suits every manufacturing enterprise.
the process level emerges out of functions or sub-processes. Exemplary indicators are product development efficiency, outgoing delivery quality and average time to solve complaints.
the function level is company specific and grouped under the process levels.
The independent network agents measure indicators on the different levels throughout the company including accounts, product development, marketing and sales, planning and production, customer services, purchasing, personnel and others (Rolstadas et al., 2004, p. 18). Then follows the development of quantitative indicators with regard to time, cost, quality, volume, flexibility and environment (Rolstadas et al., 2004, pp. 19–21).
ENAPS consists of the questionnaire-based approach advanced from the TOPP framework described above. The framework is a top down approach used to develop measures and indicators. In case of the same industry and a comparable manufacturing environment, it becomes possible to compare the own company to others. Thus, the underlying assumption of ENAPS is the existence of an optimum that allows comparability within a particular industry. The optimum is given by the company with the most desirable levels of performance. Following this proposal, all similar companies should use the same set of performance measures that focus on the company itself and its position as compared to competitors. However, this approach does not include aspects related to a network orientation or any collaborative elements.
2. Measuring Supply Chain Performance Moving beyond the described models, the change from dyadic relationships to the formation of complex supply chain networks raises new issues on performance measurement. Clearly, recognising the importance of dyadic relationships alone is not enough. The expansion of the company’s own boundaries towards supply chain integration may only be a first step. Known trends like global sourcing, the internationalisation of distribution and the search for cheap manufacturing labour are factors stimulating the change from dyadic relationships to the design of complex networks (Lambert & Pohlen, 2001). Companies are part of many different supply chains that form a supply chain network. Therefore we point out the transition from a hierarchical structure to a network structure. This means that there seems to be a demand to extend performance measurement in the light of the supply chain network.
2.3 Shortcoming of Performance Measurement in a Supply Chain Network
Next to the emergence of supply chains (the first turning point described in Section 2.2), according to Morgan (2007, p. 255), the second turning point in supply chain performance measurement results from the approximation of supply chains to supply chain networks. Besides the on-going optimisation of value creation together with reduced costs, the removal of trade barriers leads to the creation of large areas of economic cooperation. Due to the development of supply chain networks and the establishment of network cooperation, it is comprehensible why it is important to reflect on being embedded in the supply chain network creating new challenges for performance measurement. This development of extended performance measurement can also be referred to as a shift from “monocultural to polycultural performance measurement” (Morgan, 2007, p. 256). Adding a new stage to the previously presented Figure 8, we expand the timeline of performance measurement as illustrated by Figure 11.
2. Measuring Supply Chain Performance The added stage in performance analysis indicates the change from dyadic relationships across a supply chain towards a network perspective. It is no longer sufficient to focus on few companies in the light of dyadic relationships. The thinking of many different relationships which may even influence one another exceeds the methods used to analyse dyadic relationships. In fact, all participating companies are embedded into a network structure. This concept of structural embeddedness was initially introduced by Polanyi (1944). In our present case of supply chains, structural embeddedness is not only a question of supplier management of large OEMs. From the perspective of each individual company, the term embeddedness refers to the dependence on suppliers and customers. Therefore performance is also the result of relationships with suppliers and customers. To summarise, initially planned dyadic relationships between buyer and supplier evolve as both companies become unwittingly part of a common network (Choi & Kim, 2008). Each company is connected to its own extended network of companies. For example, the supplier is connected to sub-suppliers and other customers. Therefore a buying company is connected not only to its supplier, but also indirectly to the sub-suppliers. As all economic processes are part of networks of relations, companies should pay more attention to the analysis of the network.
Recognising the structural embeddedness and the importance of supply chain networks, we have to assess how existing methods for performance measurement can deal with such changes. As pointed out in Section 2.2, performance measurement has become more comprehensive by providing a more holistic view. Nevertheless, financial indicators and internal benchmarking remain basic.
2.3.1 Extension of Classical Performance Measurement
Identifying the need of a supply chain network perspective, one could try to build on classical instruments of performance measurement. Traditionally it is claimed that performance in an organisational context is the result of the interrelationship between effectiveness, efficiency, quality, productivity, quality of work life, innovation and profitability (Sink & Tuttle, 1989). Performance is then determined by the use of the appropriate measures processed in reports. Accounting reports support traditional elements such as forecasting, budgeting, standard costing, overhead absorption and the calculation of return on investment.
2. Measuring Supply Chain Performance needs of performance measurement in a global business environment. Instead, performance measurement needs to support the manufacturing strategy of a company.
This is why a global business environment reinforces the use of non-financial performance measures (Bourne, Mills, Wilcox, Neely & Platts, 2000, p. 756). Factors such as cost reduction, increased margins, return on assets or stock value need to remain important, but should be combined with non-financial factors. Besides, due to worldwide competition, the achievable prices are often market rather than cost-driven. Hence, companies are very different in terms of targeted markets, their management, products and location. Consequently, Maskell (1991, p. 48) promotes the inclusion of quality, reliability, flexibility, innovation, customer satisfaction in performance measurement and encourages further reflection on social issues.
One comprehensive solution building on the traditional instruments of performance measurement is suggested by Neely et al. (1995, p. 81). Their basic idea is to consider the changing business conditions by creating a model that includes several perspectives. In accordance with the adaptation of the Balanced Scorecard, their performance measurement takes place on three different levels, namely (i) the level of individual performance measures, (ii) the level that combines a set of performance measures for the entire performance measurement system and (iii) the level of relationships between the system and the environment of a company.
The first level of individual performance measures specifies the measures to use. On this level, terms like quality, time, cost and flexibility are important. The second level is about different perspectives with equal importance. The Balanced Scorecard is an appropriate tool to bring internal (organisational) and external (market) dimensions together. According to Neely et al. (1995), Lambert and Pohlen (2001), companies tend to ignore external comparisons and non-financial targets. Therefore, the external dimension on the third level is about the inclusion of aspects of the market environment such as customer satisfaction and competition.
Nevertheless we note that the question persists whether a more comprehensive model satisfies the increasing demands of performance measurement for networks, where the individual boundaries of companies are eliminated. A Balanced Scorecard integrating external aspects and performance measures on three different levels still focuses on the individual company in its own right:
The Balanced Scorecard has no clear competitive view. The question of how a company performs with regard to its competitors cannot be answered.
2. Measuring Supply Chain Performance Supply chain management might be misinterpreted as extension of logistics.
From a supply chain perspective, performance measurement has become very interdisciplinary including strategy, marketing, operational research and logistics. Neely et al. (1995) put a clear strategy focus beside a solution for short-term thinking,
local optimisation and changing business conditions on the research agenda often missing in Balance Scorecards.
Several perspectives together, combining too much information, risk to blur what is really important for performance measurement (Papakiriakopoulos & Pramatari, 2010, p. 1299).
2.3.2 A Common Performance Measurement System
Papakiriakopoulos and Pramatari (2010) propose a quite sophisticated idea which is the development of one common performance measurement system. Collaboration across the supply chain clearly has some potential. Nevertheless, the development of a common performance measurement system is not only about the identification of relevant measures and the potential of collaboration. Besides the difficulty to identify appropriate measures in the supply chain context, the sharing of information is a basic requirement. Only by implementing information sharing processes, it is possible to gain advantage from collaboration. Even if collaborating companies maintain information sharing, further difficulties because of technical and managerial issues may arise.
Beamon (1999, p. 280) suggests to add performance measures that focus on strategic aspects such as the measurement of resources, output and flexibility, in order to look beyond measures of logistics.
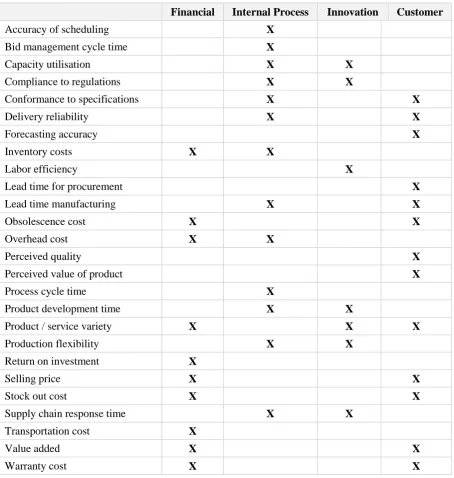
2. Measuring Supply Chain Performance Table 2: Metrics in the Supply Chain (Gunasekaran & Kobu, 2007, p. 2833)
Financial Internal Process Innovation Customer
Accuracy of scheduling X
Bid management cycle time X
Capacity utilisation X X
Compliance to regulations X X
Conformance to specifications X X
Delivery reliability X X
Forecasting accuracy X
Inventory costs X X
Labor efficiency X
Lead time for procurement X
Lead time manufacturing X X
Obsolescence cost X X
Overhead cost X X
Perceived quality X
Perceived value of product X
Process cycle time X
Product development time X X
Product / service variety X X X
Production flexibility X X
Return on investment X
Selling price X X
Stock out cost X X
Supply chain response time X X
Transportation cost X
Value added X X
Warranty cost X X
[image:41.595.86.541.88.567.2]2. Measuring Supply Chain Performance measurement still has a supply chain focus rather than a real network focus. Both technical barriers, as well as concerns (e.g. lack of trust) in the participating companies themselves limit the application. Assuming that the quality of information is ensured, an increasing number of companies needs to be integrated in a common platform. The technical integration, as well as the requirement of mutual trust are difficult to obtain.
2.3.3 Towards an Advancement in Performance Measurement
2. Measuring Supply Chain Performance Table 3: Morphological Analysis for a Network-oriented Approach in
Performance Measurement
Parameters Parameter expressions
Relationships dyadic network
Financial data n/a exclusively combined part
Most relevant issues quality reliability flexibility innovation customer satisfaction
social issues Perspective internal perspective
(organisational)
external perspective (market) Inclusion of the
environment customers suppliers competitors entire network Levels of measurement individual
(company specific)
several dimensions of equal importance
market conditions (environment) Interdisciplinary focus
(strategy) strategy marketing
operational
research logistics Psychological
perspective short term thinking long term thinking Collaborative thinking
(share information) local optimisation
optimisation in the larger context (keep things balanced) Handling of supply chain
measures n/a easy to use complex to use
Process alignment n/a encourage process
alignment complex to realize
2.4 Justification of Literature Research Results
Up to this point, we worked-out the demand to extend performance measurement in the light of the supply chain network. These insights are confirmed if we look at a comprehensive literature synthesis on performance measurement and its future challenges. In their literature review article, Bititci, Garengo, Dörfler and Nudurupati (2012) point out several research gaps in performance measurement and identify which lines of enquiry generally need to be pursued.
In combination to our literature review, this literature review article by Bititci et al. (2012) adds value because the article covers a very broad literature base on the topic of performance measurement. Mapped against a timeline, Bititci et al. (2012) bring literature on performance measurement in line with the literature on global business trends. Such work can only be done by a multidisciplinary team. We can benefit from their results in order to ensure timeliness and completeness of our argument made by literature research.