International Journal of Emerging Technology and Advanced Engineering
Website: www.ijetae.com (ISSN 2250-2459, ISO 9001:2008 Certified Journal, Volume 4, Issue 6, June 2014)
716
An Approach to Vendor Selection: A Case Study
Ravindra Mohan
1, Lavlesh Kumar Sharma
21Assistant Professor, Mechanical Engineering Deptt. & ATPO, Training an Placement Deptt. SATI, Vidisha (M.P.)
2Student, M.Tech. in Computer Integrating Manufacturing, SATI, Vidisha (M.P.)
Abstract— In such a competitive market Vendor selection is one of the important tasks in any organization. By better realization we know the Vendor selection is not just going through the price lists of several vendors because it includes various factors in choosing a most suitable vendor. This paper explores a better understanding about the several attributes or criteria and their sub criteria and suggests a framework and its development to understand how we can weigh by a detailed and well analyzed case study. Paper also provides the way to analyze data and its validity with a case study. Model make you understand about Relative Importance of several criteria so that one can choose the most suitable vendor from the given of line of vendors.
Keywords— AHP, Vendor selection Model, Multi criteria Decision Making (MCDM), Pair-wise C omparison M atrices (PCMs).
I. INTRODUCTION
In very early days of industrial revolution, vendor selection was an easy task due enough monopoly or very less competitors and consumer demand without any specific features. But today, many organizations are facing rapid changes stimulated by technological innovations and changing customer’s demands with higher & higher expectations along with lesser prices. Since selection of vendor does not mean checking of price lists of several vendors. These organizations realize that the effort to obtain products at the right cost, in the right quantity, with the right quality at the right time from the right source is crucial for their survival (Oboulhas et al., 2004). Therefore, an efficient vendor selection process needs to be in place and of paramount importance for successful supply chain management (Sonmez, 2006). It begins with the realization of the need for a good vendor; determination and formulation of decision criteria; pre-qualification (initial screening and drawing up a shortlist of potential vendors from a large list); final vendor selection; and the monitoring of the vendors selected (i.e. continuous evaluation and assessment).
Evaluation and selection of vendors are a typical multiple criteria decision making (MCDM) problem involving multiple criteria that can be both tangible and intangible.
The analysis of criteria for selecting and measuring the performance of vendor has been the focus of many researchers and purchasing practitioners as to provide a comprehensive view of the important criteria in the vendor selection decision (Noorul Haq and Kannan, 2006). Vendor selection process requires a f o r m a l , systematic and rational selection model. In this study, a very comprehensive application of Analytic Hierarchy Process (AHP) for a case is presented along with sensitivity analysis to choose the best vendor.
II. DEVELOPMENT OF THE VSM
Development of the vendor selection model includes the establishment of vendor selection criteria, development of the respondent sample base, construction of the AHP model, design of an evaluation of vendors, respondent interview, analysis of the questionnaire result and finally, synthesis of the model. The model must be flexible and simple in performance, easy to review, adaptable for both individual and group, and does not require inordinate specialization to master and communicate. This chapter discusses the development and formulation of the vendor selection model (VSM).
The development of the VSM was based on the previously obtained vendor selection criteria that were identified as a result of literature search and by examining the selection criteria of the public sector. These criteria were used as main factors that must be considered during the vendor selection process. Careful consideration of these criteria will contribute to establishment of minimum and acceptable requirements, and ultimately lead to the selection of the best vendor.
III. FORMATION OF THE VENDOR SELECTION CRITERIA
To ensure the effectiveness of the model, the predetermined criteria and sub- criteria must be objective. In order to meet the user's full satisfaction, these criteria must be positively satisfying the main goal of the process to select the best vendor.
International Journal of Emerging Technology and Advanced Engineering
Website: www.ijetae.com (ISSN 2250-2459, ISO 9001:2008 Certified Journal, Volume 4, Issue 6, June 2014)
717
IV. LIST PROSPECTIVE VENDORS
Once the selection main measures criteria and sub-criteria are identified, then the next step in developing the VSM is to list the candidates available for selection alternatives (the prospective vendors). These alternatives (vendors) can be obtained using the predetermined list of vendors in the ministry of finance. The number of listed vendors should not be less than three vendors to conduct a wide and fair prequalification.
V. BUILDING THE AHPMODEL
Because of the complexity of the prevailing selection process in dealing with may be myriad or endless factors that affect the achievement of goal and consistency of judgments of selecting the best vendor, AHP was used to solve the selection model. The complexity of the selection process can be handled and best understood by applying the principle and techniques of AHP, breaking it down into its constituent elements, structuring elements hierarchically, and then composing, or synthesizing judgments on the relative importance of the elements at each level of the hierarchy into a set of overall priorities.
AHP
Figure: 1
The nine-point scale as suggested by Saaty (1990) is used to assign pair-wise comparisons of all elements at each level of the hierarchy (Table 1). As suggested by Saaty (1990), the geometric mean approach, instead of the arithmetic approach, is used to combine the individual pair-wise comparison matrices (PCMs) to obtain the consensus PCMs for the entire team.
Table: 1
The fundamental scale, a scale of absolute numbers used to assign numerical values mad by comparing two elements
Adopted from Saaty (1990)
Intensity of importance
Definition Explanation
1 Equal
Importance
Two activities contribute equally to
the objective
3 Moderate
importance
Experience and judgment slightly favor one activity over
another
5 Strong
importance
Experience and
judgment strongly favor on activity over another
7 Very strong or
demonstrated
importance
An activity is favored
very strongly over another. Its dominance demonstrated in practice
9 Extreme
importance
The evidence favoring one activity over another is of the highest degree
possible of affirmation
2,4,6,8 Intermediate values
Used to represent compromise between the preferences listed above
Reciprocal s
Reciprocals for inverse comparison Level 1: Goal
Level 2: Criteria
Level 3: Sub Criteria
International Journal of Emerging Technology and Advanced Engineering
Website: www.ijetae.com (ISSN 2250-2459, ISO 9001:2008 Certified Journal, Volume 4, Issue 6, June 2014)
718
Essentially, the technique employs pair-wise comparisons of selection criteria so as to enhance objectivity and downplay too much subjectivity (Saaty, 1990). Pair- wise comparison forces the decision maker to compare each criterion with all the remaining ones.
VI. RESULTS AND ANALYSIS
By means of a case study, this paper provides fundamental guidelines for vendor selection analysis with the help of formation of AHP (Analytical Hierarchy Process) and mentions some results on basis of Relative Importance Analysis. The respondents were asked to provide their opinions on the importance of the vendor selection criteria used in the public sector by scores 1 to 5, where 1 represents the least important and 5 the most important. To determine the relative ranking of the factors, these scores were thon transformed to important indices based on the formula:
Formula Relative importance Index:
∑w
AN = 5n5+ 4n4+ 3n3+ 2n2+ 1n1
5N
Where W is the weighting given to each factor by the respondent, ranging from 1 to 5,
[image:3.612.293.561.131.723.2](n1 = number of respondents for Unimportant, n2 = number of respondents for Little Importance , n3 = number of respondents for Moderately Important , n4 = number of respondents for Important , n5 = number of respondents for Very Important. A is the highest weight (i.e. 5 in the study) and N is the total number of samples. The relative importance index ranges from 0 to 1.
Table 2
Relative importance Index and ranks for each sub-criterion part I
N o.
C ri te ri a
Public Sector
Vendor all
R.I
Sub
-F
ield
R
a
nk
R.I
Sub
-F
ield
R
a
nk
R.I
A
ll
F
ield
R
a
nk
I: Quality
1 1 Product durability 0.9167 1 0.7667 2 0.8952
2 2 Product reliability 0.8889 2 0.7667 3 0.8714
3 3 Quality systems 0.8000 3 0.7667 4 0.7952
4 4 Percent rejection 0.5722 6 0.6667 5 0.5857
5 5 Adherence to quality tools
0.6944 5 0.5000 6 0.6667
6 6 Reputation and position in the market
0.7500 4 0.9000 1 0.7714
II: Price
7 1 Competitive pricing 0.9500 1 0.6333 2 0.9048
8 2 Total cost 0.7000 3 0.5333 5 0.6762
9 3 Quantity discount 0.7444 2 0.5667 4 0.7190
10 4 Payment terms 0.6000 5 0.6333 3 0.6048
11 5 Payment procedures understanding
0.6778 4 0.8667 1 0.7048
III: Service
12 1 Spare parts availability 0.8889 1 0.9000 1 0.8905
13 2 Handling of complaints
0.5500 6 0.7667 5 0.5810
14 3 Ability to maintain product/service
0.8444 3 0.8333 2 0.8429
15 4 After sales services 0.8611 2 0.7667 3 0.8476
16 5 Training aids 0.5667 5 0.5333 6 0.5619
17 6 Flexibility 0.6500 4 0.7667 4 0.6667
IV: Business overall performance
18 1 Financial stability 0.6778 4 0.8000 1 0.6952
19 2 Quality performance 0.7943 2 0.6000 6 0.7659
20 3 Knowledge of the market
0.8333 1 0.7333 3 0.8190
21 4 Information systems 0.6889 3 0.7000 4 0.6905
22 5 Management capability 0.6778 5 0.7667 2 0.6905
23 6 Performance history 0.5889 6 0.7000 5 0.6048
V: Technical capability 24 1 Offering technical
support
0.7500 3 0.9000 1 0.7714
25 2 Technical know (how know why)
0.7444 4 0.8333 3 0.7571
26 3 Understanding of technology
0.6500 5 0.8000 5 0.6714
27 4 Responsiveness 0.7833 2 0.8333 2 0.7905
28 5 Personnel capabilities 0.8056 1 0.8000 4 0.8048
VI: Delivery
29 1 Delivery lead time 0.8229 3 0.8000 4 0.8195
30 2 Delivery speed 0.8857 2 0.8000 3 0.8732
31 3 Upcoming delivery commitments
0.9056 1 0.5000 6 0.8476
32 4
Ability and willingness to expedite
an order
0.7889 4 0.9333 1 0.8095
33 5 Safety and security components
0.7611 5 0.8333 2 0.7714
34 6 Modes of
transportation facility
International Journal of Emerging Technology and Advanced Engineering
Website: www.ijetae.com (ISSN 2250-2459, ISO 9001:2008 Certified Journal, Volume 4, Issue 6, June 2014)
719
VII. STATISTICAL RESULTS FOR PART I
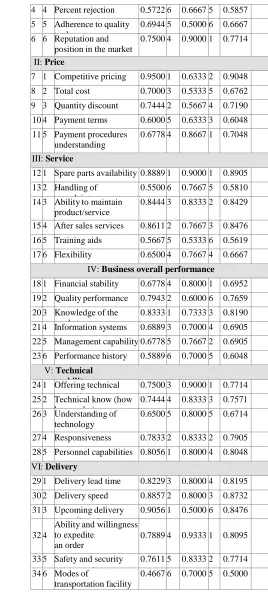
The decision makers in the public sector and the vendors were asked regarding their points of view about the selection criteria upon which the major criteria influencing the vendor selection process. Table: 2 shows the statistical results including relative index (R.I), sub field rank and field rank respondents by the public sector and vendor points of view.
Statistical Results Discussion Part I
I. Quality:
1.The public sector respondents rank Product durability (i.e. Lifespan) as the first positions with a relative index value equal 0.9167, and vendor respondents rank as second positions with a relative index value equal 0.7667, and in all fields is listed as the second position with a relative index value equal 0.8952
2.The public sector respondents rank Product reliability (e.g., quality over a given period of time, consistency) as second positions with a relative index value equal 0.8889, and vendor respondents rank as third positions with a relative index value equal 0.7667, and in all fields is listed as the fifth position with a relative index value equal 0.8714
3.The public sector respondents rank Quality systems as third positions with a relative index value equal 0.8000, and vendor respondents rank as forth positions with a relative index value equal 0.7667, and in all fields is listed as the eleventh position with a relative index value equal 0.7952
4.The public sector respondents rank Percent rejection as sixth positions with a relative index value equal 0.5722, and vendor respondents rank as fifth positions with a relative index value equal 0.6667, and in all fields is listed as the twenty five position with a relative index value equal 0.5857
5.The public sector respondents rank adherences to quality tools (e.g., check sheet, histogram, cause-and-effect diagram) î as the sixth positions with a relative index value equal 0.6944, and vendor respondents rank as the fifth positions with a relative index value equal 0.5000, and in all fields is listed as the twenty three position with a relative index value equal 0.6667
6. The public sector respondents rank Reputation and position in the market as forth positions with a relative index value equal 0.7500, and vendor respondents rank as the first positions with a relative index value equal 0.9000, and in all fields is listed as the fourteenth position with a relative index value equal 0.7714
II. Price:
1. The public sector respondents rank Competitive pricing as the first positions with a relative index value equal 0.9500, and Vendor respondents rank as the second positions with a relative index value equal 0.6333, and in all fields is listed as the first position with a relative index value equal 0.9048. 2. The public sector respondents rank Total cost as the
third positions with a relative index value equal 0.7000, and vendor respondents rank as the fifth positions with a relative index value equal 0.5333, and in all fields is listed as the twenty one position with a relative index value equal 0.6762
3. The public sector respondent’s rank Quantity discount as the second positions with a relative index value equal 0.7444, and vendor respondent’s rank as the fourth positions with a relative index value equal 0.5667, and in all fields is listed as the seventeenth position with a relative index value equal 0.7190
4. The public sector respondents rank Payment terms as the fifth positions with a relative index value equal 0.6000 and vendor respondents rank as the third positions with a relative index value equal 0.6333, and in all fields are listed as the twenty four position with a relative index value equal 0.6048
5. The public sector respondents rank Payment procedures understanding as the fourth positions with a relative index value equal 0.6778, and vendor respondent’s rank as the first positions with a relative index value equal 0.8667, and in all fields is listed as the eighteenth position with a relative index value equal 0.7048
III. Service:
International Journal of Emerging Technology and Advanced Engineering
Website: www.ijetae.com (ISSN 2250-2459, ISO 9001:2008 Certified Journal, Volume 4, Issue 6, June 2014)
720
2.The public sector respondents rank Handling of complaints as the sixth positions with a relative index value equal 0.5500, and vendor respondents rank as the fifth positions with a relative index value equal 0.7667, and in all fields is listed as the twenty sixth position with a relative index value equal 0.5810
3.The public sector respondents rank Ability to maintain product/service as the third positions with a relative index value equal 0.8444, and vendor respondents rank as the second positions with a relative index value equal 0.8333, and in all fields is listed as the seventh position with a relative index value equal 0.8429
4.The public sector respondents rank after sales services (e.g., warranties and claims policies) as the second positions with a relative index value equal 0.8611, and vendor respondent’s rank as the third positions with a relative index value equal 0.7667, and in all fields is listed as the sixth position with a relative index value equal 0.8476
5.The public sector respondents rank Training aids as the fifth positions with a relative index value equal 0.5667, and vendor respondents rank as the sixth positions with a relative index value equal 0.5333, and in all fields is listed as the twenty seventh position with a relative index value equal 0.5619 6.The public sector respondents rank Flexibility
(payment, freight, price reduction, order frequency & amount) as the fourth positions with a relative index value equal 0.6500, and vendor respondents rank as the fourth positions with a relative index value equal 0.7667, and in all fields is listed as the twenty three position with a relative index value equal 0.6667
IV. Business overall performance:
1.The public sector respondents rank Financial stability as the forth positions with a relative index value equal 0.6778, and vendor respondents rank as the first positions with a relative index value equal 0.8000, and in all fields is listed as the nineteenth position with a relative index value equal 0.6952 2.The public sector respondents rank Quality
performance (e.g., ISO 9000 accreditation) as the second positions with a relative index value equal 0.7943, and vendor respondents rank as the sixth positions with a relative index value equal 0.6000, and in all fields is listed as the fifteenth position with a relative Index value equal 0.7659
3. The public sector respondents rank Knowledge of the market as the first positions with a relative index value equal 0.8333, and vendor respondents’ rank as the third positions with a relative index value equal 0.7333, and in all fields is listed as the ninth position with a relative index value equal 0.8190
4. The public sector respondents rank Information systems as the third positions with a relative index value equal 0.6889, and vendor respondents rank as the forth positions with a relative index value equal 0.7000, and in all fields is as the twenty position with a relative index value equal 0.6905
5. The public sector respondents rank Management capability as the fifth positions with a relative index value equal 0.6778, and vendor respondents rank as the second positions with a relative index value 0.7667equal , and in all fields is listed as the twenty position with a relative index value equal 0.6905
6. The public sector respondents rank Performance history as the sixth positions with a relative index value equal 0.5889, and vendor respondents rank as the fifth positions with a relative index value equal 0.7000, and in all fields is listed as the twenty forth position with a relative index value equal 0.6048
V. Technical capability
1. The public sector respondents rank offering technical support as the third positions with a relative index value equal 0.7500, and vendor respondents’ rank as the first positions with a relative index value equal 0.9000, and in all fields is listed as the fourteenth position with a relative index value equal 0.7714
2. 2. The public sector respondents rank Technical know (how know why) as the forth positions with a relative index value equal 0.7444, and vendor respondents rank as the third positions with a relative index value equal 0.8333, and in all fields is listed as the sixteenth position with a relative index value equal 0.7571
International Journal of Emerging Technology and Advanced Engineering
Website: www.ijetae.com (ISSN 2250-2459, ISO 9001:2008 Certified Journal, Volume 4, Issue 6, June 2014)
721
4.The public sector respondents rank Responsiveness as the second positions with a relative index value equal 0.7833, and vendor respondent’s rank as the second positions with a relative index value equal 0.8333, and in all fields is listed as the thirteenth position with a relative index value equal 0.7905 5.The public sector respondents rank Personnel
capabilities as the first positions with a relative index value equal 0.8056, and vendor respondents rank as the forth positions with a relative index value equal 0.8000, and in all fields is listed as the eleventh position with a relative index value equal 0.8048
VI. Delivery:
1.The public sector respondents rank Delivery lead time as the third positions with a relative index value equal 0.8229, and vendor respondents rank as the forth positions with a relative index value equal 0.8000, and in all fields is listed as the eight position with a relative index value equal 0.8195
2.The public sector respondents rank Delivery speed as the second positions with a relative index value equal 0.8857, and vendor respondent’s rank as the third positions with a relative index value equal 0.8000, and in all fields is listed as the fourth position with a relative index value equal 0.8732
3.The public sector respondents rank Upcoming delivery commitments as the first positions with a relative index value equal 0.9056, and vendor respondents rank as the sixth positions with a relative index value equal 0.5000, and in all fields is listed as the sixth position with a relative index value equal 0.8476
4.The public sector respondents rank Ability and willingness to expedite an order as the forth positions with a relative index value equal 0.7889, and vendor respondents rank as the first positions with a relative index value equal 0.9333, and in all fields is listed as the tenth position with a relative index value equal 0.8095
5.The public sector respondents rank Safety and security components as the fifth positions with a relative index value equal 0.7611, and vendor respondents rank as the second positions with a relative index value equal 0.8333, and in all fields is listed as the fourteenth position with a relative index value equal 0.7714
6. The public sector respondents rank Modes of transportation facility as the sixth positions with a relative index value equal 0.4667, and vendor respondents rank as the fifth positions with a relative index value equal 0.7000, and in all fields is listed as the twenty eighth position with a relative index value equal 0.5000
VIII. STATISTICAL RESULTS FOR PART II
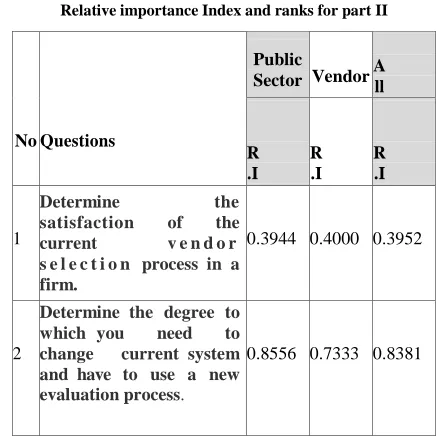
[image:6.612.332.551.327.546.2]The decision makers in the public sector and the vendors were asked regarding their points of view in relative to their importance in the vendor selection process. Table (3) shows the statistical results including relative index (R.I), sub field rank and field rank respondents by the public sector and vendor points of view.
Table 3
Relative importance Index and ranks for part II
No Questions
Public
Sector Vendor All
R .I
R .I
R .I
1
Determine the
satisfaction of the
current v e n d o r
s e l e c t i o n process in a firm.
0.3944 0.4000 0.3952
2
Determine the degree to which you need to change current system and have to use a new evaluation process.
0.8556 0.7333 0.8381
Statistical Results Discussion (Appendix,Part II):
International Journal of Emerging Technology and Advanced Engineering
Website: www.ijetae.com (ISSN 2250-2459, ISO 9001:2008 Certified Journal, Volume 4, Issue 6, June 2014)
722
IX. STATISTICAL RESULTS FOR THE MAIN CRITERIA
PART III
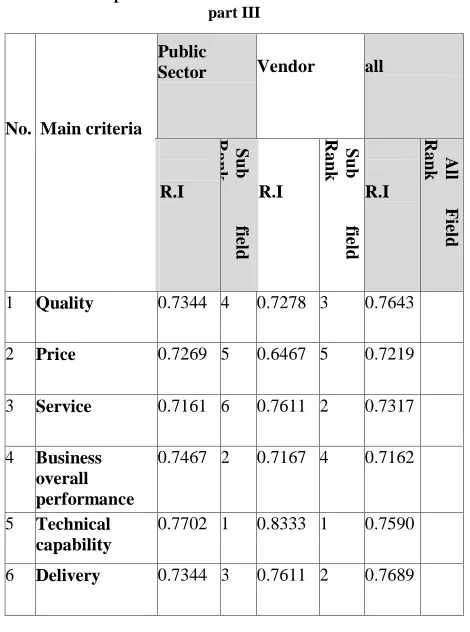
1. The public sector respondents rank Price as the fifth positions with a relative index value equal 0.7269, and vendor respondent’s rank as the fifth positions with a relative index value equal 0.6467, and in all field is listed as the fifth position with a relative index value equal 0.7219
[image:7.612.51.286.335.651.2]2. The public sector respondents rank Service as the sixth positions with a relative index value equal 0.7161, and vendor respondent’s rank as the second positions with a relative index value equal 0.7611, and in the overall claim causes (all field ranks) it is listed as the forth position with a relative index value equal 0.7317
Table 4
Relative importance Index and ranks for the main criteria part III
No. Main criteria Public
Sector Vendor all
R.I
S
u
b
field
Ra
n
k
R.I
S
u
b
field
Ra
n
k
R.I
A
ll
Fi
el
d
R
a
n
k
1 Quality 0.7344 4 0.7278 3 0.7643
2 Price 0.7269 5 0.6467 5 0.7219
3 Service 0.7161 6 0.7611 2 0.7317
4 Business
overall performance
0.7467 2 0.7167 4 0.7162
5 Technical capability
0.7702 1 0.8333 1 0.7590
6 Delivery 0.7344 3 0.7611 2 0.7689
3. The public sector respondents rank Business overall performance as the second positions with a relative index value equal 0.7467, and vendor respondents rank as the forth positions with a relative index value equal 0.7167, and in all field is listed as the sixth position with a relative index value equal 0.7162
4.The public sector respondents rank Technical capability as the first positions with a relative index value equal 0.7702, and vendor respondents rank as the first positions with a relative index value equal 0.8333, and in all field is listed as the third position with a relative index value equal 0.7590
5.The public sector respondents rank Delivery as the third positions with a relative index value equal 0.7344, and vendor respondent’s rank as the second positions with a relative index value equal 0.7611, and in all field is listed as the first position with a relative index value equal 0.7689
X. CONCLUSION
This paper provides the basic guidelines and ways to analyze most suitable vendor from the given alternatives through AHP by Relative Importance Index analysis for several factors or criteria, sub-criteria and also for some question which are considerable during analysis. Here we are concluding this paper with some statistical results of questionnaires of a case study from public sectors, vendors and all points of view given as the above.
XI. RECOMMODATIONS
Based on the result of application of V S M , it is recommended to use the VSM for the following reasons:
The model can be used in the evaluation and selection of the best vendor.
The model can represent a framework that can be used in the all sectors.
The MATLAB program will help to select vendor.
REFERENCES
[1] Atthirawong, W. (2002), "An Application of the Analytical
Hierarchy Process to International Location Decision-Making", in Gregory, Mike, Proceedings of The 7th Annual Cambridge International Manufacturing Symposium: Restructuring Global Manufacturing, Cambridge, England: University of Cambridge, pp. 1-18
[2] Bello, Marlene (2003) "A case study approach to the vendor
selection process", [Master dissertation], University of Puerto Rico. [3] Belton V. (1990) "Multiple criteria decision analysis: practically the
only way to choose in" Hendry LC, Eglese RW, editors. Operational research tutorial papers. pp. 53-102.
[4] Belton, V. and Stewart, T.J. (2002) "Multiple criteria decision
analysis: An integrated approach." Boston/Dordrecht/London:
Kluwer academic publishers.
[5] Berrittella, M. (2007) "An Analytic Hierarchy Process for the
International Journal of Emerging Technology and Advanced Engineering
Website: www.ijetae.com (ISSN 2250-2459, ISO 9001:2008 Certified Journal, Volume 4, Issue 6, June 2014)
723
[6] Chan F. T. S.(2003) "Interactive selection model for vendor
selection process: an analytical hierarchy process approach", International Journal of Production Research, vol. 41, no. 15, 3549-3579.
[7] Chan F. T. S. and Chan H. K. (2004) "Development of the
vendor selection model a case study in the advanced technology industry", Journal of Engineering Manufacture Vol. 218 Part B. [8] Chankong, V. and Haimes, Y.Y., (1983) "Multiobjective
Decision Making: theory and Methodology". North Holland, New York.
[9] Choi, T.Y. and Hartley, J.L., (1996) "An exploration of vendor selection practices across the supply chain." Journal of Operations Management, 14, 333-343.
[10] Davidrajuh, Reggie (2000) Automating vendor selection procedures.
[Doctoral dissertation], Narvik Institute of Technology, Narvik, Norway.
[11] De Steiguer, J.E. (2003), “The Analytic Hierarchy Process as a
Means for Integrated Watershed Management", in Renard, Kenneth G., First Interagency Conference on Research on the Watersheds, Benson, Arizona: U.S. Department of Agriculture, Agricultural Research Service, pp. 736-740.
[12] Dey, P. K. (2003). "Analytic Hierarchy Process Analyzes Risk
of Operating Cross-Country Petroleum Pipelines in India". Natural Hazards Review 4 (4) 213-221. Retrieved on 2007-08-20.
[13] DTER, (2000) "multi-criteria analysis manual."
DTER, London.
www.communities.gov.uk/embedded_object.asp?id=1142252
[14] Dickson, “An Analysis of vendor selection systems and
decisions”, Journal of Purchasing, 1966, pp. 5-17.
[15] Garfamy R. M. (2005) "Vendor Selection and Business Process
Improvement" [Doctoral Thesis Proposal], University of Autonoma De Barcelona.
[16] Ghodsypour, S. H. and OíBrien, C. (2001), ìThe total cost of
logistics in vendor selection, under conditions of multiple sourcing, multiple criteria and capacity constrainsî, International Journal of Production Economics, Vol. 73, pp.15-27.
[17] Grandzol, J. R. (2005). "Improving the Faculty Selection
Process in Higher Education: A Case for the Analytic Hierarchy Process". IR Applications 6. Retrieved on 2007-08-21.
[18] Larson, C. D. (2007), "Application of the Analytic Hierarchy
Process to Select Project Scope for Video logging and Pavement Condition Data Collection", 86th Annual Meeting Compendium of Papers CD-ROM, Transportation Research Board of the National Academies.
[19] Liu, F.H. and Hai, H.L. (2005) "The voting analytic hierarchy process method for selecting vendor" International Journal of Production Economics, In press, Corrected Proof, Available online 14 January 2005.
[20] Malczewski, J.,(1999) "GIS and Multicriteria Decision Analysis" John Wiley and Sons, New York.
[21] McCaffrey, J. (2005). "Test Run: The Analytic Hierarchy Process". MSDN Magazine. Retrieved on 2007-08-21.
[22] Noorul Haq A. and Kannan G. (2005) " Fuzzy analytical
hierarchy process for evaluating and selecting a vendor in a supply chain model", International Journal of Advanced Manufacturing Technology, 29:826-835.
[23] Noorul Haq A. and Kannan G. (2006) "An Integrated approach
for selection a vendor using Grey Relational Analysis", International Journal of Information Technology & Decision Making, Vol. 5, No. 2 277-295.
[24] Oboulhas C., Xiaofei X., Zhan D. and Sha L. (2003) “An
integrated model for vendor selection process.” J. Harbin Institute of Technology 10(1) 43-50.
[25] Oboulhas O., Xiaofei X., and Zhan D. (2004). "A decision
support system for vendor selection process", International Journal of Information Technology & Decision Making Vol. 3, No.3 453-470 World Scientific Publishing Company.
[26] Palaneeswaran E. Ng S.T., Kumaraswamy M. and Chan W.H.K.
(2006) "Analytic Hierarchy Process Based Vendor Selection Framework for Construction Contractors", The construction and building research conference of the Royal Institution of Chartered Surveyors, http://www.rics.org/NR/rdonlyres/.
[27] Saaty, T. L. and Vargas L. G. (2005), "The possibility of group welfare functions", International Journal of Information Technology & Decision Making 4(2) 167-176.
[28] Saaty, T. L. and Vargas L. G. (1991), "Prediction, Projection and Forecasting in Applications of the Analytical Hierarchy Process in Economics, Finance, Politics, Games and Sports" Kluwer Academic Publishers, Boston, 1991.
[29] Saaty, T. L., (2001) “Decision making in complex environments:
the analytic network process for decision making with dependence and feedback”, RWS Publications, USA.
[30] Saaty, T. L., (1990) "How to make a decision: The analytic
hierarchy process.", European Journal of Operational Research, 48:9-26.
[31] Saaty, T. L. (1996) "Multi-criteria Decision Making: The
analytic hierarchy process: planning, priority setting, resource allocation." Pittsburgh.
[32] Saaty, T. L. (1980) "The analytic hierarchy process: planning, priority setting, resource allocation." McGraw-Hill, New York .
[33] Sonmez, Mahmut (2006) "A Review and Critique of Vendor
Selection Process and Practices.", Occasional Papers Series,
Loughborough University, UK.
www.lboro.ac.uk/departments/bs/research/2006-1.pd
[34] SPSS (2012), "Statistical Package for the Social Science", version 20, SPSS Inc.
[35] Saaty, The Analytic Hierarchy Process. NY: McGraw-Hill, 1980.
[36] Weber, C. A., Current, J. R. and Benton, W.C. (1991). "Vendor selection criteria and methods", European Journal of Operational Research 50(1)2-18.
[37] Weber, C. A., Current, J. and Desai, A. (1998)
“Non-cooperative negotiation strategies for vendor selection.” European Journal of Operational Research,108(1): p. 208-223. [38] Weber, C. A., Current, J. and Desai, A. (2000) "An optimization
approach to determining the number of vendors to employ.", Supply Chain Management: An International Journal, 5(2): p. 90-98.
[39] Weber C. A. and Ellram L. M.(1992) "Vendor selection using
multi-objective programming: A decision support system approach" Int. J. Physical Distribution & Logistics Management 23(2) (1992) 3-14.
[40] Weber, Current and Benton, “Vendor Selection criteria and