R E S E A R C H A R T I C L E
Open Access
Validation of the Mayo Hip Score: construct
validity, reliability and responsiveness to
change
Jasvinder A. Singh
1,2,4,5*, Cathy Schleck
3, W. Scott Harmsen
3and David G. Lewallen
4Abstract
Background:Previous studies have provided the initial evidence for construct validity and test-retest reliability of the Mayo Hip Score. Instruments used for Total Hip Arthroplasty (THA) outcomes assessment should be valid, reliable and responsive to change. Our main objective was to examine the responsiveness to change, association with subsequent revision and the construct validity of the Mayo hip score.
Methods:Discriminant ability was assessed by calculating effect size (ES), standardized response mean (SRM) and Guyatt’s responsiveness index (GRI). Minimal clinically important difference (MCII) and moderate improvement thresholds were calculated. We assessed construct validity by examining association of scores with preoperative patient characteristics and correlation with Harris hip score, and assessed association of scores with the risk of subsequent revision.
Results:Five thousand three hundred seven provided baseline data; of those with baseline data, 2,278 and 2,089 (39 %) provided 2- and 5-year data, respectively. Large ES, SRM and GRI ranging 2.66–2.78, 2.42–2.61 and 1.67–1.88 were noted for Mayo hip scores with THA, respectively. The MCII and moderate improvement thresholds were 22.4–22.7 and 39.4–40.5 respectively. Hazard ratios of revision surgery were higher with lower final score or less improvement in Mayo hip score at 2-years and borderline significant/non-significant at 5-years, respectively: (1) score≤55 with hazard ratios of 2.24 (95 % CI, 1.45, 3.46;p= 0.0003) and 1.70 (95 % CI, 1.00, 2.92;p= 0.05) of implant revision subsequently, compared to 72-80 points; (2) no improvement or worsening score with hazard ratios 3.94 (95 % CI, 1.50, 10.30;p= 0.005) and 2.72 (95 % CI, 0.85,8.70;p= 0.09), compared to improvement >50-points. Mayo hip score had significant positive correlation with younger age, male gender, lower BMI, lower ASA class and lower Deyo-Charlson index (p≤0.003 for each) and with Harris hip scores (p< 0.001).
Conclusions:Mayo Hip Score is valid, sensitive to change and associated with future risk of revision surgery in patients with primary THA.
Keywords:Validation, Mayo hip score, Mayo hip questionnaire, Total hip arthroplasty, Total hip replacement, Validity, Responsiveness, Minimal clinically meaningful difference, MCID, Revision risk, Reliability
* Correspondence:[email protected]
1Medicine Service, Birmingham VA Medical Center and Department of
Medicine, University of Alabama, Faculty Office Tower 805B, 510 20th Street S, Birmingham, AL 35294, USA
2Departments of Orthopedic Surgery, Mayo Clinic School of Medicine,
Rochester, MN, USA
Full list of author information is available at the end of the article
Background
Hip replacement has been termed the operation of the century [1]. Improvements after total hip arthroplasty (THA) are often measured using instruments that meas-ure pain, function and/or quality of life (QOL). Patient-reported outcomes (PROs) of pain and QOL show improvement after THA, usually an elective procedure for the treatment of end-stage hip arthritis. A recent re-view of key challenges to the assessment of QOL out-comes in arthroplasty noted that it is critical to assess psychometric properties of commonly used instruments [2]. Most studies use composite instruments (pain, func-tion and QOL) to assess arthroplasty outcomes, the most common being the Harris Hip Score (HHS) [3, 4]. The Mayo Hip Score, a composite instrument that as-sesses pain, function and hip mobility, has been used for THA outcome assessment at our institution (i.e., Mayo Clinic) for >3 decades. A key difference between the Mayo Hip Score and the HHS is that Mayo Hip Score is shorter and does not include range of motion and limb deformity assessments [5, 6]. Thus, it does not require a
physician’s examination or a goniometer for completion
and can be easily completed by a patient (or a provider). Previous studies have provided initial evidence for construct validity and test-retest reliability of the Mayo Hip Score [5, 6], but other aspects of validity and dis-criminant ability have not been tested. It is important that the instruments used for THA outcomes assess-ment are valid, reliable and responsive to change. Re-sponsiveness to change is an important attribute of a PRO instrument, since they are often used to compare outcomes of technological and surgical innovations in THA [7, 8]. The objective of this study was to examine discriminant ability, association with subsequent revision and examine further construct validity and reliability of the Mayo Hip Score.
Methods
Study participants and the instrument
The study included patients who had undergone primary THA at the Mayo Clinic and had completed a Mayo Hip Score at preoperative and/or one of the two follow-up periods, i.e. 2- or 5-years post-THA. The institutional re-view board at the Mayo Clinic approved the study and waived the requirement for patient consent. The Mayo Hip Score is a composite scale that consists of pain and function questions (Additional file 1: Appendix 1). The
total score ranges 0–80; higher score is better. A single
pain question is scored 0–40 points based on pain
sever-ity: no pain, slight, moderate and severe pain scored at 40, 35, 20 and 0 points. Hip function is based on dis-tance walked (15 points) and the use of support aids (canes, crutches, walker; 5 points for no aids) for ambu-lation. Hip mobility is assessed with 4 questions, each
for 5 points: ability to enter and leave a car, ability to perform foot care, presence of a limp and the ability to climb stairs. The Mayo Hip Score has been shown to have test-retest reliability and limited construct validity
[5, 6]. The study period was 1993–2005.
Responsiveness/discriminant validity, construct validity and association with revision
Responsiveness was assessed by three statistics. We calcu-lated the effect size (ES) by dividing the change in hip score from baseline to 2-years by the standard deviation at
baseline (preoperative). An ES of 0.20–0.49 represents a
small change, 0.50–0.79 a medium change, and≥0.80 a
large change, according to Cohen’s rule. The standardized
response mean (SRM) is defined as the mean change in the patient Mayo hip score divided by the SD of the chan-ged scores. The Guyatt Responsiveness Index (GRI) is the ratio of average change in patients identified as improved (much better and somewhat better combined as one group) divided by the standard deviation of the change in
patients identified as remaining stable (“no change”) based
on the global rating of hip function change.
We calculated the minimal clinically important provement (MCII) and moderate improvement as
im-provements corresponding to categories “somewhat
better now” and “much better now”, on the following
global question as the anchor: Compared to before sur-gery, how is your hip? Much better now, somewhat bet-ter now, the same and worse.
Construct validity was assessed with convergent and divergent validity. Convergent validity was assessed by
Spearman’s correlation coefficients between Mayo hip
scores and HHS at baseline, 2- and 5-years. We also assessed convergent validity by assessing Mayo hip scores for different activity levels (unlimited, some limi-tation and severe limilimi-tation). Divergent validity was assessed with examining mean Mayo hip scores at 2-and 5-years post-THA for the different levels of variables previously shown to be associated with pain/function outcomes after THA and examining association of these variables in univariate linear regression with Mayo hip
scores [9–16]: age, gender, American Society of
Anesthesiology (ASA) class and the Deyo-Charlson index [17], a validated measure of medical comorbidity. We also assessed association of Mayo hip scores with the number of joints involved (index hip or up to four joints including both knees and hips). These models examining were also subsequently adjusted for baseline Mayo Hip Scores. Test-retest reliability was assessed using intra-class coefficient (ICC) [18], by comparing two ratings on the same individual by patient vs. phys-ician within 2-weeks of each other.
baseline to 2- and 5-years with the risk of subsequent re-vision THA. Final Mayo hip scores were categorized as
≤55, 56–63, 64–71 and 72–80, based on previously
de-fined categories of excellent, good, fair and poor results
[6]. Change in Mayo hip scores was categorized as ≤0,
1–25, 26–50 vs. >50. We used Cox regression model
and calculated hazard ratios of revision, along with 95 % confidence intervals. We constructed Kaplan-Meier sur-vival plots for absolute and change Mayo hip scores.
A p-value of 0.05 or lower was considered significant.
Results
Clinical and demographic features of study cohort are shown in Additional file 1: Appendix 2. Mean age was 64 years, 51 % were female. 24 % had body mass index
(BMI) of <25 kg/m2and mean Deyo-Charlson index was
1.0. Mean Mayo hip scores (standard deviation) at base-line pre-operative and 2- and 5-years post-THA were 33 (14), 72 (12) and 70 (13), respectively. Of all surveys
available, 23–25 % each were for patients with
pre-operative and 2-year and prepre-operative and 5-year assess-ment. Non-response rates at 2- and 5-years in those with preoperative surveys were 36 % and 45 %.
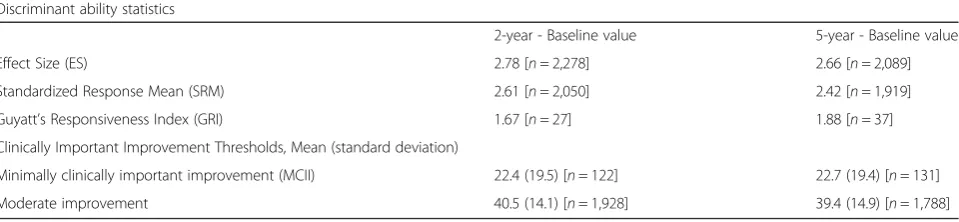
[image:3.595.59.539.622.733.2]Discriminant validity/Responsiveness to Change: Large ES, SRM and GRI were noted for Mayo hip scores at both 2-years and 5-years post-THA (Table 1). MCII esti-mates were 22.4 at 2-years and 22.7 at 5-years; moderate improvement thresholds were 40.5 and 39.4, respectively (Table 1).
Convergent and divergent validity: Younger age, male gender, lower BMI, lower ASA class and lower Deyo-Charlson index were each significantly associated with higher Mayo hip scores at 2- and 5-years post-THA
(p≤0.003 for each; Additional file 1: Appendix 3), while
the total number of joints involved was not significantly associated. This finding was confirmed in models that additionally adjusted for baseline preoperative Mayo hip scores (Additional file 1: Appendix 3). Similar strong asso-ciations of Mayo hip scores were seen with lower levels of overall activity limitation and with patient response of more improvement in their hip (much better, better) on the global question (Additional file 1: Appendix 3).
Spearman correlation coefficients of Mayo Hip Score with Harris Hip Score at baseline were 0.91 and 0.93, at
2-years and 5-years respectively (p< 0.001 for all).
Association with Subsequent Implant Revision: Mayo hip scores of 55 or lower at 2-years were significantly associated with higher risk of THA revision at 2-years
(p= 0.0003) and with borderline significance at 5-years
(p= 0.05), the risk being 2-times compared to those with
score 72–80 points (Table 2). Compared to improvement
of >50-points in Mayo hip score, patients with no im-provement or worsening of Mayo hip score at 2-years after THA had a 3.9 times higher risk of THA revision
subsequently (p= 0.005) and a statistically non-significant
trend at 5-years with 2.7-times odds (p= 0.09; Table 2).
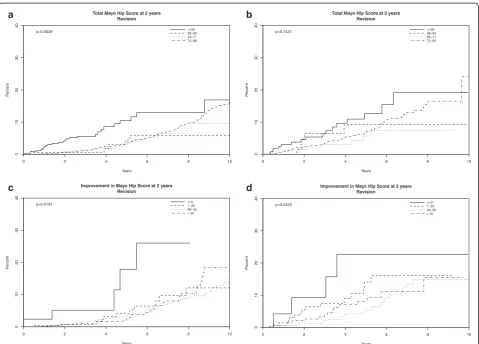
The association of 2- and 5-year final and change scores on Mayo hip scores with implant survival is shown in Fig. 1. Absolute Mayo hip scores at 2-years and change in Mayo hip scores at 2- and 5-years were each significantly
associated with the risk of revision (p< 0.05 each);
abso-lute Mayo hip scores at 5-years showed a non-significant
trend (p= 0.14).
Test-retest reliability: The Mayo hip scores from phys-ician and patient-administered surveys were numerically similar, 73 +/- 10 vs. 68 +/- 12, being 5-point (SD, 10) higher in physician- than patient-assessed surveys. In contrast, for HHS, respective scores were 91 +/- 12 vs. 81 +/- 14 with a difference of 10 +/- 11 between the scores. The ICC for Mayo hip score, using the data from the physician vs. patient-administered, was high at 0.55 (95 % CI: 0.47, 0.63), numerically higher than the ICC for Harris Hip Score at 0.48 (95 % CI: 0.40, 0.57).
Discussion
In this study, we found that Mayo hip score is a valid and reliable measure of hip outcomes in patients who had undergone primary THA. Mayo hip score was also associated with the risk of revision surgery at 2-years, both when examined as the final score and as a change score. These psychometric properties compared well to
the HHS [5, 19–21], which at present is the most
com-monly used outcome instrument for THA outcome as-sessment [3, 4]. An advantage of the Mayo hip score is
Table 1Discriminant ability of Mayo hip score and thresholds for clinically meaningful improvements
Discriminant ability statistics
2-year - Baseline value 5-year - Baseline value
Effect Size (ES) 2.78 [n= 2,278] 2.66 [n= 2,089]
Standardized Response Mean (SRM) 2.61 [n= 2,050] 2.42 [n= 1,919]
Guyatt’s Responsiveness Index (GRI) 1.67 [n= 27] 1.88 [n= 37]
Clinically Important Improvement Thresholds, Mean (standard deviation)
Minimally clinically important improvement (MCII) 22.4 (19.5) [n= 122] 22.7 (19.4) [n= 131]
Table 2The association of Mayo Hip Scores with the risk of THA revision using Cox regression analyses
Hazards of THA Revision (95 % CI) p-value Hazards of THA Revision (95 % CI) p-value
2-year data 5-year data
n= 3,307 with 178 events n= 1,717 with 97 events
Total Mayo Hip Scorea
≤55 vs. 72–80 2.24 (1.45, 3.46) 0.0003 1.70 (1.00, 2.92) 0.05
56–63 vs. 72–80 0.60 (0.24, 1.48) 0.26 1.00 (0.40, 2.52) 0.99
64–71 vs. 72–80 0.80 (0.48, 1.36) 0.42 0.70 (0.35, 1.42) 0.32
2-year data 5-year data
n= 1,904 with 106 events n= 1,080 with 61 events
Mayo Hip Score improvement
≤0 vs. >50 3.94 (1.50, 10.30) 0.005 2.72 (0.85, 8.70) 0.09
1–25 vs. >50 0.88 (0.44, 1.76) 0.71 1.45 (0.70, 3.01) 0.32
26–50 vs. >50 0.87 (0.56, 1.34) 0.52 0.73 (0.40, 1.35) 0.32
aCategorization of Mayo hip score is based on the previously described categories: Excellent result is 72-80 points, good is 64–71 points, fair is 56–63 points, and
poor is≤55 points by McGrory et al. 1996 [6]
Total Mayo Hip Score at 2 years Revision
Years
P
ercent
0 2 4 6 8 10
0
10
20
30
40
<=55 56−63 64−71 72−80 p=0.0009
Improvement in Mayo Hip Score at 2 years Revision
Years
P
ercent
0 2 4 6 8 10
0
10
20
30
40
<=0 1−25 26−50 > 50 p=0.0191
Total Mayo Hip Score at 5 years Revision
Years
P
ercent
0 2 4 6 8 10
0
10
20
30
40
<=55 56−63 64−71 72−80 p=0.1431
Improvement in Mayo Hip Score at 5 years Revision
Years
P
ercent
0 2 4 6 8 10
01
0
2
0
3
0
40
<=0 1−25 26−50 > 50 p=0.0425
a b
c d
[image:4.595.59.539.317.661.2]that either physicians or patients can complete it, as compared to the HHS that has physician and patient portions. An excellent agreement between these assess-ments also indicates that in an appropriate setting, Mayo hip score may be an alternative to HHS. Several findings from this validation study deserve further discussion.
First, our study established that Mayo hip score was re-sponsive to change with large effect sizes and was associ-ated with risk of subsequent revision at 2-years. This is a very important finding, considering that one of the main applications of arthroplasty outcomes instruments is to compare various surgical or implant types and therefore a responsive instrument is highly desirable [2]. HHS has been shown to be responsive with large ES and SRM of 2.5 and 1.8 [21]; respective ES and SRM for Mayo hip score of 2.8 and 2.6 from our study are comparable. We also determined the MCII and moderate improvement thresholds for Mayo hip score, at 2- and 5-years.
The association of Mayo hip score with the risk of fu-ture revision surgery is particularly impressive, since the attainment of Mayo Hip Scores at or below 55 points at 2- or 5-years increased the risk of early revision surgery after each time-point by 2-times, compared to scores
72–80 points (maximum score is 80). This was
statisti-cally significant at 2-years (p= 0.0003) and borderline
sta-tistically significant at 5-years (p= 0.05). A lack of
improvement (or worsening) of Mayo hip score from pre-operative to 2-years was associated with a 3-4 times higher revision risk compared to improvement by >50-points. K-M survival curves describe these findings that both absolute and change in Mayo hip scores were signifi-cantly associated with the risk of revision, the only exception being the association of absolute scores at 5-years that was not statistically significantly associated
with future revision risk (p= 0.14). These findings indicate
that Mayo hip scores might allow screening of early THA implant failures. This has practical implications, beyond instrument validation. It may be possible to develop an early implant risk score for clinical use that incorporates Mayo hip score (or similar scales) and other risk factors, a project currently underway.
Second, this study adds significant validation data re-lated to the construct validity of the Mayo hip score. Our finding of significant association of Mayo hip scores at 2- and 5-years with important baseline characteristics previously shown to impact pain and function outcomes, i.e. age, gender, BMI, ASA class and Deyo-Charlson
index [9–16], provides critical evidence for its
conver-gent and diverconver-gent validity. The high correlation of Mayo hip score with HHS, a validated outcome instru-ment [19, 20, 22] and overall activity level, establishes the construct validity of Mayo hip score for assessment of outcomes after THA. More validation studies in other populations such as revision THA, hip arthroscopy,
partial hip replacement may be needed before Mayo hip score can be used for the assessment of outcomes in these populations.
We found the Mayo hip score has fair test-retest inter-rater reliability, which extends the findings from an inde-pendent sample from our institution (i.e., Mayo Clinic) in 97 THA patients [6]. We found a slightly higher (better) score in physician- than patient-administered Mayo hip score, and the difference of 5-points in our study was slightly higher than the 1.8-point difference in the previ-ous study. As expected, this difference was slightly smaller than that for HHS, given its complexity and inclusion of range of motion and deformity. This indicates the reliabil-ity of Mayo Hip score is as much as HHS or higher. Inter-rater ICCs in the range of 0.39 to 0.86 have been reported for outcome measures in pemphigus [23] with patient vs. physician scoring, similar to our ICC of 0.55 for Mayo hip score. A higher ICC would imply that patient and phys-ician assessments agree closely; however, the ICC seems numerically better than the most commonly used in-strument, the HHS, in our study. For a patient-reported measure such as Mayo hip score, it is not surprising to see differences in physician completed assessment vs. pa-tient completed assessment. We recommend that this PRO be completed by patients, not physicians, and in studies where both physicians and patients have completed the survey, MHS scores may not be interchangeable.
Key advantages of Mayo hip score are that it has fewer questions than HHS and does not require physician as-sessment in the clinic. Therefore, it can be sent as a mailed survey and completed by patients. This can allow for a rapid and efficient assessment of not only the
pa-tients’current pain/function status that allows screening
for THA failures during the short and long-term arthro-plasty follow-up. As suggested in earlier studies, the Mayo hip score can be coupled with radiographic score [5] for a more comprehensive assessment. The advent of telemedicine may allow for a virtual patient visit and follow-up (mailed survey and remote review of radio-graphs) that can replace the annual in-person clinician visit. In an era of health care cost reduction and a de-clining supply of arthroplasty surgeons [24], this ap-proach might allow more cost-efficient arthroplasty follow-up and monitoring.
One must consider the study limitations while inter-preting study findings. Non-response rates were 36 % and 45 % at 2- and 5-years, respectively, which could have potentially affected the study findings. We decided
findings may therefore be generalizable only to patients who regularly respond to post-arthroplasty surveys. The overall revision rate in the cohort is low, and we may have missed significant findings due to the rarity of this outcome.
So, what does this study add? There is already a large diversity of instruments being used in THA assessments [25], so why have another instrument? Several instru-ment in current use in arthroplasty have limited data on validity and reliability, and we provide assessment of validity and responsiveness of an instrument that has been in use in our Total Joint Registry for >3 decades and is patient self-administered. One challenge in post-arthroplasty outcome assessment is the use of several different outcome measures [25]. Harmonization of the THA outcome instrument use across arthroplasty stud-ies would be a step forward and will allow comparison across studies. This effort is currently underway [26].
Conclusions
In summary, this study provides validation data for the Mayo hip score. Mayo hip score is valid, reliable and sensitive to change. Mayo hip score is associated with the risk of subsequent revision surgery. It correlates well with HHS, the most popular instrument for THA out-comes assessment and has the advantage that it can be completed either by the patient or the surgeon. We sug-gest that this instrument be completed by the patient, based on the fact that pain and daily function abilities are best assessed and reported by a patient and that it is more practical for the patient to complete this instru-ment than the physician. Clinically meaningful thresh-olds for Mayo Hip score have been established. In the era of where PROs are a critical part of patient assess-ment and follow-up after arthroplasty, the Mayo hip score may offer an alternative to longer instruments.
Additional file
Additional file 1:Appendix 1. Mayo Hip Score: Clinical Assessment Score (0-80 points).Appendix 2. Demographic and clinical characteristics of the study population.Appendix 3. Convergent and Divergent validity using unadjusted linear regression models and those adjusted for baseline Mayo hip scores. (DOCX 92 kb)
Abbreviations
THA:Total hip arthroplasty; HHS: Harris hip score; QOL: Quality of life; ASA: American society of anesthesiology; BMI: Body mass index; PRO: Patient-reported outcomes; MCII: Minimal clinically important improvement; ASA: American society of anesthesiology; ES: Effect size; SRM: Standardized response mean; GRI: Guyatt’s responsiveness index.
Competing interest
JAS has received research and travel grants from Takeda and Savient; and consultant fees from Savient, Takeda, Regeneron, Iroko, Merz, Bioiberica, Crealta and Allergan pharmaceuticals. One of the authors (DGL) has received royalties/speaker fees from Zimmer, has been a paid consultant to Zimmer
and has received institutional research funds from DePuy, Stryker and Zimmer. All other authors have no competing interested to declare.
Authors’contributions
JAS was responsible for study conception and design, development of study protocol methods and analyses, review of statistical analyses and drafting of first version of the manuscript. DGL was responsible for review and revision of study design and study protocol, statistical analyses. CS performed and reviewed the analyses. WSH reviewed the analyses. All authors critically revised the paper and approved the final version of the paper.
Acknowledgments
We thank Youlonda Lochler for her assistance in data abstraction from the Mayo Clinic Total Joint Registry for this project. This material is the result of work supported by the Department of Orthopedic Surgery, Mayo Clinic School of Medicine, Rochester, MN, USA. JAS is also supported by the resources and the use of facilities at the VA Medical Center at Birmingham, Alabama, USA.
“The views expressed in this article are those of the authors and do not necessarily reflect the position or policy of the Department of Veterans Affairs or the United States government."
Each author certifies that his or her institution has approved the human protocol for this investigation and that all investigations were conducted in conformity with ethical principles of research.
Author details
1Medicine Service, Birmingham VA Medical Center and Department of
Medicine, University of Alabama, Faculty Office Tower 805B, 510 20th Street S, Birmingham, AL 35294, USA.2Departments of Orthopedic Surgery, Mayo
Clinic School of Medicine, Rochester, MN, USA.3Departments of Biostatistics, Mayo Clinic School of Medicine, Rochester, MN, USA.4Center for Surgical
Medical Acute care Research and Transitions (C-SMART), Birmingham VA Medical Center, Birmingham, AL, USA.5Division of Epidemiology, School of
Public Health, University of Alabama, Birmingham, AL, USA.
Received: 4 September 2015 Accepted: 5 January 2016
References
1. Learmonth ID, Young C, Rorabeck C. The operation of the century: total hip replacement. Lancet. 2007;370(9597):1508–19.
2. Singh J, Sloan JA, Johanson NA. Challenges with health-related quality of life assessment in arthroplasty patients: problems and solutions. J Am Acad Orthop Surg. 2010;18(2):72–82.
3. Riddle DL, Stratford PW, Singh JA, Strand CV. Variation in outcome measures in hip and knee arthroplasty clinical trials: a proposed approach to achieving consensus. J Rheumatol. 2009;36(9):2050–6.
4. Harris WH. Traumatic arthritis of the hip after dislocation and acetabular fractures: treatment by mold arthroplasty. An end-result study using a new method of result evaluation. J Bone Joint Surg Am. 1969;51(4):737–55. 5. Kavanagh BF, Fitzgerald RH, Jr.: Clinical and roentgenographic
assessment of total hip arthroplasty. A new hip score. Clin Orthop Relat Res 1985(193):133-140
6. McGrory BJ, Morrey BF, Rand JA, Ilstrup DM. Correlation of patient questionnaire responses and physician history in grading clinical outcome following hip and knee arthroplasty. A prospective study of 201 joint arthroplasties. J Arthroplasty. 1996;11(1):47–57.
7. Shi HY, Chang JK, Wong CY, Wang JW, Tu YK, Chiu HC, et al. Responsiveness and minimal important differences after revision total hip arthroplasty. BMC Musculoskelet Disord. 2010;11:261.
8. Soohoo NF, Vyas RM, Samimi DB, Molina R, Lieberman JR. Comparison of the responsiveness of the SF-36 and WOMAC in patients undergoing total hip arthroplasty. J Arthroplasty. 2007;22(8):1168–73.
9. Singh JA, Lewallen D. Predictors of pain and use of pain medications following primary Total Hip Arthroplasty (THA): 5,707 THAs at 2-years and 3,289 THAs at 5-years. BMC Musculoskelet Disord. 2010;11:90.
11. Davis AM, Agnidis Z, Badley E, Kiss A, Waddell JP, Gross AE. Predictors of functional outcome two years following revision hip arthroplasty. J Bone Joint Surg Am. 2006;88(4):685–91.
12. Quintana JM, Escobar A, Aguirre U, Lafuente I, Arenaza JC. Predictors of health-related quality-of-life change after total hip arthroplasty. Clin Orthop Relat Res. 2009;467(11):2886–94.
13. Slaven EJ. Prediction of functional outcome at six months following total hip arthroplasty. Phys Ther. 2012;92(11):1386–94.
14. Smith GH, Johnson S, Ballantyne JA, Dunstan E, Brenkel IJ. Predictors of excellent early outcome after total hip arthroplasty. J Orthop Surg Res. 2012;7:13. 15. Singh JA, Lewallen D. Age, gender, obesity, and depression are associated
with patient-related pain and function outcome after revision total hip arthroplasty. Clin Rheumatol. 2009;28(12):1419–30.
16. Lubbeke A, Katz JN, Perneger TV, Hoffmeyer P. Primary and revision hip arthroplasty: 5-year outcomes and influence of age and comorbidity. J Rheumatol. 2007;34(2):394–400.
17. Deyo RA, Cherkin DC, Ciol MA. Adapting a clinical comorbidity index for use with ICD-9-CM administrative databases. J Clin Epidemiol. 1992;45(6):613–9. 18. McGraw KO, Wong SP. Forming inferences about some intraclass correlation
coefficients. Psychological methods. 1996;1:30–46.
19. Soderman P, Malchau H. Is the Harris hip score system useful to study the outcome of total hip replacement? Clin Orthop Relat Res. 2001;384:189–97. 20. Soderman P, Malchau H, Herberts P. Outcome of total hip replacement: a
comparison of different measurement methods. Clin Orthop Relat Res. 2001; 390:163–72.
21. Wright JG, Young NL. A comparison of different indices of responsiveness. J Clin Epidemiol. 1997;50(3):239–46.
22. Hoeksma HL, Van Den Ende CH, Ronday HK, Heering A, Breedveld FC. Comparison of the responsiveness of the Harris Hip Score with generic measures for hip function in osteoarthritis of the hip. Ann Rheum Dis. 2003; 62(10):935–8.
23. Rosenbach M, Murrell DF, Bystryn JC, Dulay S, Dick S, Fakharzadeh S, et al. Reliability and convergent validity of two outcome instruments for pemphigus. J Invest Dermatol. 2009;129(10):2404–10.
24. Iorio R, Robb WJ, Healy WL, Berry DJ, Hozack WJ, Kyle RF, et al. Orthopaedic surgeon workforce and volume assessment for total hip and knee replacement in the United States: preparing for an epidemic. J Bone Joint Surg Am. 2008;90(7):1598–605.
25. Riddle DL, Stratford PW, Bowman DH. Findings of extensive variation in the types of outcome measures used in hip and knee replacement clinical trials: a systematic review. Arthritis Rheum. 2008;59(6):876–83.
26. Singh JA, Dohm M, Sprowson AP, Wall PD, Richards BL, Gossec L, et al. Outcome Domains and Measures in Total Joint Replacement Clinical Trials: Can We Harmonize Them? An OMERACT Collaborative Initiative. J Rheumatol. 2015;42(12):2496–502.
• We accept pre-submission inquiries
• Our selector tool helps you to find the most relevant journal
• We provide round the clock customer support
• Convenient online submission
• Thorough peer review
• Inclusion in PubMed and all major indexing services • Maximum visibility for your research
Submit your manuscript at www.biomedcentral.com/submit