R E S E A R C H A R T I C L E
Open Access
Detecting insomnia in patients with low back
pain: accuracy of four self-report sleep measures
Saad M Alsaadi
1*, James H McAuley
2, Julia M Hush
3, Delwyn J Bartlett
4, Nicholas Henschke
5,
Ronald R Grunstein
4,6and Chris G Maher
1Abstract
Background:Although insomnia is common in patients with low back pain (LBP), it is unknown whether commonly used self-report sleep measures are sufficiently accurate to screen for insomnia in the LBP population. This study investigated the discriminatory properties of the Pittsburgh Sleep Quality Index (Pittsburgh
questionnaire), Insomnia Severity Index (Insomnia index), Epworth Sleepiness Scale (Epworth scale) and the sleep item of the Roland and Morris Disability Questionnaire (Roland item) to detect insomnia in patients with LBP by comparing their accuracy to detect insomnia to a sleep diary. The study also aimed to determine the clinical optimal cut-off scores of the questionnaires to detect insomnia in the LBP population.
Methods:Seventy nine patients with LBP completed the four self-reported questionnaires and a sleep diary for 7 consecutive nights. The accuracy of the questionnaires was evaluated using Receiver Operator Characteristic (ROC) curves with the Area Under the Curve (AUC) used to examine each test’s accuracy to discriminate participants with insomnia from those without insomnia.
Results:The Pittsburgh questionnaire and Insomnia index had moderate accuracy to detect insomnia (AUC = 0.79, 95% CI = 0.68 to 0.87 and AUC = 0.78, 95% CI = 0.67 to 0.86 respectively), whereas the Epworth scale and the Roland item were not found to be accurate discriminators (AUC = 0.53, 95% CI = 0. 41 to 0.64 and AUC = 0.64, 95% CI = 0.53 to 0.75 respectively). The cut-off score of > 6 for the Pittsburgh questionnaire and the cut-off point of > 14 for the Insomnia index provided optimal sensitivity and specificity for the detection of insomnia.
Conclusions:The Pittsburgh questionnaire and Insomnia index had similar ability to screen for insomnia in patients with low back pain.
Keywords:Low back pain, Insomnia, Diagnosis, Questionnaire, Accuracy
Background
The International Classification of Sleep Disorders, sec-ond edition (ICSD-2), defines insomnia as the complaint of one or more of the following: difficulty in initiating sleep; difficulty in maintaining sleep; waking up too early and unable to resume sleep or nonrestorative sleep, des-pite adequate preparation for sleep. These symptoms are to be associated with at least one or more forms of day-time functional impairment related to nocturnal sleep difficulty, such as fatigue; mood disturbance; or sleep dissatisfaction [1,2].
Insomnia is considered to be the most frequently occur-ring sleep disorder [3]. It is often associated with medical conditions such as depression, anxiety and respiratory dis-orders [4]. Insomnia is also common in painful conditions; recent studies have reported that at least 50% of patients with low back pain (LBP) also report symptoms of insom-nia [5,6]. Insominsom-nia is often associated with fatigue, cognitive impairment and mood disturbance, leading to functional impairment [7]. In addition, there is substantial evidence that insomnia can adversely influence an individual’s experi-ence of pain through increasing perception of pain and de-creasing pain tolerance and pain threshold [8]. Recent studies have found insomnia symptoms in patients with LBP are significantly associated with pain intensity, day-time functional impairment and psychological distress * Correspondence:alsaadis@gmail.com
1
The George Institute for Global Health, Sydney Medical School, University of Sydney, Missenden Road, P.O. Box M201, Sydney, New South Wales, Australia Full list of author information is available at the end of the article
[5,6,9]. These findings imply that insomnia is likely to ad-versely affect LBP management. Despite this, there is little published information on which is the most accurate and practical method for assessing insomnia in the LBP popula-tion. Clinicians and researchers need accurate, brief and cost-effective measures to screen for insomnia and evaluate treatment outcome.
Self-reported questionnaires are a common method used to assess insomnia as sleep data can be collected from multiple nights, they are brief, easy to administer and cost-effective. Several self-reported questionnaires have been developed to assess aspects of sleep quality and are commonly used to assess insomnia symptoms. These include the Pittsburgh Sleep Quality Index (Pittsburgh questionnaire) [10], Insomnia Severity Index (Insomnia index) [11] and the Epworth Sleepiness Scale (Epworth scale) [12]. Specifically for LBP populations, researchers and clinicians use sleep item(s) of LBP functional ques-tionnaires to assess their patients’ sleep quality. For ex-ample, the sleep item of the Roland and Morris Disability Questionnaire (Roland item) [13]. Some of these question-naires have been translated to different languages and vali-dated for use in several medical conditions such as cancer [14,15] and traumatic brain injury [16].
These questionnaires are potentially useful tools to de-tect insomnia in patients with LBP. However, their cap-acity to detect insomnia in this population is currently unknown. It has been suggested that questionnaire’s ac-curacy to detect insomnia and the optimal cut-off score may differ based on the studied population [14]. In fact, previous clinometric testing of these instruments showed inconsistency for the optimal cut-off scores between dif-ferent medical conditions as well as community samples [17-20]. Therefore, evaluation of the capacity of these questionnaires to detect insomnia in patients with LBP is necessary before their employment in clinical and research practice.
The subjectivity of the insomnia definition and the absence of a gold standard to diagnose insomnia make it difficult to examine the criterion-related validity of self-reported questionnaires [19]. A solution may be obtained by investigating the sensitivity and specificity of the ques-tionnaire to detect insomnia [19]. Sleep diaries are daily subjective reports of sleep that are widely used to study sleep disturbance [11,21]. They are completed immedi-ately after arising to provide an evaluation of the previous night’s sleep quantity and sleep disturbance, which mini-mizes recall bias [3]. Although diaries may not be an opti-mal method for diagnosing certain insomnia subtypes, they are considered to be useful measures to detect gen-eral insomnia disorder [1,3,7].
In the current study, we aimed to investigate the prop-erties of four self-reported sleep questionnaires to detect insomnia disorder in patients with LBP by comparing
their accuracy to detect insomnia to a reference standard, the Sleep Diary [21]. The study also aimed to determine the optimal cut-off scores of the questionnaires to detect insomnia in the LBP population. We expected that a meas-ure which assesses symptoms of general insomnia, sleep difficulties and day-time impairment (ICSD-2) [1] would accurately detect insomnia and therefore is a suitable refer-ence standard.
Methods
Study overview
This was a cross-sectional study conducted between March 2010 and June 2012. The study protocol was approved by the University of Sydney Human Research Ethics Committee, Australia (09-2009/12100). All partici-pants signed an informed consent form before participat-ing in the study. Participants were compensated for their time and transportation expenses.
Participants
Participants were recruited from physiotherapy clinics in the Sydney metropolitan area, through advertising using flyers and posters in physiotherapy clinics and community centers and by advertising on local social media web sites. The inclusion criteria were: patients with non-specific low back pain (i.e. low back pain with no specific pathology) [22], aged between 18 and 79 years and possessing suffi-cient fluency in the English language to answer self-completed questionnaires. Exclusion criteria were: sciatica (i.e. pain radiating below the knee with definite neurological signs); spinal surgery within the preceding 6 months; previ-ously diagnosed with a sleep disorder for which they were receiving care; receiving care for a mental health condition; and rotating night shift workers. There was no restriction on duration of LBP.
Procedures
Recruiting physiotherapists informed patients about the study and passed their contact details to the study re-searcher. Potential participants from the community were provided with information about the study through the post or email. Volunteers who showed an interest in participating were then contacted and screened for in-clusion by the study researcher.
(i) Demographic questions regarding a participant’s age, gender, weight, height, educational level,
employment status, smoking status, and whether the participant was seeking care for LBP or taking medication.
(ii) Self-reported measures of sleep quality, including the Pittsburgh questionnaire, Insomnia index, and Epworth scale.
(iii)The Brief Pain Inventory, which measures pain intensity [23]; the Depression, Anxiety and Stress Scale (DASS-21) [24], which measures depression, anxiety and stress; the Roland and Morris Disability Questionnaire [13], which measures disability due to LBP; and the Fatigue Severity Scale [25], which measures fatigue.
Participants also completed the Pittsburgh sleep diary [21], over 7 consecutive days. Participants were followed up, at least once, either via phone calls or through SMS text messages to ensure that the sleep diary was being completed.
Measures
The Pittsburgh sleep diary (sleep diary)
The sleep diary [21] consists of two sections. Although both sections were completed, only the second section was used in this study. The section collects information about the previous night’s sleep and is completed immedi-ately after awaking. It contains the following items: (1) time went to bed, (2) lights out time, (3) sleep onset la-tency (SOL) calculated as the minutes from lights out until falling asleep, (4) time of final waking, (5) method/ reason of final waking, (6) number of times the participant woke during the night, wake after sleep onset (WASO), (7) dur-ation of WASO in minutes calculated as the total number of minutes of awake that occurred after sleep onset and before the final awaking, (8) reason(s) for WASO, (9) sleep quality, (10) mood on final awaking, and (11) alertness on final waking. Items 9 to 11 were completed on a 0–10 Numerical Rating Scale (NRS).
The Pittsburgh sleep quality index (Pittsburgh questionnaire) The Pittsburgh questionnaire is a self-report instrument designed to evaluate sleep quality over the last month. It consists of 19 items to produce 7 aspects of sleep quality (sleep onset latency, sleep duration, efficiency, quality, dis-turbances, medication, and day-time dysfunction). The sum of these 7 aspects (0–3) yields a global score of sleep quality (0–21); a high sore is an indication of poor sleep quality. The cut-off score of > 5 has been found to be an accurate cut-off score to distinguish between patients with primary insomnia and those without insomnia [18].
The insomnia severity index (Insomnia index)
The Insomnia index is a 7-item scale, with each item rated on a 5-point Likert-scale. It assesses insomnia severity, sleep satisfaction, sleep interference with day-time func-tioning, noticeability of sleep impairment, and distress caused by insomnia over the last 2 weeks. Summation of the 7-items provides a score ranging from 0 to 28, where 0–7 indicates no significant insomnia, 8 to 14 indicates sub-threshold insomnia, 15 to 21 indicates moderate in-somnia, and 22 to 28 indicates severe insomnia. The cut-off score of > 14 has been reported to be the most accurate point to detect patients with primary insomnia [19].
The Epworth sleepiness scale (Epworth scale)
The Epworth scale is an 8-item self-report questionnaire used to assess excessive day-time sleepiness over the last week. Participants indicate on a 4-point Likert- type scale (0 = never, 3 = high chance) the likelihood that they will
“doze off or fall asleep”in eight different situations. Sum-mation of the 8 responses produces a total score ranging from 0 to 24; with higher scores reflecting greater sleepi-ness. The cut off score of > 10 has been found to accur-ately determine excessive day-time sleepiness [26].
The sleep item of the Roland and Morris disability questionnaire (Roland item)
The Roland and Morris Disability questionnaire [13] is a 24-item self-administered questionnaire designed to meas-ure the effect of LBP on a patient’s normal activities of daily living. The sleep item (Roland item) examines sleep quality in relation to the effect of pain:“I sleep less well be-cause of my back”. The response format of the item is di-chotomous (yes/no). The item has been reported to be easy to understand and answer by patients with LBP [27].
Insomnia classification
We adopted the general criteria of the International Clas-sification of Sleep Disorder, second edition (ICSD-2) to classify insomnia [1]. Participants were classified as having insomnia if they reported in the sleep diary, for at least 3 of the 7 nights, either (i) wake after sleep onset (WASO) > 30 minutes or (ii) sleep onset latency (SOL) > 30 minutes. These symptoms should be associated with either poor sleep quality or low mood. Poor sleep quality was defined as < 5 on a 0–10 scale where 0 = very bad sleep quality and 10 = very good sleep quality. Low mood was defined as < 5 on final waking on 0–10 scale where 0 = very tense and 10 = very calm. We chose the frequency of≥3 nights and duration of SOL and WASO of > 30 minutes as these are the most commonly recommended criteria [1,3,32].
Statistical Analyses
Statistical analyses were conducted as described below using SPSS version 19 (SPSS Inc., Chicago, IL), MedCalc for Windows, version 12.2.1.0 (MedCalc Software, Mariakerke, Belgium) and Meta-DiSc data analysis software [33].
Assessment of test properties
Discriminatory properties of self-report questionnaires were tested using the sleep diary as the reference test and each questionnaire as the index test.
1. The scores from the index tests were used to construct Receiver Operator Characteristic (ROC) curves using non-parametric methods [34], with the Area Under the Curve (AUC) used to examine each test’s accuracy to discriminate participants with insomnia from those without insomnia. The AUC ranges from 0 to 1.0 with a value of 0.5 representing discrimination no better than chance. Using
DeLong’s method ROC curves were compared to test for statistically significantly differences between AUCs [34]. AUC values were interpreted using guidelines provided by Swets (1988) [35]: (0.5 to 0.7 = low accuracy, 0.7 to 0.9 = moderate accuracy, >0.9 = high accuracy).
2. Index test scores were dichotomised using both the ROC technique and scores based on the literature: for the Pittsburgh questionnaire we used cut-off points of > 5 [18] and > 10 [36], a cut-off > 14 for the Insomnia index [19], and for the Epworth scale we used a cut-off point of >10 [26]. A 2 x 2 table was created to calculate sensitivity, specificity, positive likelihood ratio and negative likelihood ratio. Sensitivity was defined as the proportion of people with insomnia who tested positive, while specificity was defined as the proportion of people without insomnia who tested negative.
Results
Participants’description
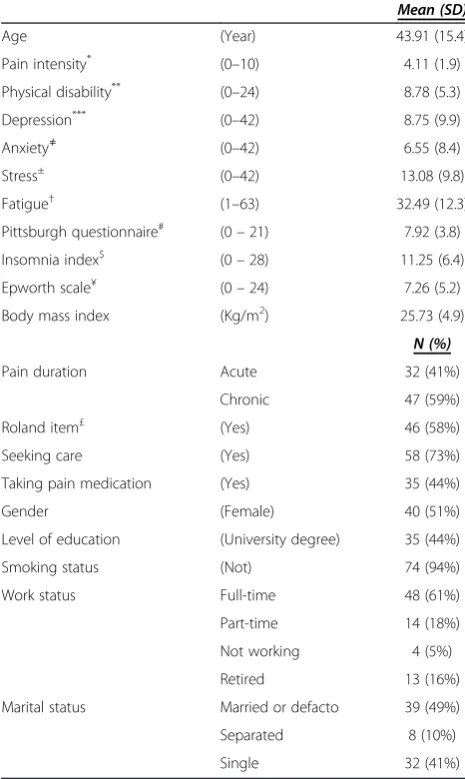
[image:4.595.304.537.216.606.2]A total of 101 patients with LBP were interested in partici-pating in the study. Of those, eighty patients met the study criteria and were enrolled in the study. One participant did not complete the sleep diary and was therefore ex-cluded from the analyses, leaving a total of 79 participants. Participants’ demographic and clinical information are
Table 1 Sample’s demographic and clinical characteristics
Mean (SD)
Age (Year) 43.91 (15.4)
Pain intensity* (0–10) 4.11 (1.9)
Physical disability** (0–24) 8.78 (5.3)
Depression*** (0–42) 8.75 (9.9)
Anxiety≠ (0–42) 6.55 (8.4)
Stress± (0–42) 13.08 (9.8)
Fatigue† (1–63) 32.49 (12.3)
Pittsburgh questionnaire# (0
–21) 7.92 (3.8)
Insomnia index$ (0
–28) 11.25 (6.4)
Epworth scale¥ (0
–24) 7.26 (5.2)
Body mass index (Kg/m2) 25.73 (4.9)
N (%)
Pain duration Acute 32 (41%)
Chronic 47 (59%)
Roland item£ (Yes) 46 (58%)
Seeking care (Yes) 58 (73%)
Taking pain medication (Yes) 35 (44%)
Gender (Female) 40 (51%)
Level of education (University degree) 35 (44%)
Smoking status (Not) 74 (94%)
Work status Full-time 48 (61%)
Part-time 14 (18%)
Not working 4 (5%)
Retired 13 (16%)
Marital status Married or defacto 39 (49%)
Separated 8 (10%)
Single 32 (41%)
*
Brief Pain Inventory on 0–10 NRS, 0 = no pain, 10 = pain as bad as you can imagine.**
Roland and Morris Disability Questionnaire: the higher score indicates more severe disability.***
Depression subscale of the DASS-21: 0–9 = no depression, 10–13 = mild depression, 14–20 = moderate depression, 21–27 = severe depression and over 28 = extremely severe depression.≠Anxiety subscale of the DASS-21: 0–7 = no anxiety, 8–9 = mild anxiety, 10 - 14 = moderate anxiety, 15–19 = severe anxiety and more than 20 = extremely severe anxiety.
±
Stress subscale of the DASS-21: 0–14 = normal level of stress, 15–18 = mild stress, 19–25 = moderate stress, 26–33 = severe stress and over 37 = extremely severe stress.†Fatigue Severity Scale: a total score of less than 36 suggests no fatigue, while a total score of 36 or more suggests fatigue and further evaluation by a physician is needed;#
Pittsburgh sleep quality index: > 5 indicates poor sleep quality;$
Insomnia severity index: > 14 indicates clinical insomnia;¥
Epworth sleepiness scale: > 10 indicates excessive day-time sleepiness.
£
presented in Table 1.The mean Pittsburgh questionnaire score (7.9) was above the cut-off score for poor sleep qual-ity (> 5) [18], while the mean of the Insomnia index total score (11.2) was below the cut-off score of clinical insom-nia (i.e. > 14) [19], indicating sub-threshold insominsom-nia. The mean score of the Epworth scale (7.2) was within the nor-mal range (i.e. < 10) [26], an index of nornor-mal day-time sleepiness. According to the Roland item 46/79 (58%) par-ticipants reported that they sleep less well because of their low back pain. The disability assessment as measured by the Roland and Morris disability questionnaire indicated a moderate level of disability. Scores of psychological distress on the DASS-21 showed levels of depression, stress and anxiety to be within the normal range. Fatigue assessment using the fatigue severity scale showed normal fatigue level. The sleep diary reports showed that none of the partici-pants used a medication that can influence sleep, including insomnia medication, during the study period.
[image:5.595.57.540.505.696.2]Accuracy of questionnaires in insomnia detection
Figure 1 and Table 2 illustrate the receiver operator charac-teristic (ROC) curves and the area under the curves (AUCs) of the four sleep measures. The Pittsburgh questionnaire (AUC = 0.79, 95% CI = 0.68 – 0.87) and Insomnia index (AUC = 0.78, 95% CI = 0.67 – 0.86) showed moderate ac-curacy in distinguishing between patients with insomnia and those without. In contrast, the Roland item (AUC = 0.64, 95% CI = 0.53–0.75) and Epworth scale (AUC = 0.53, 95% CI = 0.41–0.64) had only low accuracy. Pairwise com-parison between AUCs, using the DeLong method [34], showed that both the Pittsburgh questionnaire and the In-somnia index were significantly different from the Roland item and Epworth scale (p < 0.05) (Table 3).
Table 4 shows the prevalence of insomnia produced by each measure and sensitivity, specificity, positive likeli-hood ratio (LR+) and negative likelihood ratio (LR-) with their 95% confidence intervals of the four questionnaires. The global cut-off score of > 5 for the Pittsburgh ques-tionnaire [18] yielded a sensitivity of 100% and a specifi-city of 44%. The optimal cut-off score of > 6 (generated by the ROC curve technique) resulted in a sensitivity of 100% and a slightly higher specificity of 49% with a LR+ of 1.9 and a LR-of 0.0. The prevalence of insomnia was 63%. The cut-off score of > 10 resulted in higher specifi-city of 85% and a sensitivity of 50%. For the Insomnia index, we used the cut-off point of > 14 as reported in the literature [19] and found it to be the optimal cut-off point. It yielded a sensitivity of 60% and a specificity of 86% and the LR+was 4.43 with 0.46 for the LR. The > 14 cut-off point resulted in an insomnia prevalence of 25%. The Roland item yielded a sensitivity of 49% and a speci-ficity of 80% and the prevalence of insomnia was 58%. Finally, the cut-off score of > 10 for the Epworth scale [26] resulted in sensitivity of 76% with very low specifi-city (20%) and the prevalence of insomnia was 23%. For details of all scores’ properties of the Pittsburgh ques-tionnaire and the Insomnia index [see Additional file 1 and Additional file 2].
Discussion
Insomnia is prevalent in patients with LBP [5,9]. Identi-fying a measure to detect insomnia that is accurate, brief and easy to administer in this population is essential so that clinicians and researchers can gain a more complete understanding of these common co-morbidities. We evaluated the discriminatory properties of four
report sleep measures (the Pittsburgh questionnaire, In-somnia index, Epworth scale and the Roland item). These measures were selected because they are widely employed to assess sleep quality and they assess some insomnia symptoms such as sleep disturbance and day-time sleepiness. Our findings suggest that the Pittsburgh questionnaire and the Insomnia index are accurate in-struments for screening insomnia in patients with LBP, while the Epworth and the Roland have unacceptably low accuracy.
The Epworth scale and Roland item showed poor ac-curacy to distinguish between patients with insomnia and those without. This may be because each of these questionnaires only assesses a single criterion of insom-nia. The Roland item measures sleep quality (the impact of LBP on a patient’s sleep), while the Epworth scale measures day-time sleepiness. Although sleep disturb-ance and day-time sleepiness are considered to be im-portant traits of insomnia diagnosis, they are inadequate for an insomnia diagnosis.
Although the Pittsburgh questionnaire is designed to assess sleep quality and sleep disturbance, it additionally includes the assessment of day-time impairment related to disturbed sleep: day-time sleepiness and the influence of disturbed sleep on a patient’s social activity. Likewise the Insomnia index measures the severity of insomnia and its effect on a patient’s day-time functioning. The ROC analysis indicated that both the Pittsburgh ques-tionnaire and Insomnia index were able to accurately
distinguish patients with insomnia from those without. These findings suggest that when the goal is to diagnose insomnia a measure that combines several insomnia cri-teria is more accurate than a single criterion measure. This is supported by the work of Sanford et al. [37] who evalu-ated the accuracy of the Epworth scale to diagnose insom-nia in a community sample. They found that although participants with insomnia reported statistically signifi-cantly higher scores of sleepiness than those without in-somnia, the ROC curve analysis demonstrated that the scale had poor accuracy to diagnose insomnia. The au-thors concluded that a measure that combines several insomnia criteria is likely to provide a more accurate diagnosis.
[image:6.595.56.293.100.171.2]Identifying the optimal cut-off score of a questionnaire is essential to identify patients who require further sleep evaluation and those who may require intervention. Our analysis of sensitivity and specificity for the Pittsburgh questionnaire using the recommended global score of > 5 showed that although the questionnaire yielded a high sensitivity of 100%, the specificity was low at 44%. The optimal cut-off score of > 6, identified from the ROC curve, resulted in a slightly higher specificity of 49% with 100% sensitivity. This finding concurs with the finding of Backhaus et al. [18] who examined the psychometric properties of the Pittsburgh questionnaire for patients with primary insomnia. The authors reported that the cut-off score of > 6 increased the questionnaire’s capacity to rule out patients without clinical insomnia. Although both scores yielded a high sensitivity (100%), which indi-cated that all of the patients with insomnia have been detected, both cut-off scores had low specificity suggesting that half of the patients had been incorrectly identified as having insomnia. Higher sensitivity is an important characteristic of a screening tool in the pri-mary care setting as it is often more important not to miss any patients with the condition than to incorrectly identify some without it. On the other hand, for research purposes high specificity may be required to rule out people without the condition and therefore provide
Table 3 Pairwise comparison between areas under the ROC curve
Comparison Difference between areas z statistic P-value
(95% CI)*
Pittsburgh questionnaireavs Insomnia indexb 0.01 (−0.07 to 0.09) 0.18 0.85
Pittsburgh questionnaireavs Roland itemc 0.14 (0.01 to 0.28) 2.11 0.03
Pittsburgh questionnaireavs Epworth scaled 0.26 (0.09 to 0.41) 3.03 0.002
Insomnia indexbvs Roland itemc 0.13 (0.003 to 0.27) 2.00 0.04
Insomnia indexbvs Epworth scaled 0.25 (0.09 to 0.41) 3.05 0.002
Epworth scaledvs Roland itemc 0.11 (−0.05 to 0.28) 1.33 0.18
*
Confidence interval,a
Pittsburgh sleep quality index,b
Insomnia severity index,c
sleep item of the Roland and Morris disability questionnaire,
d
[image:6.595.56.539.605.716.2]Epworth sleepiness scale.
Table 2 Area under the curve of the four measures
Test AUCa 95% CI
Pittsburgh questionnaireb 0.79 0.68 to 0.87
Insomnia indexc 0.78 0.67 to 0.86
Roland itemd 0.64 0.53 to 0.75
Epworth scalee 0.53 0.41 to 0.64
a
Area under the curve,b
Pittsburgh sleep quality index,c
Insomnia severity index,d
Sleep item of the Roland and Morris disability questionnaire,
e
homogenous sample of individuals with a high probably of having the condition. It has been suggested that cut-off score of > 10 for the Pittsburgh questionnaire would in-crease the questionnaire’s accuracy to detect people who have difficulty in initiating and maintaining sleep, which is an important trait of insomnia [17,36]. Our data showed the cut-off score > 10 resulted in a specificity of 85% with a sensitivity of 50%. The rate of insomnia accordingly de-clined to 24%, which was closer to the estimate reported by the sleep diary (25%).
The cut-off score of > 14 for the Insomnia index pro-duced optimal discrimination between patients with insomnia and those without (sensitivity 60% and specifi-city 86%). This result is similar to that of Smith and Trinder [19] who found that a cut-off score of > 14 pro-vided optimal discrimination between people with primary insomnia and the control group. Although this score max-imized both sensitivity and specificity to 94%, with an AUC value of 0.97, the study was a case–control design which might have led to overestimation of test accuracy [38]. Savard et al. [14] who examined the discriminatory properties of the Insomnia index in a sample of 1670 pa-tients with cancer, similarly reported that the cut-off score of >14 provided optimal discrimination between patients with insomnia and those without insomnia (sensitivity 51% and specificity 91%).
In clinical practice, likelihood ratios are more useful than sensitivity and specificity for characterising test ac-curacy [39]. Likelihood ratios indicate likely the test result is in people with the disease compared to those without the disease [40]. The likelihood ratio analysis (Table 4) suggests that the Insomnia index was marginally more ac-curate than the Pittsburgh questionnaire for detecting patients with insomnia. The analysis demonstrated that a score of 15 points or more on the Insomnia index is 4.43 times more likely in someone with insomnia than some-one without insomnia. In addition to its accuracy, the Insomnia index is briefer, easier to administer and to score than the Pittsburgh questionnaire. The Insomnia index
therefore appears to be most useful for insomnia assess-ment of patients with LBP.
This study had limitations that should be addressed. First, although the sleep diary is considered to be a use-ful tool to diagnose insomnia, its subjective nature is a disadvantage. It has been suggested that patients with sleep problems have the tendency to misperceive their sleep. These patients tend to underestimate their sleep duration and overestimate sleep latency and duration of waking after sleep onset [41]. This limitation potentially influenced sleep variables derived from the sleep diary and therefore the study findings. Second, the study did not investigate sleep-related disorders that may occur along with insomnia, for example sleep apnea and peri-odic limb movement, which might confound the insom-nia assessment. A strength of this study is however that we followed the guidelines for assessing insomnia [1] and the recommendations for designing studies for a diagnos-tic testing [38]. Additionally, it is the first study to provide guidelines for the optimal assessment of insomnia in pa-tients with LBP using self-reported questionnaires. Finally, the inclusion of patients with LBP who were seeking health care for their LBP, as well as those who were not, increases the representativeness of the sample.
Conclusions
[image:7.595.58.539.112.235.2]This is the first study to provide guidelines for the opti-mal assessment of insomnia in patients with LBP using self-reported questionnaires. The study findings showed that the Pittsburgh questionnaire and the Insomnia index are useful instruments for screening insomnia in patients with LBP. The cut-off score of > 6 for the Pittsburgh questionnaire and cut-off score of > 14 for the Insomnia index provided optimal sensitivity and specifi-city for the detection of insomnia. The Insomnia index is the briefer, easier to administer and to score, there-fore, appears the most appropriate instrument to identify insomnia in the LBP population.
Table 4 Prevalence of insomnia, sensitivity, specificity, positive likelihood ratio and negative likelihood ratio values at reported cut-off points and optimal discriminatory cut-off point for each measure
Test Cut-off point Insomnia % Sensitivity Specificity LR+ a LR- b
(95% CI) (95% CI) (95% CI) (95% CI)
Sleep diary (ICSD-2)c 25%
Pittsburgh questionnaired >5 67% 100 (83–100) 44 (31–58) 1.8 (1.3 - 2.4) 0
>6e 63% 100 (83–100) 49 (36–63) 1.9 (1.5–2.5) 0
>10 24% 50 (27–73) 85 (73–93) 3.28 (2.1 - 5.1) 0.59 (0.3 - 1.2)
Insomnia indexf >14e 25% 60 (36–81) 86 (75–94) 4.43 (3.1 - 6.4) 0.46 (0.2 - 1.1)
Roland itemg Yes/no 58% 49 (36–63) 80 (56–94) 2.46 (0.99–6.13) 0.64 (0.46–0.89)
Epworth scaleh >10 23% 76 (63–86) 20 (6–44) 0.95 (0.73–1.24) 1.19 (0.44–3.19)
a
Positive likelihood ratio,b
Negative likelihood ratio,c
International classification of sleep disorders,d
Pittsburgh sleep quality index,e
Maximized cut-off point,
f
Insomnia severity index,g
Sleep item of the Roland and Morris disability questionnaire,h
Additional files
Additional file 1:Properties of scores of the Pittsburgh
questionnaire (doc).The file provides sensitivity, specificity and positive likelihood ratio and negative likelihood ratio values of the Pittsburgh questionnaire scores.
Additional file 2:Properties of scores of the Insomnia index (doc).
The file provides sensitivity, specificity and positive likelihood ratio and negative likelihood ratio values of the Insomnia index scores.
Competing interests
The authors have no competing interests to report.
Authors’contributions
SA was responsible for data collection, data analysis and drafting of the manuscript. JM contributed to the design and conception of the study, critical revision, important intellectual content and drafting of the manuscript. CM helped with the design and conception of the study, the statistics, and also performed critical revisions and supervision. JH
contributed to the study design and critical revision. NH was involved in the statistics interpretation of data. DB and RG helped with data collection, data analysis and critical revisions and drafting of the manuscript. All of the authors have read and approved the final manuscript.
Acknowledgements
This research was supported by a grant from the University of Sydney, Sydney Medical School, Sydney, Australia. The authors are indebted to all patients who participated in the study. We would also like to gratefully acknowledge the assistance of physiotherapists who participated in patient recruitment. Mr. Alsaadi is a PhD student who is supported by the University of Dammam, Kingdom of Saudi Arabia. Prof. Maher’s fellowship is funded by the Australian Research Council.
Author details
1
The George Institute for Global Health, Sydney Medical School, University of Sydney, Missenden Road, P.O. Box M201, Sydney, New South Wales, Australia. 2
Neuroscience Research Australia and the University of New South Wales, Sydney, New South Wales, Australia.3Department of Health Professions, Macquarie University, Sydney, New South Wales, Australia.4The Woolcock Institute of Medical Research, University of Sydney, Sydney, New South Wales, Australia.5Institute of Public Health, University of Heidelberg, Heidelberg, Germany.6Department of Respiratory and Sleep Medicine, Royal Prince Alfred Hospital, Sydney, New South Wales, Australia.
Received: 9 November 2012 Accepted: 13 June 2013 Published: 27 June 2013
References
1. Edinger JD, Bonnet MH, Bootzin RR, Doghramji K, Dorsey CM, Espie CA, Jamieson AO, McCall WV, Morin CM, Stepanski EJ, American Academy of Sleep Medicine Work G:Derivation of research diagnostic criteria for insomnia: report of an American Academy of Sleep Medicine Work Group.Sleep2004,27:1567–1596.
2. Summers MO, Crisostomo MI, Stepanski EJ:Recent developments in the classification, evaluation, and treatment of insomnia.Chest2006,
130:276–286.
3. Buysse DJ, Ancoli-Israel S, Edinger JD, Lichstein KL, Morin CM:
Recommendations for a standard research assessment of insomnia. Sleep2006,29:1155–1173.
4. Sivertsen B, Krokstad S, Overland S, Mykletun A:The epidemiology of insomnia: associations with physical and mental health. The HUNT-2 study.J Psychosom Res2009,67:109–116.
5. van de Water AT, Eadie J, Hurley DA:Investigation of sleep disturbance in chronic low back pain: an age- and gender-matched case–control study over a 7-night period.Man Ther2011,16:550–556.
6. O’Donoghue GM, Fox N, Heneghan C, Hurley DA:Objective and subjective assessment of sleep in chronic low back pain patients compared with healthy age and gender matched controls: a pilot study.
BMC Musculoskelet Disord2009,10:122.
7. Morin CM, Benca R:Chronic insomnia.Lancet2012,379:1129–1141.
8. Haack M, Scott-Sutherland J, Santangelo G, Simpson NS, Sethna N, Mullington JM:Pain sensitivity and modulation in primary insomnia.Eur J Pain2012,16:522–533.
9. Tang NKY, Wright KJ, Salkovskis PM:Prevalence and correlates of clinical insomnia co-occurring with chronic back pain.J Sleep Res2007,16:85–95. 10. Buysse DJ, Reynolds CF 3rd, Monk TH, Berman SR, Kupfer DJ:The
Pittsburgh Sleep Quality Index: a new instrument for psychiatric practice and research.Psychiatry Res1989,28:193–213.
11. Morin C:Insomnia: Psychological Assessment and Management.New York, London: The Guilford Press; 1993.
12. Johns MW:A new method for measuring daytime sleepiness: the Epworth sleepiness scale.Sleep1991,14:540–545.
13. Roland M, Morris R:A study of the natural history of back pain. Part I: development of a reliable and sensitive measure of disability in low-back pain.Spine1983,8:141–144.
14. Savard MH, Savard J, Simard S, Ivers H:Empirical validation of the Insomnia Severity Index in cancer patients.Psychooncology2005,14:429–441. 15. Beck SL, Schwartz AL, Towsley G, Dudley W, Barsevick A:Psychometric
evaluation of the Pittsburgh Sleep Quality Index in cancer patients. J Pain Symptom Manage2004,27:140–148.
16. Fictenberg NL, Putnam SH, Mann NR, Zafonte RD, Millard AE:Insomnia screening in postacute traumatic brain injury: utility and validity of the Pittsburgh Sleep Quality Index.Am J Phys Med Rehabil2001,80:339–345. 17. Violani C, Devoto A, Lucidi F, Lombardo C, Russo PM:Validity of a short
insomnia questionnaire: the SDQ.Brain Res Bull2004,63:415–421. 18. Backhaus J, Junghanns K, Broocks A, Riemann D, Hohagen F:Test-retest
reliability and validity of the Pittsburgh Sleep Quality Index in primary insomnia.J Psychosom Res2002,53:737–740.
19. Smith S, Trinder J:Detecting insomnia: comparison of four self-report measures of sleep in a young adult population.J Sleep Res2001,10:229–235. 20. Morin CM, Belleville G, Belanger L, Ivers H:The Insomnia Severity Index:
psychometric indicators to detect insomnia cases and evaluate treatment response.Sleep2011,34:601–608.
21. Monk TH, Reynolds CF 3rd, Kupfer DJ, Buysse DJ, Coble PA, Hayes AJ, Machen MA, Petrie SR, Ritenour AM:The Pittsburgh Sleep Diary.J Sleep Res 1994,3:111–120.
22. Balague F, Mannion AF, Pellise F, Cedraschi C:Non-specific low back pain. Lancet2012,379:482–491.
23. Cleeland CS, Ryan KM:Pain assessment: global use of the Brief Pain Inventory.Ann Acad Med Singapore1994,23:129–138.
24. Brown TA, Chorpita BF, Korotitsch W, Barlow DH:Psychometric properties of the Depression Anxiety Stress Scales (DASS) in clinical samples. Behav Res Ther1997,35:79–89.
25. Krupp LB, LaRocca NG, Muir-Nash J, Steinberg AD:The fatigue severity scale. Application to patients with multiple sclerosis and systemic lupus erythematosus.Arch Neurol1989,46:1121–1123.
26. Chervin RD, Aldrich MS, Pickett R, Guilleminault C:Comparison of the results of the Epworth Sleepiness Scale and the Multiple Sleep Latency Test.J Psychosom Res1997,42:145–155.
27. Davidson M:Rasch analysis of 24-, 18- and 11-item versions of the Roland-Morris Disability Questionnaire.Qual Life Res2009,18:473–481. 28. Kelly GA, Blake C, Power CK, O’Keeffe D, Fullen BM:The association
between chronic low back pain and sleep: a systematic review.Clin J Pain2011,27:169–181.
29. Passik SD, Whitcomb LA, Kirsh KL, Theobald DE:An unsuccessful attempt to develop a single-item screen for insomnia in cancer patients.J Pain Symptom Manage2003,25:284–287.
30. Alsaadi SM, McAuley JH, Hush JM, Maher CG:Erratum to: Prevalence of sleep disturbance in patients with low back pain.Eur Spine J2012,
21:554–560.
31. Buysse DJ, Hall ML, Strollo PJ, Kamarck TW, Owens J, Lee L, Reis SE, Matthews KA:Relationships between the Pittsburgh Sleep Quality Index (PSQI), Epworth Sleepiness Scale (ESS), and clinical/polysomnographic measures in a community sample.J Clin Sleep Med2008,4:563–571. 32. Lichstein KL, Durrence HH, Taylor DJ, Bush AJ, Riedel BW:Quantitative
criteria for insomnia.Behav Res Ther2003,41:427–445.
33. Zamora J, Abraira V, Muriel A, Khan K, Coomarasamy A:Meta-DiSc: a software for meta-analysis of test accuracy data.BMC Med Res Methodol2006,6:31. 34. DeLong ER, DeLong DM, Clarke-Pearson DL:Comparing the areas under
35. Swets JA:Measuring the accuracy of diagnostic systems.Science1988,
240:1285–1293.
36. Okun ML, Kravitz HM, Sowers MF, Moul DE, Buysse DJ, Hall M:Psychometric evaluation of the Insomnia Symptom Questionnaire: a self-report measure to identify chronic insomnia.J Clin Sleep Med2009,5:41–51. 37. Sanford SD, Lichstein KL, Durrence HH, Riedel BW, Taylor DJ, Bush AJ:The
influence of age, gender, ethnicity, and insomnia on Epworth sleepiness scores: a normative US population.Sleep Med2006,7:319–326. 38. Lijmer JG, Mol BW, Heisterkamp S, Bonsel GJ, Prins MH, van der Meulen JH,
Bossuyt PM:Empirical evidence of design-related bias in studies of diagnostic tests.JAMA1999,282:1061–1066.
39. Sonis J:How to use and interpret interval likelihood ratios.Fam Med 1999,31:432–437.
40. Deeks JJ, Altman DG:Diagnostic tests 4: likelihood ratios.BMJ2004,
329:168–169.
41. Harvey AG, Tang NK:(Mis)perception of sleep in insomnia: a puzzle and a resolution.Psychol Bull2012,138:77–101.
doi:10.1186/1471-2474-14-196
Cite this article as:Alsaadiet al.:Detecting insomnia in patients with low back pain: accuracy of four self-report sleep measures.BMC Musculoskeletal Disorders201314:196.
Submit your next manuscript to BioMed Central and take full advantage of:
• Convenient online submission
• Thorough peer review
• No space constraints or color figure charges
• Immediate publication on acceptance
• Inclusion in PubMed, CAS, Scopus and Google Scholar
• Research which is freely available for redistribution