2018 2nd International Conference on Modeling, Simulation and Optimization Technologies and Applications (MSOTA 2018) ISBN: 978-1-60595-594-0
Method for Judging Output Limit Value of Addition and Subtraction
Force of Thermal Power Unit Based on Data Analysis
Wei-chun GE
1, Qi-li HUANG
2, Jian-xin ZHU
3, Jian-guo WANG
4,
Qun CHEN
5and Gui-ping ZHOU
1,*1
State Grid Liaoning Electric Power Co., Ltd., Shenyang 110004, China
2
State Grid Corporation of China. Beijing, 100031 China
3
Shenyang Shijie Electrical Appliance Co., Ltd. Shenyang 110000 China
4
Northeast Electric Power University. Jilin, 132012 China
5Tsinghua University. Beijing, 100084 China
*Corresponding author
Keywords: Upper and lower limits of thermal power output, Additional force margin, Reduced force margin, Energy storage input criterion, Abandonment wind criterion.
Abstract. For a high proportion of wind power connected to the power grid, if it is a dry season, the
peak regulation of the power grid only depends on thermal power, but the upper and lower limits of thermal power regulation often do not match the actual situation. Therefore, the paper proposed to use the historical data of the output of the thermal power unit to dynamically calculate the upper and lower limits of the output of the thermal power unit, and obtained the margin of added and subtracted output forces of thermal power units, thus judging the critical state of energy storage input and wind abandonment in power grid, which providing a theoretical basis for predicting the capacity of thermal power units to add and subtract output forces, energy storage input and wind abandonment conditions. Combined with the actual example, the dynamic calculation the upper and lower limits of e output and total power generation of the thermal power unit are basically consistent with the given upper and lower limits value, indicating that the limits calculated by this method are in line with the actual requirements of the grid operation; The energy storage input and abandonment criteria proposed in the paper are also consistent with the actual operation of the power grid, and have practical guiding significance for the power grid with large-scale wind power access and large-scale energy storage.
Introduction
Thermal power is the main means of regulation of the power grid. The upper and lower limits of the regulation are fixed. When the operating conditions of the unit change, the upper and lower limits will change greatly, and the unit will deviate from the upper and lower limits. To this end, a method is needed. The upper and lower limits of the thermal power unit adjustment can be dynamically determined, and the unit's output force or the output force margin can be dynamically determined, thereby judging the timing of the grid input energy storage and wind abandonment.
demonstration project, the objective of the flexibility transformation and the effective technical means to improve the peak peaking capacity of the unit are analyzed. It is demonstrated that the early implementation of the flexibility transformation is the thermal power unit response grid. Deep peaking policy, enhances market competitiveness, and improves the necessary life cycle of the enterprise. In literature [3], a new mechanism based on Caldo's improved wind-fire composite system for deep peak shaving is proposed, and the realization method of deep peaking potential by adjusting the participant's benefit distribution mining system is discussed. The three types of units, namely pure solidification, thermoelectricity and wind power, are representative. The unit efficiency and constraint expression are analyzed, and the compensation and allocation items are added to the objective function. The mathematical model of deep peak shaving which introduces the Caldo improvement mechanism is established. The literature [4] analyzes the current operating rules of the thermal power plant deep peak shaving market in Northeast China, and proposes different flexibility transformation technical routes for heating units and pure condensing units, and each technical route from the perspective of operational safety and economy. Analyze and compare, and put forward the rationality suggestion of the thermal power unit in the flexibility transformation. Literature [5] proposes a scheduling mode in which the wind farm and the heat and power cogeneration with heat storage form a joint operation, and based on the scheduling model, a joint system optimization scheduling model considering wind power output uncertainty is proposed. The model makes full use of the flexibility of the storage tank to realize the coordination between the online operation and the penalty cost of the joint operation system, and obtains the scheduling strategy of the joint operation of the wind farm and the combined heat and power generation with the highest profit. Literature [6] proposes a general mathematical method and flexibility metric for multi-time scale flexibility supply-demand balance; establishes a probabilistic model of flexibility margin, and clarifies three types of flexibility: curve translation class, curve shaping class and comprehensive class. Sexual increase approach; based on the flexibility balance mechanism, the comprehensive flexibility optimization in the source-network-load-storage complex scenario can be realized. Literature [7] proposed a new method to evaluate the wind power receiving capacity and wind abandonment situation of the future power grid. After theoretical analysis and regression correction, the calculation of the received space power and standby rate, the load rate, the load power, and the minimum output coefficient of the conventional unit are obtained. The model analyzes the relationship between the abandonment rate and the wind power theoretical power accounted for the proportion of the space in the space. The curve is used to obtain the segmentation linear function of the wind rate and the ratio, to accept the space power as a bridge, and obtain the wind rate and the standby rate, load rate, load capacity, the minimum technical output coefficient of conventional units, and the calculation model of wind power theoretical power.
The above results are aimed at improving the wind power consumption by improving the thermal power unit flexibility [8], or by the heat storage and electric boiler combined heat generating unit to eliminate the wind [9]; in fact, the thermal power unit flexibility is mainly reflected in its regulation. Capability, capacity of the unit in operation or reduced capacity [10], energy storage in the grid, the best time for energy storage [11], wind must be abandoned [12], conditions for wind abandonment, etc. in this paper, it will research on these aspects.
Analysis of Static Addition and Subtraction Force Data of Thermal Power Units
Method for Dividing the Grid Operation Control Domain
unit number, and PM is the maximum output of the unit's thermal power, and Pm is the minimum
output of the thermal power unit. t is the date, where PM and Pm can be given the maximum and
minimum values according to the thermal power unit; the thermal power unit output PG interval may
be 15 minutes, or may be one hour, the maximum output of the unit The value PM is calculated as
shown in the formula (1).
M GJ
J
max
P
P
(1)Among them: PGJ represents the I unit, the power of the thermal power unit at point J, the data for
one day may be 24 points, it may be 96 points, or it may be 1440 points. The calculation formula of the unit output minimum value Pm is as shown in equation (2).
m GJ
J min
P P (2)
A new PG (I0, PM, Pm, t) is calculated every day thereafter, if the formula (3) is satisfied.
G , M, 1 M G , M, 1 m
P I P t P 或P I P t P (3) Replace the PM or Pm in the original array with the new PM or Pm to form a new unit maximum and
minimum sequence PG(I, PM, Pm, t+1). Then, the adjustment capability ΔP GI of the thermal power
unit I can be expressed by the formula (4), that is, the difference between the maximum output force
PM and the minimum output force Pm of the unit.
GI G , M, G , m,
P P I P t P I P t
(4) According to the formula (4), the adjustment capability of each unit can be calculated, and the total adjustment capability ΔPG can be expressed by equation (5).
G
G I GI
N
P P
(5) Among them: NG indicates the number of units of the thermal power unit.The total adjustment capacity ΔPG can also be represented by the formula (6).
G GE Gm1
P
P
P
(6)PGm1 is the total minimum output value of the thermal power unit, PGE is the total maximum output
value of the thermal power unit, and PGE can be expressed by the formula (7).
G 0
N
GE I G , M,
P
P I P t (7)In the PG (I, PM, Pm, t) array, only three variables, I, PM, and t, the total minimum output force of the
thermal power unit PGm1 can be 8) Expression.
G 0
N
Gm1 I G , m,
P
P I P t (8)Among them: in the PG (I0, PM, Pm, t) array, only three variables of I, Pm, tare needed.
Then, the thermal power unit output margin ΔPM can be represented by (9).
G 0
N
M GE G I G , M, G
P P P P I P t P
(9)Among them: PG is the total output of thermal power generating units.
Then, the thermal power unit reduction force marginΔPm can be expressed by the formula (10).
G 0
N
m G Gm1 G I G , m,
P P P P P I P t
In the operation of the power grid, it is necessary to know how many thermal power units NG are
running at that time. The maximum PM, minimum Pm output of each unit, the maximum and minimum
total output PGE and PGm1. What is the maximum adjustment capacity ΔPG, and what is the thermal
power unit's marginΔPM and the output margin ΔPm, which is of great significance for ensuring the
safe and stable operation of the grid.
Thermal Power Unit Dynamic Maximum Output and Minimum Output Data Analysis
It is extremely important to be able to grasp the up-and-down adjustment margin of the thermal power unit operating in the power grid [13]. However, it is most important to add the maximum and minimum output of the thermal power unit. The premise is that each unit has the most important. The maximum output and minimum output must be known in advance [14]. To this end, the dynamic maximum output and minimum output are defined. When one week later, the PM and Pmin array PG (I, PM, Pm, t)did not change, as shown in equations (11) and (12).
G M m G M m
G m
, , , 1 , , ,
,0, , 1
P I P P t P I P P t
P I P t (11)
or
G M m G M m
G M
, , , 1 , , ,
, ,0, 1
P I P P t P I P P t
P I P t (12)
Then, using the data of 7 days of the previous week, a maximum or minimum substitution of PM
and Pm is selected according to formulas (1) and (2). A dynamic thermal power unit add-on margin
ΔPM and a reduced force margin ΔPm are formed. Ensure that it is more in line with the actual
operation of the grid.
Thermal Power Unit Added Margin PM and Reduced Margin Pm Practical Application
Increase Margin PM Application
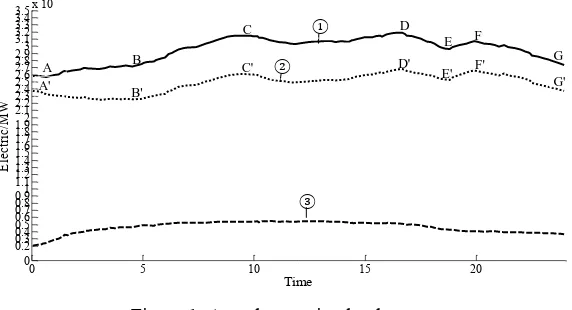
During the period of the output force, the power grid needs to follow the rapid change of the load. If the ability of the thermal power is added, it is significant to ensure that the frequency or tie line is within the specified limits [15]. Figure 1 shows the actual running curve of the grid one day. Figure 1, curve 1 is the actual load curve, the maximum load is 26.85 million kilowatts, the minimum load is 22.35 million kilowatts, curve 3 is the wind power generation curve, the maximum is 5.5 million kilowatts, curve 2 is the composite curve of the load curve and the wind power generation curve. There are two key periods for loading, BC and EF, which are all periods of rapid load increase. By grasping the size ofΔPM, it can be coordinated with hydropower, tie line and frequency in time, and
0 5 10 15 20 0 0.2 0.3 0.4 0.5 0.6 0.7 0.8 0.91 1.1 1.2 1.3 1.4 1.5 1.6 1.7 1.8 1.92 2.1 2.2 2.3 2.4 2.5 2.6 2.7 2.8 2.93 3.1 3.2 3.3 3.4 3.5x 10
[image:5.595.156.442.75.230.2]4 Time E lect ri c/ MW C' C D E F F' E' G G' ③ ② D' B' B A A' ①
Figure 1. Actual operating load curve.
The coordination of thermal power, hydropower, tie lines and frequency is still actually coordinated by the water and fire coordination link and frequency within the limits [16]. Therefore, if it is dry season, in order to save water and electricity, first add thermal powerPM, when the constraint of (13)
is reached, the hydropower is adjusted.
M
P
(13) Where ε is the lowest adjustment margin, typically is 10 MW.
If it is a dry season, only the thermal power itself adjusts, by mastering the size ofPMensures the
safety of the grid.
In the grid load phase, water and thermal power is increased under the constraint of (13) and increases with the load.
Reduced Power Margin Pm Application
The normal domain and the emergency domain can be implemented by conventional methods. For example, the normal automatic power generation control of the power grid can realize the normal domain operation; the emergency domain also has the corresponding wind power automatic power generation control to realize the abandoned wind control. This paper focuses on the abnormal domain control method.
In the actual power grid, it is more meaningful to master the ability of the grid to reduce power. It can be seen from Figure 1 that in fact, the load reduction force has only one period, starting from point F, passing through point G, point A to point B, for a long process of about 8 hours, the load drops by 4.5 million kilowatts, which is relatively largest. The load has dropped by 16.76%. It seems that the peak-to-valley difference is not large. However, when the load is running in the trough, a wind power generation process of up to five million kilowatts is superimposed, which is equivalent to a drop in power load of more than 9.5 million kilowatts. 35.38%, the peaking of the power grid will be more difficult. It is of great significance to master the ability to reduce thermal power in real time and coordinate other adjustment measures.
For the reduction of power, the grid regulation strategy usually starts from point F, first reduces the water and electricity, the tie line is adjusted according to the plan, and then reduces the thermal power. When there is no room for adjustment of the hydropower and the tie line, only the thermal power is adjusted. Only the margin of reduction is adjustedPm. For this reason, when the load drops to
exhaust the hydropower, the tie line, or even the frequency adjustment margin, the force marginPm
is reduced. It becomes the only discriminated indicator for grid regulation.
When the other adjustment capacity of the power grid is lost, the reduction force reaches the requirement of (14).
m
P
When the power grid's ability to reduce power is only ε, the grid loses its normal regulation capability and begins to invest in the energy storage device. Therefore, (14) can be used as a criterion for the input of the energy storage device. With the input of the energy storage device, becausePm>ε,(14) will be does not hold; but as the load further declines, or the demand for wind
power generation increases further, (14) will be established until all energy storage equipment is put into operation. If the grid has not yet restored its regulation capacity, it will abandon the wind and limit nuclear.
The formula (14) can be used as an energy storage device input criterion, and after the energy storage device is fully charged, as shown in the formula (15).
NC
C CE K CK
P P P
(15)The constraints are:
L / t 0
dP d (16)
W / t 0
dP d (17) Among them:PCIndicates the remaining capacity of energy storage,PCE Indicates the rated
capacity of energy storage,PCKIndicates the capacity of the Kth energy storage device,NCIndicates
the number of energy storage devices; Indicates that the load is still in the process of descent, Indicates that wind power is still in the process of increasing. If the load is reduced and the wind power increase process is reversed, the constraint can be changed to (18).
W / t L/ t 0
dP d dP d (18) Then (15) ~ (18) is the critical abandonment criterion.
Based on formula (14), using (15) ~ (18) to discriminate the critical state of grid abandonment is of great significance for the grid to dissipate clean energy.
Of course, in the actual operation of the power grid, the energy storage has been invested, then the energy storage exit condition is to first determine whether there is a wind, if any, after satisfying the formula (19).
m
P
(19) Among them: is a data larger than the capacity of the smallest energy storage device, usually 40MW. First restore the wind turbine that was stopped due to wind abandonment. After all the decommissioned wind turbines resume operation, they always exit the energy storage according to the formula (19).
Numerical Analysis
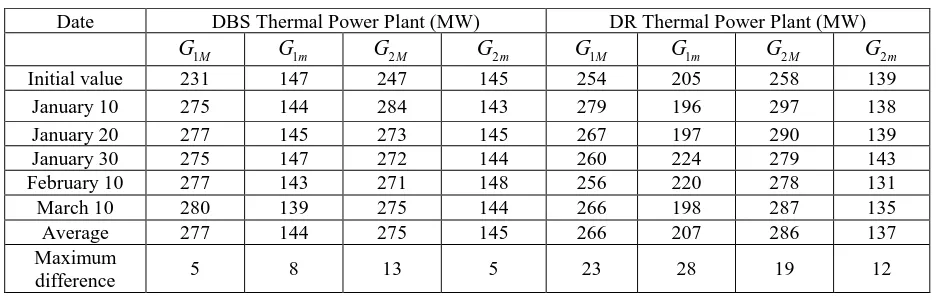
Taking the actual operation data of the power grid in the first half of 2018 as an example, the table 1 gives the given data and calculation data table of the maximum and minimum output of the DBS thermal power plant and the DR thermal power plant. The 3rd, 2nd and 3rd days of January are
selected. Data for each day of the month, of which G1M with G2M This article indicates the maximum
output of Units 1 and 2, G1mwith G2m This section indicates the minimum output of Units 1 and 2. It
that the dynamic upper and lower limit data of the unit output determined by data analysis can meet the actual operation requirements of the power grid.
Table 1. Maximum and minimum output data of DBS thermal power plant and Dr Thermal power plant.
Date DBS Thermal Power Plant (MW) DR Thermal Power Plant (MW)
1M
G G1m G2M G2m G1M G1m G2M G2m
Initial value 231 147 247 145 254 205 258 139
January 10 275 144 284 143 279 196 297 138
January 20 277 145 273 145 267 197 290 139
January 30 275 147 272 144 260 224 279 143
February 10 277 143 271 148 256 220 278 131
March 10 280 139 275 144 266 198 287 135
Average 277 144 275 145 266 207 286 137
Maximum
difference 5 8 13 5 23 28 19 12
[image:7.595.177.418.423.510.2]Table 2 gives the calculation data table of the maximum and minimum values of thermal power generation, and selects the data for each day of January, February and March in January. It can be seen from the table that the total power generation data is not much different, and the largest difference in the lowest difference is not large, but the data on March 10 is different from the data in January and February. This is because 1 and 2 months are the middle of heating, and March is the end of heating. The load is naturally smaller, and the peaking capacity of the unit is increased, which makes the peak-to-valley difference of thermal power generation increase, which is conducive to the peaking of the power grid. It can also be seen from the data in the table that the given initial value has little effect on the calculation results.
Table 2. Maximum and minimum data of total thermal power.
Date Maximum Minimum Difference
Initial value 14603 11484 3119
January 10 16748 10632 6116
January 20 17296 11013 6283
January 30 17692 11850 5842
February 10 16659 10476 6183
March 10 15612 8967 6645
21 22 23 24 1 2 3 4 5 6 7 2.6
2.83 x 10⁴
Load
21 22 23 24 1 2 3 4 5 6 7
1 1.2 1.4x 10
4
Thermal power
21 22 23 24 1 2 3 4 5 6 7
1500 2000 2500
Wind power
21 22 23 24 1 2 3 4 5 6 7
[image:8.595.131.464.78.239.2]0 200 400 Time E lect ri c/ MW Energy storage
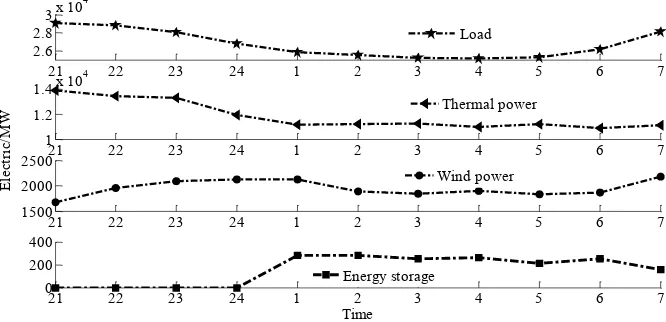
Figure 2. Curve of heat storage input, wind power, load and thermal power.
Figure 3 shows the energy storage input, the wind generation, the load curve, the thermal power curve, and the wind power generation curve. This is a case of wind power generation, energy storage, and wind abandonment. It can be seen from the figure that the wind power is large and the load is declining. When the thermal power reaches the minimum limit, the energy storage input conditions are met, the energy storage is successively put into operation, the energy storage is put into the upper limit, the power grid has no adjustment means, and the wind power is still There is demand for power generation, meet the conditions of abandoned wind, and start to abandon the wind. During the load increase phase, the wind power output also increases. When the load rises to a certain value, even if the wind power output is large, the thermal power has a power generation space to meet the wind power generation demand, the wind is restored, the load is further increased, and the energy storage operating conditions are not satisfied. After exiting the operation, it can be seen that the load and energy storage are the key to ensuring that the grid receives wind power. If the energy storage capacity is large enough, the large wind power generation process can be successfully generated. If the load is large enough, the wind will not occur. It can be seen from the curve that the two abandonment periods are all during the minimum load operation period throughout the day, and the energy storage is also fully operational, which also reflects the time-dependent nature of the abandonment.
23 3 7 11 15 19 23 3 7 11
0 500 1000
Load
23 3 7 11 15 19 23 3 7 11
0 500 1000
Thermal power
23 3 7 11 15 19 23 3 7 11
2000 4000 6000
Wind power
23 3 7 11 15 19 23 3 7 11
2.4 2.6 2.8x 10
4
Energy storage
23 3 7 11 15 19 23 3 7 11
0.8 1 1.2x 10
[image:8.595.131.465.500.657.2]4 Time E lect ri c/ MW Abandoned wind
Figure 3. Curve of heat storage input, wind generation, load, thermal power and wind power generation.
Conclusion
determine the optimal time for the grid to invest in energy storage and wind. According to the actual data of a provincial network, the dynamic calculation of the upper and lower limits of the thermal power unit is consistent with the actual operation of the power grid. The proposed energy storage input and abandonment conditions are also consistent with the actual operation of the power grid. Based on the data analysis, the method of dynamically determining the upper and lower limits of the thermal power unit operation requires a large number of actual operation tests. If it is feasible, it will have a profound impact on the actual operation of the power grid, at least with reference value.
Acknowledgement
Project Supported by National Key R&D Program of China (2017YFB0902100); National Natural Science Foundation of China (U1766204).
References
[1] Qi Chunhua, Ju Wenping, Huang Jiayu, Zhang Jianyuan. Overview and Prospect of Flexible Operation Technology of Thermal Power Units[J].Thermal Power Generation, 2018, 47(05): 1-7.
[2] Hou Yuting, Li Xiaobo, Liu Chang, XueJianzhong, Zhou Ming, Ji Jiangming, Yang Baiyi. The situation of flexible transformation of thermal power units and its application[J]. Thermal Power Generation, 2018, 47(05): 8-13.
[3] Yan Xuehui, Zhang Li, Yang Libin, Han Xueshan, Wang Mingqiang. The Deep Peaking Mechanism Based on Caldo Improvement under High-Scale Wind Power Integration[J].Automation of Electric Power Systems, 2018, 42(08): 110-118.
[4] Liu Gang. Study on the Technical Route of Thermal Power Unit Flexibility Transformation[J].Power System Engineering, 2018, 34(01):12-15.
[5] Dai Yuanhang, Chen Lei, Yu Yong, Xu Fei, Hou Kaiyuan, Zhou Ying. Optimized scheduling of combined operation of wind farm and cogeneration with heat storage[J].Proceedings of the CSEE, 2017, 37(12): 3470-3479 +3675.
[6] Lu Zongxiang, Li Haibo, QiaoYing. Evaluation and balance mechanism of power system flexibility for high-ratio renewable energy grid-connected [J].Proceedings of the CSEE, 2017, 37(01): 9-20.
[7] Qu Jixian, Liu Chun, Shi Wenhui, Zha Hao. A Fast Calculation Method of Abandoned Wind Rate Based on Wind Power Acceptance Space Electricity Regression Model[J].Grid technology, 2017, 41(01): 72-78.
[8] Ding Ming, Liu Xinyu, Xie Xiaolong, LinYujuan. Multi-regional heat-electricity joint scheduling model for improving wind power acceptance capability[J].Proceedings of the CSEE, 2017, 37(14):4079-4088+4287.
[9] Cui Yang, Chen Zhi, Yan Gangui, Tang Yaohua. Coordination Scheduling Model of Abandoned Wind Based on Combined Heat and Power Cogeneration Unit and Electric Boiler[J].Proceedings of the CSEE, 2016, 36(15): 4072-4081.
[10] Ma Xiaodi, Huang Mei. Study on the ability of power grid to accept wind power under peaking constraints[J].Power Supply Technology, 2015, 39(10): 2263-2266.
[12] Lü Quan, Li Ling, Zhu Quansheng, Wang Haixia, Liu Wei, Li Weidong. Comparison of Coal Saving Effect and National Economy of Three Kinds of Wind Absorption Schemes[J].Automation of Electric Power Systems, 2015, 39(07):75-83.
[13] Arndt Neuhaus, Frank-Detlef Drake, Gunnar Hoffmann, Friedrich Schulte. A Perspective on Energy Storage and Other Means to Integrate Increasing Shares of Renewable Electricity Generation[J]. Green, 2014, 4(1-6).
[14] Wesley J. Cole, Kody M. Powell, Thomas F. Edgar. Optimization and advanced control of thermal energy storage systems[J]. Reviews in Chemical Engineering, 2012, 28(2-3).
[15] Bri-Mathias Hodge, Carlo Brancucci Martinez-Anido, Qin Wang, Erol Chartan, Anthony Florita, Juha Kiviluoma. The combined value of wind and solar power forecasting improvements and electricity storage[J]. Applied Energy, 2018, 214