An Assessment Method for
Automotive Intrusion
Detection System
Performance
DISCLAIMER
This publication is distributed by the U.S. Department of Transportation, National Highway Traffic Safety Administration, in the interest of information exchange. The opinions, findings, and conclusions expressed in this publication are those of the authors and not necessarily those of the Department of Transportation or the National Highway Traffic Safety Administration. The United States Government assumes no liability for its contents or use thereof. If trade names, manufacturers’ names, or specific products are mentioned, it is because they are considered essential to the object of the publication and should not be construed as an endorsement. The United States Government does not endorse products or manufacturers.
Suggest APA Format Citation;
REPORT DOCUMENTATION PAGE OMB No.0704-0188 Form Approved
Public reporting burden for this collection of information is estimated to average 1 hour per response, including the time for reviewing instructions, searching existing data sources, gathering and maintaining the data needed, and completing and reviewing the collection of information. Send comments regarding this burden estimate or any other aspect of this collection of information, including suggestions for reducing this burden, to Washington Headquarters Services, Directorate for Information Operations and Reports, 1215 Jefferson Davis Highway, Suite 1204, Arlington, VA 22202-4302, and to the Office of Management and Budget, Paperwork Reduction Project (0704-0188), Washington, DC 20503.
1. AGENCY USE ONLY (Leave blank) 2. REPORT DATE
April 2019 3. REPORT TYPE AND DATES COVERED 4. TITLE AND SUBTITLE
An Assessment Method for Automotive Intrusion Detection System Performance 5. FUNDING NUMBERS
DTNH22-14-D-00329L/0001 Task Order 0001
6. AUTHORS
Stephen Stachowski, Ron Gaynier, David J. LeBlanc, all UMTRI
7. PERFORMING ORGANIZATION NAME AND ADDRESS
University of Michigan Transportation Research Institute 2901 Baxter Rd.
Ann Arbor, MI 48109
8. PERFORMING
ORGANIZATION REPORT NUMBER
9. SPONSORING/MONITORING AGENCY NAME(S) AND ADDRESS(ES)
National Highway Traffic Safety Administration 1200 New Jersey Avenue SE
Washington, DC 20590
10. SPONSORING/MONITORING AGENCY REPORT NUMBER
DOT HS 812 708
11. SUPPLEMENTARY NOTES
12a. DISTRIBUTION/AVAILABILITY STATEMENT
This document is available to the public through the National Technical Information Service, www.ntis.gov.
12b. DISTRIBUTION CODE
13. ABSTRACT
In response to the increased attack surfaces on modern vehicles due to expanded use of software and the introduction of wireless interfaces, a new market has emerged for intrusion detection systems (IDSs), which can detect some types of attacks and are under development by several companies. NHTSA requested development and demonstration of a method for assessing the in-vehicle performance of anomaly-based IDSs for vehicle data buses, specifically buses using controller area network protocols. IDSs may (1) protect vehicles from direct malicious manipulation of the data bus traffic, or (2) detect symptoms of unfriendly modification of firmware on one of the dozens of electronic control units (ECUs) on a modern vehicle’s network. The methodology used provides a means to assess the performance of automotive IDS products, to provide quantitative and qualitative analysis of performance, and to offer insights on potential IDS options.
14. SUBJECT TERMS 15. NUMBER OF PAGES
58
16. PRICE CODE
17. SECURITY CLASSIFICATION OF REPORT Unclassified 18. SECURITY CLASSIFICATION OF THIS PAGE
Unclassified
19. SECURITY CLASSIFICATION OF ABSTRACT
Unclassified
Table of Contents
Glossary ... iv
1. Executive Summary ... 1
2. Introduction ... 2
3. Anomaly Detection Systems ... 5
4. Test Concept ... 19
5. Test Method ... 23
7. Conclusions ... 47
Glossary
Acronym Definition Acronym Definition
ACC adaptive cruise control LDW lane departure warning
ADAS advanced driver assistance systems LKA lane Keeping assist
APIM OEM - ECU acronym LS-CAN low-speed CAN bus
AWD all-wheel drive MIL malfunction indicator lamp
BCM body control module MS-CAN medium-speed CAN bus
CAN controller area network NHTSA National Highway Traffic Safety Administration
CAPL Vector Infomatik’s - communication
access programming language OBD on-board diagnostic
CPU central processing unit OEM original equipment manufacturer
DAS data acquisition systems OTA over-the-air
DBC vehicle-specific CAN message database
file PAM park assist module
DLC data link connector PCM powertrain control module
DTC Diagnostic Trouble Code PCS precollision system
ECBS electronically controlled braking system PM prevention mitigation
ECU electronic control unit PRNDL Park, Reverse, Neutral, Driver, Lo EPAS electric power assist steering RAM random access memory
EHPAS electro-hydraulic power assist steering ROC receiver operating characteristics ESC electronic stability control (also known
as ESP, DSC) SAE Society of Automotive Engineers
FCW forward collision warning SQL Structured Query Language
FN false negative TC traction control
FP false positive TN true negative
FPR false positive rate TP true positive
GUI graphical user interface TPR true positive rate
HS-CAN high-speed CAN bus UDS unified diagnostic services HSM hardware security module UMTRI University of Michigan
Transportation Research Institute HVAC heating, ventilation, air conditioning USDOT United States Department of
Transportation
IDS intrusion detection system V2I vehicle-to-infrastructure
IoT Internet of things V2V vehicle-to-vehicle
1. Executive Summary
In response to the increased attack surfaces on modern vehicles due to expanded use of software and the introduction of wireless interfaces, a new market has emerged for intrusion detection products/systems, which can detect some types of attacks. IDSs are currently under development by several companies worldwide. The National Highway Traffic Safety Administration requested development and demonstration of a method for assessing the in-vehicle performance of anomaly-based IDSs for vehicle data buses, specifically buses using controller area network protocols. IDSs may become an effective tool in a multilayered cybersecurity strategy to: (1) protect vehicles from direct malicious manipulation of the data bus traffic, or (2) detection of symptoms of other compromises, such as an unfriendly modification of firmware on one of the dozens of electronic control units on a modern vehicle’s network.
NHTSA’s core project intentions are focused on creating a methodology for the assessment of the following available IDS solutions.
• Select available IDS suppliers that could meet specified criteria and integrate their solutions into three unique test vehicle platforms.
• Devise a test methodology (described in this document) and then execute formal vehicle-based IDS performance assessment tests founded on this methodology.
• Execute an IDS performance assessment that includes simulated attacks to vehicle network bus traffic (i.e., injected CAN bus anomalies). The test platform includes customized data logging to capture IDS performance for post-test analysis.
• Conduct a post-test analysis to create a set of performance metrics to quantify or tier competitive supplier results.
2. Introduction
2.1 Project goals
With the cooperation of participating OEMs, IDS performance was assessed using real-world vehicles to further develop and fine-tune the assessment approach. In line with NHTSA’s mission to use diverse research partners with market ready or near market ready products for the advancement of transportation safety, the research team subcontracted a third-party software developer to design purposeful and unique simulated data bus attacks developed for specific modern vehicle applications. The intent of this project is not to assess the level of cyber-robustness of a particular vehicle architecture as much as to identify way to assess the quality and effectiveness of IDS automotive solutions currently in the market place. Key steps of this project are:
1. Develop a methodology which illustrates an IDS performance assessment test process/procedure.
2. Utilize interested OEM stakeholder vehicles as rolling test beds for IDS performance assessments.
3. Develop simulated attacks (scripts that represent bus anomalies) to be injected directly onto the vehicle’s CAN bus or buses via an on-board diagnostic (OBD-II) data link connector [3].1 Although different types of attack vectors are realized, this project
focuses on direct injection to achieve intermediate results of the IDS products. The intent is not to assess all threat vector types during this project.
4. Develop a method to put competing IDSs into tiers based on selected quantitative and qualitative metrics. Explicit and intentional IDS competitive ranking is not examined as part of this project.
5. Develop a method to classify competing IDS models.
6. Develop recommendations for future IDS performance assessment improvements/procedures.
2.2
Prior work
A variety of researchers have previously demonstrated cybersecurity attacks to current vehicles. These include demonstrated attacks via the OBD-II port that require local physical access [4-7] as well as remote wireless exploits [8, 9]. The attacks impact systems ranging from theft protection and comfort features to the cyber-physical, which could be safety related by design [4-9].
The existing published attacks can be classified in two stages.
1. Stage 1: Compromising the periphery. In the first stage, attackers compromise vehicle (ECUs such as the infotainment or telematics units. The attackers discover weaknesses in the implementation or in the design, such as software buffer overflows, poor random-number generators, implementation flaws in the MP32 codec or Bluetooth driver, or
1 SAE J1962, Diagnostic Connector, defines the requirements of an OBD diagnostic connector used on vehicles
(traditionally for light vehicles) as required by U.S. Board Diagnostic (OBD) regulations; see for example On-Board Diagnostic Regulations and Requirements: Questions and Answers, Environmental Protection Agency, Report No. EPA420-F-042, December 2003, at
https://nepis.epa.gov/Exe/ZyPDF.cgi/P100LW9G.PDF?Dockey=P100LW9G.PDF
improper data encryption. The objective of the attackers is to gain access to the vehicle’s CAN bus through existing network nodes (ECUs).
2. Stage 2: Injecting CAN messages. In the second stage, attackers inject CAN messages onto the CAN bus. These maliciously crafted CAN messages can modify the behavior of the vehicle. For instance, it is possible to falsify the instrument cluster displays (e.g., speed or gas gauge), modify heating, ventilation, and air conditioning settings, radio controls, accelerate or decelerate the vehicle, or deactivate brakes. In many cases, attackers simply send more forged CAN messages than a legitimate ECU, making other CAN receivers believe that the forged information is legitimate. While such attacks are easy to detect and more advanced attacks are conceivable, they are typically not necessary since current vehicles do not implement any intrusion detection mechanisms. If an attacker has physical access to the OBD-II port, attack stage 1 is null (not necessary) and only stage 2 is executed. It is assumed that an attacker successfully executed stage 1 and already gained access to the vehicle CAN buses. Therefore, our test scope focuses on stage 2, achieved by simulating attacks through the injection of messages onto the CAN bus by directly connecting to the data bus. This still simulates the intermediate effects of many remote (wireless) attacks that use counterfeit messages in their overall attack strategy.
2.3 Scope of project
The scope of this project is research and development of a methodology to assess modern vehicle CAN-based anomaly detection systems. The overall structure of this project creates a framework demonstrating a process to assess IDS products for the automotive market place. Four main project phases were created to support scheduled deliverables which monitor and meet this framework. They include the following.
1. Market Analysis: A market survey and selection process to narrow down potential IDS suppliers
2. Test Environment, Development, and Validation Test: Vehicle instrumentation, IDS integration, and system demonstration to prepare the vehicle for assessment
3. Test Plan: Test plan development, including test methodology and test procedure development (iterative)
4. Testing and Analysis: Assessment of test results and report
This study did not assess the complexities of any IDS learning and vehicle installation specifications. All IDS solutions appear to employ some form of machine learning,3 policy-based,4
or signature-based5 detection solutions; however, actual solution details are proprietary meaning
the details are known only to each system supplier. Installation of a system for test in a vehicle, whether a stand-alone module, part of a gateway, or embedded within an existing module was done by each specific vehicle manufacturer. Special project conditions include local” detection of CAN bus intrusions, and this is the core feature tested in this assessment (i.e., to ensure no postprocessing of CAN data occurs in supplier logs). The ability to counter intrusions with
3 See Section 3.3.2.1
4 See Section 3.3.2.2
preventative mechanisms, and/or the ability to use a remote server to learn from attacks and update local policies, is beneficial and discussed.
Subsequently, a secondary objective of this assessment is to provide recommendations for integrating an IDS solution into next-generation vehicle architectures in terms of topology, connectivity, detection strategy (e.g., CAN anomaly detection versus host-based anomaly detection), and resources.
2.4 Participating IDS suppliers and OEMs (test vehicles)
NHTSA helped choose a limited but sufficient number of suppliers and vehicle architectures to conduct this project. The research team chose a sample of three well-qualified IDS suppliers for assessment and competitive observation (herein described as Supplier - A, B, C, respectively and in no specific order).
In terms of vehicles (i.e., CAN bus architectures used as rolling test beds), availability and the willingness of OEMs to participate were the determining factors in the number of vehicle architectures included in the study. The sample size eventually chosen was three (herein described as Vehicle - 1, 2, 3, respectively and in no specific order). The goal is not to attempt to assess as many vehicle architectures as possible in hopes of assessing a significant CAN bus population; it is rather to develop a framework/process for the assessment of vehicle-based IDS integrations.
2.5 Overview of document
This study for the automotive market established distinct project phases to effectively integrate, exercise, and assess performance of in-vehicle IDS solutions. Project deliverables are defined in the following sections:
• 1: Executive Summary: Preamble on NHTSA-sponsored cyber-automotive project
• 2: Introduction: Includes project goals, scope, and participating project partners
• 3: Anomaly Detection Systems: Includes vehicle data bus overview, IDS and CAN bus assumptions, types of IDSs, and metrics defined for IDS performance calculations.
• 4: Test Concept: Defines overview of product testing and supplier selection
• 5: Test Method: Illustrates the research and test methodology for assessing modern vehicle IDS solutions.
• 6: Data Analysis and Findings: Provides overview of each IDS supplier metrics findings and performance summaries.
• 7: Conclusion: Offers highlights of test data analysis and insight on what was learned
• 8: Appendices: Support material used in this research and report
• 9: References: Support literature on related topics
3. Anomaly Detection Systems
Many modern vehicle safety and non-safety system features are directly reliant upon intra-bus and multiple bus stability and reliability. Communication bus nuances can be an indication of several potential reliability issues with either network infrastructure, network ECU hardware and/or software, sensors, electrical interference, etc. Given the increased use of electrified systems on today’s vehicles and the accessibility to these systems, a new area of potential exploitation must also be taken into consideration: The possibility for an adversary wishing to cause disruption or harm to a vehicle bus and/or its components. The ability to detect anomalous behavior on a modern vehicle data bus is one area of research that the auto industry is working aggressively to develop. These development efforts have led to the creation of vehicle intrusion detection products commonly known anomaly-based IDSs. IDSs typically reside on the vehicle data buses they are monitoring and are designed to detect anomalous bus messages (that deviate from predefined “normal” bus traffic).
Much of this attention and effort is currently in progress by modern vehicle OEMs, suppliers, academia, government, and other stakeholders. This research takes an initial step toward developing a method of assessing the performance of anomaly-based detection systems developed for modern vehicles.
3.1
Vehicle data bus - background
For this project, IDS performance assessments are to be conducted on modern vehicle data buses, specifically CAN buses, which are two-wire buses whose messages are discrete packets with headers (message identifiers) that identify the message and payload that are in small 8-byte units. CAN bus traffic is decentralized, with individual ECUs transmitting (broadcasting) messages based on their own clocks. Automotive CAN messages are predefined and transmitted one of two ways: based on events or at periodic rates. Messages with the lowest identifier (ID) number receive the highest bus priority and access (via bit-wise arbitration) for transmission. Messages are broadcast and are visible by all other ECUs on the bus. Each ECU receives messages that are useful for its function (based on message ID) and ignores the rest of the messages. There is no authentication protocol6 built into CAN, but a receiving module does acknowledge when a
message is received by the transmitting module. CAN buses are quite robust, where OEM network engineers exhaustively design architectures to effectively manage CAN bus traffic, avoiding bandwidth issues or instability (with possible failure/delay to communicate). Message transmission rates are typically 1 to 100 Hz, depending on bus type and application. It is very common for today’s vehicles to contain multiple CAN buses based on vehicle complexity and feature content. Refer to Figure 1 for a representation of a standard CAN message format with an 11-bit identifier (ID).
Figure 1: Standard CAN Frame With 11-Bit ID
[10]This project investigates and assess integrated IDSs applied to modern vehicle CAN bus networks only. Current production vehicles were used as assessment platforms to implement and assess these systems. The current state-of-the-art vehicle CAN buses used during this project do not incorporate any formal message authentication, security measures, or flexible data rate frame format and are comprised mostly of high-speed, medium-, and low-speed CAN bus topologies (based on the ISO 11898 standard) [11]. The anomaly detection systems tested for this project were specifically developed around specifications for simulated attacks to be injected onto high-speed (500kB) CAN bus applications.
Figure 2: Simplified Modern Vehicle CAN Bus Architecture
With Central Gateway
BCM/PCM (gateway optional)
Central Gateway ECU OBD2
C
AN
1
C
AN
2
Infotainment / Telematics ECU
ECUs
CAN 3
ECUs
CAN 4
ECUs ECUs
LIN
CAN 1 = Hi Speed CAN 2 = Hi Speed CAN 3 = Med. Speed CAN 4 = Low Speed
3.2
IDS/CAN bus assumptions:
IDS/CAN bus assumptions and directives regarding IDS product integration and CAN bus architectures were made.
• This project targets CAN bus protocols based on the ISO 11898 standard (i.e., it does not assess vehicle architectures using Secure CAN, CAN FD, FlexRay, or Ethernet).
• IDS products were required to detect and log vehicle data bus anomalies (with respect to “normal” bus traffic).
• Implied IDS detection philosophy: A significant goal for IDS suppliers is to achieve maximum sensitivity to anomaly detection (true positives) without compromising its ability to filter and correctly identify false alarms (false positives).
• IDS functional characteristics: Monitor-only mode then report (alert) user when an anomalous message is detected. The alert is recorded on a supplier log file (visual alert is optional via hardware or laptop).
• The CAN bus monitor/log equipment will output a periodic sync CAN message (0x7FA) on the main high-speed CAN bus only as a global timestamp used for post analytics. This sync message does not exist in any OEM CAN databases and does not impact vehicle functionality.
• IDS suppliers will provide an alert message (0x040) on the main high-speed CAN bus when an anomaly is detected for post analytics. This message does not exist in any OEM CAN database, and it does not impact vehicle functionality.
• Vehicle CAN bus architecture types are not completely relevant to the assessment of IDS products; they offer a rolling test bed for IDS integration and a predefined message database from which to create scripted attacks.
• Simulated attacks are not intended to test vulnerability of the specific vehicle bus networks but are rather intended to exercise the IDS.
• IDSs are designed to interface to vehicle CAN bus networks only.
• IDS designs allow the flexibility to monitor any readily accessible CAN buses as needed for operation (at the discretion of the supplier).
• IDSs are designed to operate as a stand-alone independent node, physically connected to vehicle CAN buses via OBD-II connector.
• IDS are not hosted on any other vehicle ECU.
• Vehicle OBD-II connector limits IDS suppliers to CAN bus access types.
• IDS supplier data output is designed to represent a classic binary classification system. o When anomaly occurs - alert either as true positive - else false negative.
o When no anomaly occurs - alert either as true negative - else false positive.
• IDS suppliers will provide assessment log files that will include index, local timestamp, CAN bus channel, anomaly CAN ID, anomaly data length, anomaly payload, anomaly type (optional), and count (optional).
• IDS physical integration locations are in-cab environments with easy access to driver for periodic operational checks.
• IDS project specification: Supplier systems are not to prevent or mitigate a detected anomalous message (some suppliers do offer this feature).
• IDS are tested independently (i.e., not batch-tested in parallel).
• IDS operation required only for two vehicle states: (1) engine off/accessory on or (2) engine on/accessory run state.
• IDS to be powered with vehicle 12V power source.
3.2.1 Terminology
In this report, an “anomaly” is any deviation in traffic on the vehicle data bus that is not consistent with an OEM design. An anomaly is activity on the data bus that is caused by a true malfunction or an intrusion by a third party that has caused illegitimate data bus messages or message behaviors. In this report, we are considering the message traffic itself, not subtle bus voltage variations that may be due to electrical failures, electromagnetic interference (noise), or mechanical bus failures induced by malicious parties. In addition, we are not assessing systems able to detect anomalous behavior on very subtle “fingerprints” of electrical characteristics (patterns) that can be associated with an individual transmitter of messages.
Another term used throughout this document is “simulated attack,” which is the injection of data bus messages by the testing agency onto the data bus to simulate an intrusion. These simulated attacks are described in following sections; their purpose in the context of anomaly detection testing is to present the IDS with an “event” to assess the IDS’s response.
The ability to assess the capability of IDS anomaly detection is best described using a binary classification system, which essentially outputs a pass/fail score into two groups (an actual anomalous event occurs, or it doesn’t).
1) An anomalous event occurs and the IDS correctly determines that an anomaly has occurred (TP) or incorrectly indicates an anomaly has not occurred (FN).
2) No anomalous event occurs and the IDS correctly determines that an anomaly has not occurred (TN), or incorrectly indicates an anomaly has occurred (FP) results.
These binary descriptors will be utilized throughout this document to quantify the success or failure of IDS performance in various formats.
3.3
Types of IDS
In general, for a computer network that consists of two or more nodes, messages are generated at each node and flow between the nodes. The resulting network (bus) traffic forms a unique pattern of messages as a function of network operations. With respect to the automotive environment, especially modern vehicles, this bus traffic exists on data buses such as CAN buses between nodes (i.e., ECUs) as previously defined in section 3.1. OEMs construct bus traffic for a given set of use cases and operating conditions, regardless of vehicle operating state (whether static and dynamic), This is because of vehicle systems interactions, network design, vehicle make, model, and trim level content. “Bus traffic” is loosely termed and generally defines message content broadcast on the network between transmitters/receivers (ECUs). Bus traffic varies, both amount and type, at any given point in time based on vehicle operation. A vehicle and its associated network architecture is engineered to meet specific design specifications and operating conditions under which all bus traffic is deemed “normal” as developed by the OEM. Any unexpected or unknown CAN bus messages/data not expected or predefined by the OEM can be identified as an anomaly, which is why IDSs that focus on anomaly-based detections is examined during this project. Some types of anomaly-based IDSs are described in the following sections.
3.3.1 Detection versus mitigation:
3.3.2 Detection design strategies:
IDS design strategies are proprietary, thus confidential, and vary among suppliers. These strategies, protected by corporate intellectual property, were not explicitly shared with the research team. However, it is assumed that the IDS products assessed on this project do incorporate one or more of the following design methodology and/or implementation strategies.
3.3.2.1 Machine learning
This approach is based on collecting statistically significant normal bus traffic (data) and building/categorizing models of what normal traffic represents. These models (profiles) are then compared with new bus traffic, and any deviation yields the possibility of anomalous behavior. In a sense, this constitutes pattern recognition and analysis that is categorized and used for future intrusion-detection assessment. One benefit to this approach is that it does not require prior knowledge of attacks and therefore can detect new attacks. A disadvantage to this approach is that the accuracy depends on the type and amount of normal bus traffic used to categorize the model. The baseline models established as normal require significant effort in data collection and interpretation techniques.
3.3.2.2 Anomaly-based (policy-based)
This approach is based on the ability to observe events or traffic on a bus and to apply a set of rules or boundaries that lead to a decision regarding whether a given pattern of activity (messages) is suspicious (anomalous). It is typical for a large database of rules to be generated via a training process that allows this type to be implemented. The paradigm is “anything that is abnormal is most likely suspicious.” This requires that a rules-based solution (model) be developed with training data based on normal traffic. The ability to define or estimate normal traffic can be labor intensive and timely for algorithm development (i.e., while creating a reference or baseline). One disadvantage of this approach is the tradeoff in the model design between not being able to identify when an attack has occurred (yielding a false negative) and falsely identifying an attack when one has not occurred (yielding a false positive). One benefit of this strategy is that it lends itself well to detecting new attacks without any prior knowledge.
3.3.2.3 Signature-based
This approach compares traffic or application data patterns of well-known attacks or weaknesses to current network traffic. If matched, then this accurately and efficiently detects an attack instance. This form of detection relies on prior information about types of attacks and doesn’t readily detect new attacks if not previously identified. However, this type is of solution does provide a level of robustness to false positive events.
3.3.3 Implementation approach:
IDS implementation types are varied among suppliers and are based on design philosophies that can achieve optimal results. All IDS products assessed for this project were designed to be integrated into test vehicles as independent, non-cloud-based ECUs (simply as additional CAN bus nodes). The following list contains varied approaches to IDS implementation on light vehicles.
3.3.3.1 IDS node - non-gateway-based
would be done in a ECU designed for a gateway application. In addition, there is no intentional data message translation or filtering between bus segments via the IDS module (as would be done by a gateway module).
3.3.3.2 IDS node - gateway-based
In many network architectures, especially those with multiple bus segments (subnetworks), gateways are used to isolate segments from one another. This provides an additional layer of security in the sense that bus messages cannot be transmitted from one segment to another without passing through a gateway which typically provides a whitelist/blacklist for message filtering. This feature is even more important with respect to isolating the vehicle from external threat vectors such as a wired OBD-II port or wireless communication channels (cellular, Wi-Fi, Bluetooth, etc.). In addition, gateways are now incorporating the ability to host any IDS software to not only filter but actively detect and identify anomalous bus behavior. The added benefit is that a gateway with IDS features offers the ability to monitor and protect all bus networks that the host is connected to. As previously indicated, this IDS implementation type was not utilized during this project.
3.3.3.3 IDS node – stand-alone (local) versus cloud-based
IDS product designs can take different physical forms and implementation types. In recent project assessments of real-time IDS products for the modern vehicle market, the research team has observed that these systems typically reside locally on the vehicle and are implemented as stand-alone modules, virtual machines, or can be hosted on existing vehicle ECUs (e.g., on a gateway). The benefits of local integration are decreased detection and response times to intrusions. Other IDS products associated with cloud-based solutions require a bus interface via some ECU, which then opens the potential benefits of big data analytics and software updates when a potential threat is detected. If cloud-based solutions are used to detect intrusions, the likelihood exists of increased detection and response times due to latencies communicating with cloud-based algorithms. One potential benefit to cloud-based IDS is the ability to implement firmware locally (i.e., via an IDS ECU or host on an existing vehicle ECU) and offer the ability to update/improve its detection algorithm (remotely) based on fleet vehicle data threat analytics. This strategy offers the benefits of localized anomaly detection yet provides a connected means to upgrade IDS firmware on the vehicle with the latest detection algorithms available from the OEM/supplier.
This project assessed products performing real-time intrusion detection locally on stand-alone hardware. Similarly, these products were integrated into vehicles independently as add-on nodes on predefined bus segments and not hosted on any existing vehicle ECUs. Their designs did not include any cloud-based support features.
IDS implementation in modern vehicles continues to be an ongoing field of research. With it comes many discussions surrounding the benefits and limitations of this growing industry. The following topics relative to IDS integration on automobiles continue to be up for discussion in the automotive cyber community.
3.3.4 Implementation risk-benefit ratio
The benefits of anomalous (monitoring) type systems are:
• Ease of integration (IDS can simply be another stand-alone CAN bus node).
• Detection strategies may consist of a combination of heuristic analysis, machine learning, deep-packet inspection, and/or whitelist/blacklists.
• May include “active mitigation” strategies.
• Packaged/implemented in various formats: host-based IDS solution in a gateway, existing ECU, or stand-alone module.
• Can leverage cloud-based forensics (if designed) The limitations of anomalous (monitoring) type systems:
• Require extensive learning phase for modelling/profiling “normal” and “non-normal” vehicle CAN bus profiles. The possibility of rare events could produce false positives and require updating/relearning if ECU updates affect CAN bus messages.
• Learning phase will be different for every vehicle model type (dependent on vehicle systems’ features).
• Rare events may only be contained via whitelist/blacklist as done in a filter-based solution.
• Proprietary IDS algorithms are defined by suppliers (quality/sensitivity of detection is supplier dependent).
• IDS algorithms themselves offer another mechanism by which software could be hacked and provide another portal to the vehicle data bus network.
3.4
Types of anomalies
As described previously in section 3.2.1, the term “simulated attack” is often used in the context of cybersecurity to define specific software (scripts) developed to output anomalous messages on the CAN bus. One of the research team’s roles was to develop a list of simulated attack types to help ensure IDSs are comprehensively assessed for each vehicle used on this project. Software developer Silent Cyber was subcontracted to independently create attack scripts for each test vehicle. Regarding attack script development, the following observations are important to consider:
• First, developing attacks for each vehicle may appear more as penetration testing of the vehicles and does not necessarily provide an adequate set of tests for the assessment of an anomaly-based intrusion detection system.
• Second, successful attacks are often very novel in their design, and if security experts could anticipate and create examples of all possible attacks, then they could certainly design safeguards against each.
Therefore, an investigation of categories of simulated attacks on the CAN bus that would manifest themselves as different from normal bus traffic (and hence considered anomalies) was undertaken and empirical tests that exercise IDS abilities to identify these CAN bus anomalies was designed. Conversely, the team also designed empirical vehicle test scenarios where the driver activated certain vehicle features (both usual and unusual) to determine if the IDS will incorrectly identify normal CAN bus messages as anomalous messages (i.e., false alerts).
The following is a summary of test anomaly types developed for this project:
3.4.1 Test IDS ability to recognize messages that deviate from the normal cyclic message rate.
3.4.2 Test IDS ability to track messages that contain counters
Inject anomaly messages that contain bogus message counters. The count value in the anomaly messages is correct in sequence as determined by the count value of the last normal message transmitted on the bus. This results in the next normal message following the attack to appear out of sequence.
3.4.3 Test IDS ability to rationalize message content from system wide status
Inject anomalous messages that contradict current vehicle status (command on the malfunction indicator lamp when no diagnostic trouble codes are set, send diagnostic requests when inappropriate to vehicle operating condition, request more torque when brakes are applied, etc.).
3.4.4 Test IDS ability to detect violations of BUS OFF timer
Use the Vector Informatics’ CANStress tool to cause a controller into enter a BUS OFF state by corrupting the controller’s messages and sending “evil twin” anomalous messages during the BUS OFF timeout period (~1 sec). This type of attack was proposed but not successfully implemented on this project.
3.4.5 Test IDS ability to distinguish anomalous messages from similar messages (invoked by normal driver/vehicle behavior) - false positive tests
Conduct normal driver use-case scenarios to elicit false positive alerts. The intent is to have the driver exercise the vehicle under typical vehicle operating conditions to invoke CAN bus messages which correspond to similarly injected anomalies. For example, if an injected anomaly (attack) consists of changing transmission status to Reverse (while the vehicle is in Park), the corresponding false positive use-case would be that the driver physically shifts the vehicle from Park to Reverse. The intent is to test if the IDS can distinguish between valid and invalid bus content within a given vehicle state/context.
3.4.6 Test IDS ability to distinguish anomalous messages from unusual but normal bus behavior (invoked by non-normal driver/vehicle behavior) – false positive tests
Conduct non-normal driver use-case scenarios to elicit false positive alerts. Driver exercises vehicle under “unusual” operating conditions or at “unusual” times to determine if the IDS generates false positives. For example, on a vehicle with push-button PRNDL, where a driver can press all buttons at once, or pressing “R” while at highway speeds in Drive. The intent is to test if the IDS can distinguish between valid and invalid bus content within a given vehicle state/context.
3.5
IDS performance measures
One of the primary goals of this project is to demonstrate a methodology to assess modern vehicle integrated IDS solution performance. To do so requires establishing a framework with the ability to classify, test, and tier IDS solutions for detection accuracy. The binary classification system lends itself well to achieving this goal. A secondary goal of this project is to assess IDS solutions based on qualitative and subjective attributes that will augment objective results.
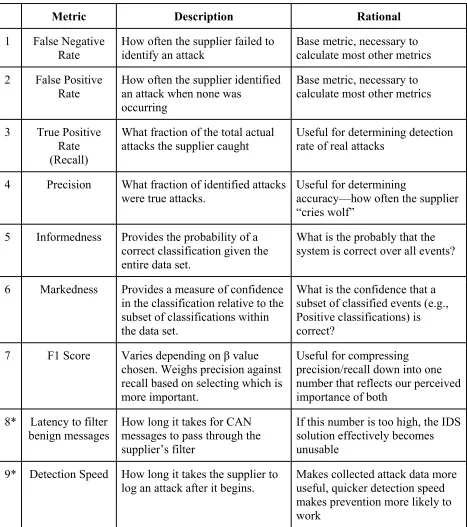
Table 1: Metrics Summary
Metric Description Rational
1 False Negative
Rate How often the supplier failed to identify an attack Base metric, necessary to calculate most other metrics 2 False Positive
Rate How often the supplier identified an attack when none was occurring
Base metric, necessary to calculate most other metrics
3 True Positive Rate (Recall)
What fraction of the total actual
attacks the supplier caught Useful for determining detection rate of real attacks
4 Precision What fraction of identified attacks
were true attacks. Useful for determining accuracy—how often the supplier “cries wolf”
5 Informedness Provides the probability of a correct classification given the entire data set.
What is the probably that the system is correct over all events?
6 Markedness Provides a measure of confidence in the classification relative to the subset of classifications within the data set.
What is the confidence that a subset of classified events (e.g., Positive classifications) is correct?
7 F1 Score Varies depending on β value
chosen. Weighs precision against recall based on selecting which is more important.
Useful for compressing precision/recall down into one number that reflects our perceived importance of both
8* Latency to filter
benign messages How long it takes for CAN messages to pass through the supplier’s filter
If this number is too high, the IDS solution effectively becomes unusable
9* Detection Speed How long it takes the supplier to
log an attack after it begins. Makes collected attack data more useful, quicker detection speed makes prevention more likely to work
It is reasonable to assume that each modern vehicle OEM is likely to have unique IDS goal preferences and selective weighting between these performance measures.
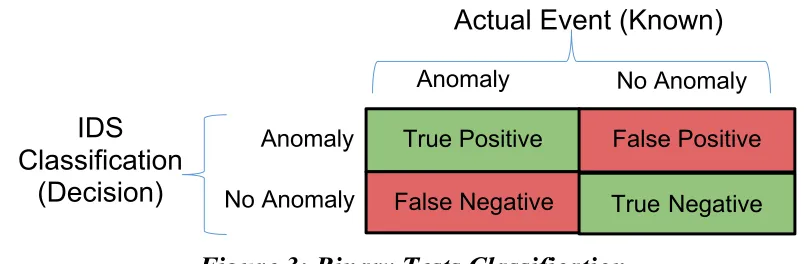
3.5.1 Binary classification of anomaly detection
[image:21.612.100.504.204.336.2]An IDS is essentially a classic binary classification system as introduced in section 3.2.1. When given an input, the IDS will output one of two classifications: (1) an anomaly is detected or (2) no anomaly is detected. A positive event is when an attack (or simulated attack) is occurring. A negative event is all other moments, including times with unusual but benign bus traffic.
Figure 3:
Binary Tests Classification
True Positive
False Negative
False Positive
True Negative
Anomaly No Anomaly
Actual Event (Known)
IDS
Classification
(Decision)
Anomaly
No Anomaly
In Figure 3, the green squares are binary classifiers where the IDSs have made correct decisions - correctly identifying an attack is occurring (TP) or that an attack is not occurring (TN).
Conversely, the red squares are binary classifiers where the IDS have made erroneous decisions— that an attack is detected when none is occurring (Type I error: FP) or an attack is not being detected but is occurring (Type II error: FN).
Unlike false positives, false negatives can only occur when an anomaly occurs and the IDS fails to detect the event. If testing exposes different systems to the same number and type of anomalies, then a count of false negatives is a useful measure of performance.
As with any binary classification system, a ranking of performance between IDSs exposed to the same set of true events and false events requires the assessor to express the relative weight of detection rate (percent of events that are detected) versus the false positive rate (how many false positives). This weighting was intentionally not provided in this project and would typically be chosen by an OEM whose higher-level plans for using the information becomes important. For instance, if one OEM wishes to flag all true events and can tolerate false alerts, then suppliers would seek to meet those criteria. If another OEM needed to avoid false positives at all costs, the suppliers would tune their system differently.
3.6
Quantitative metrics
3.6.1 Precision and recall
Precision and recall are often used in machine learning and binary classification problems like this project entails. Their formulas are as follows.
𝑃𝑃𝑃𝑃𝑃𝑃𝑃𝑃𝑃𝑃𝑃𝑃𝑃𝑃𝑃𝑃𝑃𝑃 = 𝑇𝑇𝑃𝑃𝑇𝑇𝑃𝑃+𝐹𝐹𝑃𝑃
𝑅𝑅𝑃𝑃𝑃𝑃𝑅𝑅𝑅𝑅𝑅𝑅= 𝑇𝑇𝑃𝑃𝑇𝑇𝑃𝑃+𝐹𝐹𝐹𝐹
Precision is a measure of a classifier’s ability to identify actual attacks from the total number of events that are examined. Identifying normal traffic as an attack (FP) will very quickly drive this number down. Note that this number does not consider missed attacks. A system that correctly detects a single attack and misses all others (large FN), while never falsely identifying normal traffic as an attack (where FP=0), will achieve very high precision but is not very useful.
To offset this shortcoming in precision, recall is used to measure how well the IDS caught all possible actual attacks. Any missed attack will quickly drive this number down. However, this metric does not account for labeling benign traffic as an attack (FP)—a system that always labels all traffic as an attack will achieve very high recall, but is also not very useful (and will have very low precision).
Precision penalizes false alarms whereas recall penalizes failing to correctly raise the alarm.
3.6.2 F-score
F-score is a combination of precision and recall; it compresses the pair of numbers down into one usable number and is a measure of a test’s accuracy. The general equation for F-score is
𝐹𝐹𝛽𝛽 = (1 +𝛽𝛽2)(𝛽𝛽2𝑃𝑃𝑃𝑃𝑃𝑃𝑃𝑃𝑃𝑃𝑃𝑃𝑃𝑃𝑃𝑃𝑃𝑃 ⋅ 𝑅𝑅𝑃𝑃𝑃𝑃𝑅𝑅𝑅𝑅𝑅𝑅⋅ 𝑃𝑃𝑃𝑃𝑃𝑃𝑃𝑃𝑃𝑃𝑃𝑃𝑃𝑃𝑃𝑃𝑃𝑃) +𝑅𝑅𝑃𝑃𝑃𝑃𝑅𝑅𝑅𝑅𝑅𝑅
Where β is a tuning variable that weighs whether precision or recall is more important. For our
calculations, we used a pair of β values.First, we set β = 1. This weighs precision and recall evenly.
For our second metric, we set β = 0.5, which biases our F-score toward precision based on the
assumption that all suppliers would do relatively well at detecting attacks but might differ in their ability to have low FP. Specifically, this makes precision twice as important as recall.
This measure has the advantage of being quick and easy to read. If the relative importance of precision and recall is determined ahead of time for each IDS tested, determining the best performer is just a matter of calculating the F-score and comparing the results.
Unfortunately, F-scores do not consider true negatives and, therefore, are not used as the sole metric for comparison.
3.6.3 Informedness and markedness
The last metrics assessed are informedness and markedness. Their formulas are as follows. 𝐼𝐼𝑃𝑃𝐼𝐼𝑃𝑃𝑃𝑃𝐼𝐼𝑃𝑃𝐼𝐼𝑃𝑃𝑃𝑃𝑃𝑃𝑃𝑃= 𝑇𝑇𝑃𝑃𝑇𝑇𝑃𝑃+𝐹𝐹𝐹𝐹+𝑇𝑇𝐹𝐹𝑇𝑇𝐹𝐹+𝐹𝐹𝑃𝑃 −1
Informedness describes the correlation between the IDS’s ability to predict the presence or absence of an attack and the total number of events. It is the ratio of properly classified attacks to the total number of actual attacks (referred to as sensitivity), plus the ratio of events properly classified as void of attacks to the total number of events void of attacks (referred to as specificity). Informedness values range from -1 to 1. A perfect system would have an informedness score of 1.
Markedness differs from informedness in that it calculates the ratio of properly classified attacks to the total number of events classified as attacks (positive predictive value) plus the ratio of events properly classified as void of attacks to the total number of events classified as void of attacks (negative predictive value). As with informedness, the values range from -1 to 1, and a perfect system would have a markedness score of 1.
These measures compensate for the bias inherent in both precision/recall and F-scale metrics. They should be robust to sample size differences but are more difficult to comprehend than the other metrics.
3.6.4 Response time
The IDS response time (detection speed) was not used during this project, but it can be a vital factor in higher resolution performance analysis of future generation IDS products as the technology evolves. Some key considerations about the impact of response time when considered relative to IDS performance:
• Latency to filter benign messages: This refers to the time delay of filtering valid messages that may be incorrectly categorized as anomalies. This may apply more directly to IDS applications that function with filtering capabilities (as seen on gateway ECUs). It is only reasonable that this characteristic is minimized for optimal bus performance.
• Detection speed: This metric identifies the time to read, validate, and send an alert (log, visual, etc.) that a message is categorized as an anomaly. It seems reasonable that normal messages are validated in a shorter amount of processing time than true anomalous messages. Minimum detection speed is desirable.
• Latency due to plausibility checks: To insure an IDS algorithm decision-making process is accurate requires validation and verification yielding plausibility checks for CAN messages. Doing so requires additional ECU processor clock cycles providing a measure of confidence in detection decisions. These “additional” cycles for decision filtering will most likely increase decision latency. The goal is to maximize IDS detection quality by minimizing improper message classification.
3.7 Qualitative metrics
In addition to quantitative metrics previously described, a set of qualitative metrics considered for IDS supplier assessment and selection was applied. These metrics are
1. Flexibility of solution: How flexible is the IDS solution to account for a vehicle production line which includes many trim options for a given vehicle model? For instance, how flexible is it to account for many different electronics platforms, each of which offers thousands of slight variations (e.g., different equipment features and different software versions per ECU)? How well will the solution handle software updates of ECUs, replacement of ECUs, etc.?
2. Forensics capabilities: What features does the IDS solution offer to investigate anomalies? Are cloud-based services offered, and what features do they offer?
3. Future proof: Is the solution future-proof by being easily and regularly updateable? Does it allow updates to the IDS software and its configuration separately?
4. Effort: What effort is required to integrate the IDS solution in a vehicle, mainly cost. For instance, is a single centralized IDS implementation required or distributed throughout a vehicle (on various individual ECUs)?
5. Performance: Will the IDS solution run on a production grade automotive micro-controller, and what performance specifications does it have?
4. Test Concept
4.1
Basic test concepts
As indicated early in this document the intent of this project is to test and assess in-vehicle IDS solutions by injecting simulated CAN bus attacks in the form of CAN message anomalies. These anomalies are designed to manipulate “normal” vehicle CAN messages by various formats as indicated in section 3.4. The intent is not to attack the vehicle per se, but to exercise the integrated in-vehicle IDS where the vehicle data bus architecture is used as a rolling test-bed.
Anomalies are injected directly onto the vehicle CAN bus through the OBD-II port on the main high-speed bus only. Vehicle actions taken during simulated attacks include both routine and unusual events. The emphasis is to conduct vehicle operations through naturalistic means with occasional operation that could be classified as fringe, yet normal.
To expose the IDS solutions to naturalistic vehicle operating conditions requires the ability to test for three sequence types:
1. Stationary Test Sequence: Initiate tests (simulated attacks) while the vehicle is stationary (engine on/transmission in park).
2. In Motion Test Sequence: Initiate tests (simulated attacks) while the vehicle is in motion (~25mph on straight-away).
3. False Positive Testing: In addition to monitoring for false positives for in motion and stationary test types, an extended duration drive (without simulated attacks) was conducted, during which vehicle features were exercised in a prescribed and naturalistic manner to elicit false positive alerts. (Note: this includes behaviors indicated in the false positive attack categories identified in sections 3.4.5 and 3.4.6).
In motion and stationary sequences differ slightly, but both utilize the many similar attack test types. The goal is to determine if the IDS is consistent in its detection capabilities under different vehicle operational states. The False Positive drive sequence is an attempt to determine if the IDS is prone to false positives under normal operating conditions.
During test development, an attempt was made to identify as many False Positive cases that correspond to attack test cases as possible. We defined a false positive case as an activation of a vehicle function that will invoke a CAN bus messages similar to an injected anomaly (e.g., if an injected anomaly message contains PRNDL misinformation, such as Reverse when in Park, then the false positive test type is to have the driver shift from Reverse to Park). By doing so, we can determine if the IDS can distinguish between valid and invalid bus content.
4.2
Vehicle considerations and vehicle selection
Considerations:
Throughout this report, three vehicle bus architectures become evident.
2. Vehicle architectures that include a security gateway. From a security standpoint on modern vehicles, it is becoming more apparent that a security gateway is a promising option to co-host the IDS in the future. Note that a security gateway provides basic filtering features to limit intrusions from external threat vectors such as OBD-II or infotainment sources and provides the ability to segment select buses from one another. The primary objective includes understanding how much additional value an IDS solution provides for intra-bus intrusion.
3. Proposed future architectures: Understanding how IDS solutions can support future architectures is the secondary objective.
Although not explicitly defined in Figure 4, OEMs typically include gateways in many of their network architectures, and it will be an attractive option to have IDS integrated onto a security gateway module. Gateways are currently used in production vehicles to segment CAN buses (e.g., OBD-II, infotainment, powertrain, body, occupant safety-critical, non-safety critical). Co-hosting the IDS in the security gateway is a logical approach. The gateway can enable filtering between network partitions based on preprogrammed or cloud-updated whitelists/blacklists, whereby the IDS could provide intra-bus detection.
Vehicle selection:
Test vehicle support was made possible by OEM stakeholders who expressed a willingness to participate in this project and was a direct factor in the number of unique vehicle architectures utilized. As previously indicated, the three vehicles chosen were anonymized as Vehicle 1, 2 and 3 respectively. The goal was not to assess as many vehicle architectures as possible in hopes of assessing a significant CAN bus population; but rather to be used as a guide to create a framework upon which to build a process for the assessment of IDSs.
Vehicles were purposely chosen to help achieve variability between OEMs as well as systems content (low- to high-feature content) to expose IDS suppliers to significantly different test beds (i.e., CAN bus architectures). The ambition was to provide a broad-based test environment for IDS performance assessments of modern vehicles.
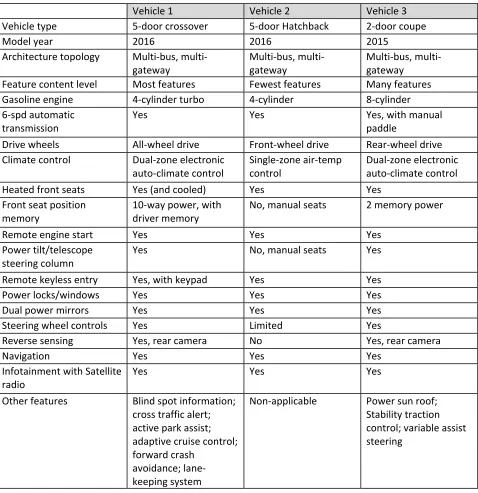
Table 2 summarizes selected feature content of the test vehicles. Minor features are not included. Table 2 shows that Vehicle 1 had the most content, Vehicle 2 the least content, and Vehicle 3 moderate content.
The simulated attacks are different for each model and are influenced by the specific CAN bus message traffic and the vehicle features. Some vehicles, such as Vehicle 1 in this project, have many features such as crash avoidance systems, seat adjustment, and memory (cooled) front seats. More features translate into more data bus traffic, more combinations of data bus messaging, and more potential for unusual data bus traffic, such as when two infrequently-used features are exercised at the same time. Furthermore, the simulated attacks are customized for each vehicle so that there are notable effects of some of the simulated attack actions (e.g., an instrument cluster icon is activated).
Table 2: Vehicle feature content
Vehicle 1 Vehicle 2 Vehicle 3
Vehicle type 5-door crossover 5-door Hatchback 2-door coupe
Model year 2016 2016 2015
Architecture topology Multi-bus,
multi-gateway Multi-bus, multi-gateway Multi-bus, multi-gateway
Feature content level Most features Fewest features Many features
Gasoline engine 4-cylinder turbo 4-cylinder 8-cylinder
6-spd automatic
transmission Yes Yes Yes, with manual paddle
Drive wheels All-wheel drive Front-wheel drive Rear-wheel drive
Climate control Dual-zone electronic
auto-climate control Single-zone air-temp control Dual-zone electronic auto-climate control
Heated front seats Yes (and cooled) Yes Yes
Front seat position
memory 10-way power, withdriver memory No, manual seats 2 memory power
Remote engine start Yes Yes Yes
Power tilt/telescope
steering column Yes No, manual seats Yes
Remote keyless entry Yes, with keypad Yes Yes
Power locks/windows Yes Yes Yes
Dual power mirrors Yes Yes Yes
Steering wheel controls Yes Limited Yes
Reverse sensing Yes, rear camera No Yes, rear camera
Navigation Yes Yes Yes
Infotainment with Satellite
radio Yes Yes Yes
Other features Blind spot information;
cross traffic alert; active park assist; adaptive cruise control; forward crash
avoidance; lane-keeping system
Non-applicable Power sun roof;
4.3
IDS supplier considerations and supplier selection
As previously indicated in section 2.4, three qualified suppliers were identified as participants to be assessed. The intent is not to grade or rank supplier performances per se, but to establish a methodology to assess a variety of competing anomaly detection products customized for modern vehicle automotive applications. Therefore, it was decided not to identify supplier company names. Again, suppliers are identified as Supplier A, B, and C respectively.
All project IDS suppliers provided a stand-alone (non-gateway) anomaly-based detection strategy as their design of choice. Their designs incorporated local detection of real-time anomalies and did not leverage any cloud-based support features. All supplier products were still considered in the developmental prototype design stage; however, each product used in this project included customized hardware utilizing embedded microprocessor-based architectures (i.e., no virtual machine solutions were selected for this project).
5. Test Method
5.1
Test equipment including IDS
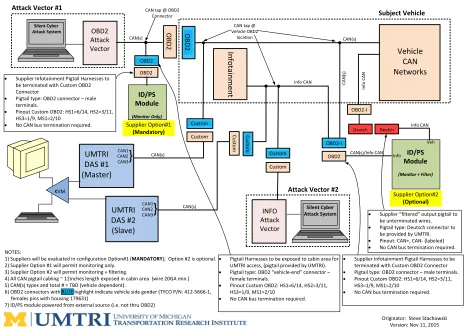
To physically conduct performance assessments of automotive IDS products required the research team to design a rolling vehicle test-bed to meet necessary data capture and logging specifications. Figure 4 depicts a high-level vehicle integration architecture with associated test equipment capable of performing such a task. This diagram illustrates both attack interface locations as well as data acquisition system monitoring locations for this test-bed.
The vehicle test-bed is used to inject simulated attacks via anomalous CAN messages as well as capture complete CAN bus logs. As described in section 3.4, the software developer provided an attack module (hardware/software attack scripts) with an intuitive user laptop interface to conduct all simulated attacks (true positive test cases). CAN bus data was captured via two methods: (1) data acquisition systems (DAS) log files and (2) IDS supplier log files. Multiple log files allow the team to run reliable post analytics and provide metrics on supplier performance. An additional user interface to the main DAS allows the test conductor to manage the Run ID, attack type, supplier, and access to start/ end data collection for an attack sequence. A secondary DAS logs data synchronously with the main DAS and is used when more bus channel inputs are required. DAS data files with preselected unique Run ID provides a distinct identifier for each attack test. Both the main and secondary DAS have very accurate internal clocks and an integrated 5 Hz GPS receiver to provide periodic sub-millisecond time pulses for synchronizing data collected between the two platforms. An additional application was run using Vector’s CANoe with customized CAPL script to output a sync CAN message every 12 seconds (CAN ID: 0x7FA) on the main high-speed bus to represent a global CAN message timestamp for log synchronization.
Figure 4: Vehicle Test Bed - Integration Systems Architecture
2015-16 NHTSA- IDIQ Anomaly Detection Project - Instrumentation Systems Diagram
Originator: Steve Stachowski Version: Nov 11, 2015
Silent Cyber Attack System Vehicle CAN Networks CAN(s)
Attack Vector #1
Subject Vehicle UMTRI DAS #1 (Master) CAN1 CAN2 CAN3 NOTES:
1) Suppliers will be evaluated in configuration Option#1 (MANDATORY); Option #2 is optional. 2) Supplier Option #1 will permit monitoring only.
3) Supplier Option #2 will permit monitoring + filtering.
4) All CAN pigtail cabling ~ 12inches length exposed in cabin area (wire 20GA min.) 5) CAN(s) types and total # = TBD (vehicle dependent).
6) OBD2 connectors with BLUE highlight indicate vehicle side gender (TYCO P/N: 412-5666-1, females pins with housing 179631)
7) ID/PS module powered from external source (i.e. not thru OBD2)
• Supplier Infotainment Pigtail Harnesses to be terminated with Custom OBD2 Connector
• Pigtail type: OBD2 connector – male terminals.
• Pinout Custom OBD2: HS1=6/14, HS2=3/11, HS3=1/9, MS1=2/10
• No CAN bus termination required.
Infotainment
OBD2
• Pigtail Harnesses to be exposed to cabin area for UMTRI access, (pigtail provided by UMTRI).
• Pigtail type: OBD2 “vehicle-end” connector – female terminals.
• Pinout Custom OBD2: HS1=6/14, HS2=3/11, HS3=1/9, MS1=2/10
• No CAN bus termination required.
CAN(s) OBD2 Attack Vector Supplier Option#1 (Mandatory) INFO Attack Vector Silent Cyber Attack System
Attack Vector #2
Supplier Option#2 (Optional)
Custom Info
Veh CAN tap @
Vehicle OBD2 location
Custom
ID/PS Module
(Monitor + Filter)
ID/PS Module (Monitor Only) Custom Custom OBD2 UMTRI DAS #2 (Slave)
CAN tap @ OBD2 Connector KVM CAN(s) CAN(s)
}
CAN1 CAN2 CAN3}
Info CAN Custom Custom OBD2 OBD2 OBD2 OBD2-I CAN(s)/Info CAN Info CAN Info CAN Deutch CAN (s) Deutch• Supplier “filtered” output pigtail to be unterminated wires.
• Pigtail type: Deutsch connector to be provided by UMTRI.
• Pinout: CAN+, CAN- (labeled)
• No CAN bus termination required. OBD2-I
• Supplier Infotainment Pigtail Harnesses to be terminated with Custom OBD2 Connector
• Pigtail type: OBD2 connector – male terminals.
• Pinout Custom OBD2: HS1=6/14, HS2=3/11, HS3=1/9, MS1=2/10
• No CAN bus termination required.
As Figure 4 illustrates, there are two possible options for IDS integration with the test vehicle.
• Option #1 (mandatory*): IDS parallel integration at the OBD-II connector via a breakout harness, simply functioning as an independent CAN node
• Option #2 (optional): IDS serial integration between the infotainment and remaining vehicle bus and performing a gateway/filter function on the infotainment bus segment. (mentioned for completeness)
* Specific to this project, all IDS products were designed and tested per Option #1 configuration only.
In addition, there are two physical attack vector locations with direct injection onto vehicle CAN buses.
• Attack Vector #1 - via injection at the OBD-II connector
• Attack Vector #2 - via injection at an infotainment bus splice * Specific to this project, all attacks originated from Attack Vector #1 only.
of IDS design bus monitoring, it was left to the discretion of the suppliers on which buses to monitor for anomalous behavior. The presumption is that anomalies are injected only on the main high-speed CAN bus, but may manifest themselves on other vehicle buses through a vehicle gateway (if implemented by an OEM).
5.1.1 Vehicle instrumentation
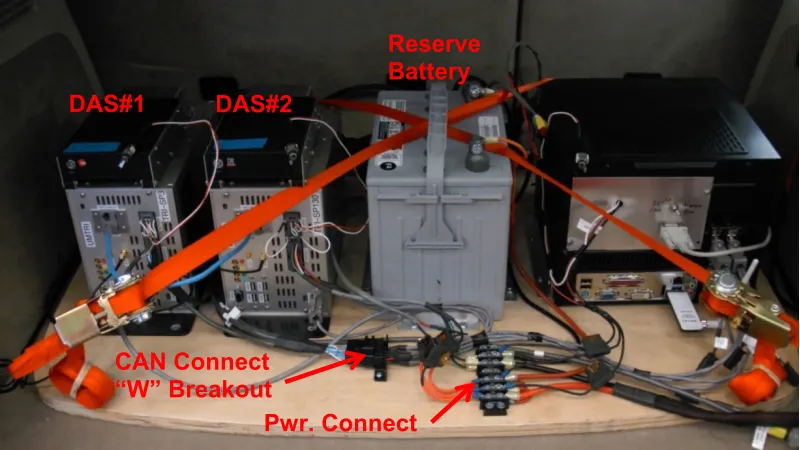
[image:31.612.106.506.248.476.2]As indicated in section 5.1, the research team instrumented each test vehicle according to the proposed test-bed architecture. Figure 5 and Figure 6 show various instrumentation components used on one of the test vehicles. Vehicle CAN bus access was utilized with a “W” breakout harness at the OBD-II connector to allow multiple users simultaneous access to all available CAN buses. Figure 5 shows dual DAS monitors used by the rear-seated test conductor to manage the test protocol.
Figure 5: DAS Monitors for Test Identification and Monitoring
DAS Monitors
Typical dynamic road testing requires up to three test personnel: (1) scripted driver, (2) front passenger to log test details and initiate simulated attacks, and (3) rear passenger to run the data acquisition system as “test run coordinator” and monitor health of logging systems.
To achieve a flexible test environment, components were integrated on a modular platform in the rear of the test vehicle as shown in Figure 6. It includes two data acquisition systems (master/slave DAS), Silent-Cyber module (containing all scripted attacks for all three test vehicles), back-up battery for reserve capacity to support DAS loading (especially important with vehicle in the engine off/accessory on state), and associated wire harnesses to interface to vehicle power and communication buses. For versatility, all test equipment is securely attached to a mobile mounting platform for ease of transfer between the three test vehicles. Ratchet straps are used to secure test platform to vehicle for safety during dynamic and false positive testing.
Figure 6: DAS Instrumentation
DAS#1 DAS#2
Reserve Battery
CAN Connect “W” Breakout
Pwr. Connect
Additional test tools were utilized throughout the project to enable vehicle research and execute IDS performance assessments:
• One OEM provided the use of their custom diagnostic tool, interfaced through the OBD-II, permitting operation in two different modes: (1) to run various diagnostics “during” an IDS performance assessment session and (2) to clear fault codes when necessary (i.e., some simulated attacks would set vehicle fault codes).
• The team purchased a Vector Informatik “CANoe” tool utilizing Vector’s Communication Access Programming Language (CAPL) to clear codes in another OEM’s vehicle. Acquiring the OEM specific diagnostic tool was prohibitively expensive.
5.1.2 IDS integration
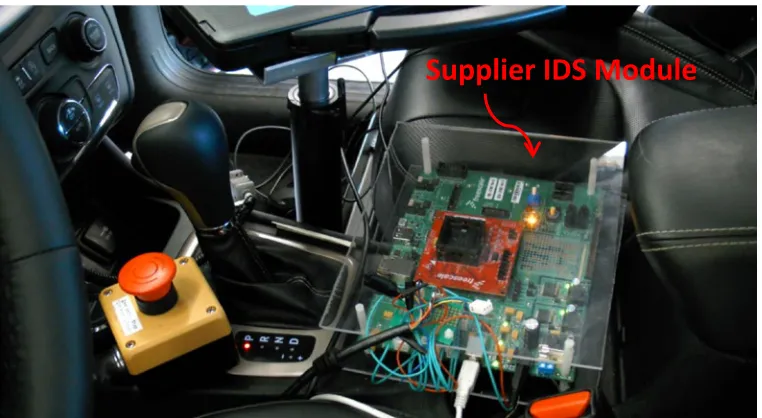
Figure 7: Example of a Prototype IDS Integrated in Vehicle Cabin
Supplier IDS Module
5.2
Supplier integration and calibration
To insure a successful and unbiased assessment landscape between the research team and the IDS suppliers, limited information was shared between the two project partners. General vehicle integration and operational conditions were established, however, to provide some level of design guidance to suppliers.
Information provided to suppliers:
• Vehicle make, model, feature content
• All vehicle CAN bus database files (.dbc files) provided by OEMs
• Simulated attack types (i.e., representing anomaly category types)
• Attacks would be injected onto main high-speed CAN bus only
• Performance assessment includes both static (engine on/parked) and dynamic vehicle operating conditions
• Naturalistic “long-drive” for eliciting false positive alerts (i.e., no simulated attacks)
• Diagnostic events would be exercised Information not provided to suppliers:
• What attack message IDs would be sent
• When attack messages would be sent
• Details of specific attacks
• How many attacks would be used during assessments
• Performance assessment metrics to be used for performance (some IDS suppliers may infer metrics used based on previous experience with the research team on similar projects)
• Exact vehicle status/driving conditions during static and dynamic assessments
As indicated in section 4.3 IDS suppliers followed a “training development protocol” agreed upon by both the research team and suppliers alike. This training occurred with a two-stage approach: Stage 1: Off-Site Pre-Development:
• To allow algorithm development prior to visiting the team, suppliers were provided the appropriate vehicle CAN bus database files (.dbc file) by the OEMs. These databases describe all bus messages (message IDs, payload ranges, transmit rates, etc.) between transmitting and receiving ECUs. This is replicated for each CAN bus on each test vehicle. The team also shared its principal document “Supplier Version Test Methodology” (Test Plan) to suppliers. This document describes the project’s objectives, the test vehicles, test bed, and an overview of the anomaly categories (attack categories) and assessment metrics. The “supplier version” document is a subset of the overall project test methodology (less specific details about what would unfairly bias IDS designs for assessments). The test methodology document was a living document during the critical phase of the interaction with IDS suppliers such that updates were frequent to incorporate all IDS suppliers’ feedback. The document also defined qualifications to IDS suppliers such as a time stamping mechanism, alert detection acknowledgement message, and supplier log content.
• In addition, to help expedite IDS design work, suppliers would typically acquire a vehicle of very similar build content to help start in-vehicle algorithm development (supplier vehicles were not always exact replicas of actual project test vehicles). The team and suppliers also discussed new CAN bus messages (outside of OEM database files) required to supplement the data collection process for proper alert identification.
Stage 2: On-Site Development and Training:
• Although each supplier’s design approach is different, one commonality among suppliers is the condition to spend significant development time in the actual assessment test vehicle to adequately “train” and refine their algorithm. This is accomplished through extensive exposure to as many vehicle operating conditions as possible (both static and dynamic). At this stage of IDS product maturity, on-site algorithm training is very labor intensive in the sense that it requires the ability to exercise every conceivable vehicle operating condition. The on-site training process is iterative, and it is not uncommon to have multiple on-site training sessions for each supplier, continually striving to achieve an optimal level of performance.
5.3
Attack scripts
A core element of this project is the development and use of simulated attacks to allow in-vehicle IDS investigation and assessment. CAN bus anomalies (simulated attack scripts) were designed utilizing prior knowledge
![Figure 1: Standard CAN Frame With 11-Bit ID [10]](https://thumb-us.123doks.com/thumbv2/123dok_us/228513.1021858/12.612.85.535.89.263/figure-standard-frame-bit-id.webp)