R E S E A R C H A R T I C L E
Open Access
Visual detection of cortical breaks in
hand joints: reliability and validity of
high-resolution peripheral quantitative
CT compared to microCT
A. Scharmga
1,2,3*, M. Peters
1,2,3, A. van Tubergen
1,3, J. van den Bergh
1,2,4,5, J. de Jong
1,2, D. Loeffen
6,
B. van Rietbergen
7, R. Weijers
6and P. Geusens
1,3,5Abstract
Background:To study the reliability and validity of high-resolution peripheral quantitative CT (HR-pQCT) with microCT (μCT) as gold standard in the visual detection of cortical breaks in metacarpophalangeal (MCP) and proximal interphalangeal (PIP) joints.
Methods:Ten cadaveric fingers (10 MCP and 9 PIP joints) were imaged by HR-pQCT andμCT and visually analyzed by two independent readers. Intra- and interreader reliability were evaluated for the presence (yes/no, kappa statistics) and the total number (intraclass correlation coefficient, ICC) of cortical breaks. Sensitivity, specificity, positive and negative predictive value (PPV respectively NPV) of HR-pQCT in detecting cortical breaks were calculated.
Results:With HR-pQCT, mean 149 cortical breaks were identified and withμCT mean 129 (p< 0.05). Intrareader reliability for the presence of a cortical break per quadrant was 0.52 (95 % CI 0.48–0.56) and 0.71 (95 % CI 0.67–0.75) for HR-pQCT andμCT, respectively, and for the total number of cortical breaks 0.61 (95 % CI 0.49–0.70) and 0.75 (95 % CI 0. 68–0.82). Interreader reliability for the presence of a cortical break per quadrant was 0.37 (95 % CI 0.33–0.41) and 0.45 (95 % CI 0.41–0.49) for HR-pQCT andμCT, respectively, and for the number of cortical breaks 0.55 (95 % CI 0.43–0.65) and 0.54 (95 % CI 0.35–0.67). Sensitivity, specificity, PPV and NPV of HR-pQCT were 81.6, 64.0, 81.6, and 64 % respectively.
Conclusion:Cortical breaks were commonly visualized in MCP and PIP joints with HR-pQCT andμCT. Reliability of both HR-pQCT andμCT was fair to moderate. HR-pQCT was highly sensitive to detect cortical breaks withμCT as gold standard.
Keywords:Imaging, Computed tomography, Hand, Bone, Rheumatoid arthritis
Background
Peri-articular cortical breaks are one of the characteristic features of bone involvement in rheumatoid arthritis (RA) and predictors of further radiographic progression [1, 2]. Early detection of cortical breaks is an important indicator for intensifying treatment in order to modify the disease course [3]. In daily clinic, conventional radiographs (CR)
are considered the gold standard for detection of cortical breaks in the hand joints in rheumatic diseases. CR is widely available, fast to perform, relatively cheap, and extensively validated, however its sensitivity to detect structural bone changes is low compared to computed tomography (CT), MRI and ultrasound [4–7]. A novel, sensitive imaging technique is High-Resolution peripheral Quantitative Computed Tomography (HR-pQCT) [8]. HR-pQCT allows analysis of the cortical and trabecular microarchitecture of peripheral bones with an isotropic resolution of 82 micrometer (μm). This technique is now also applied for 3D assessment of the bone
* Correspondence:[email protected] 1
Department of Medicine, division of Rheumatology, Maastricht University Medical Centre, P.O. Box 5800NL-6202 AZ Maastricht, The Netherlands
2NUTRIM School of Nutrition and Translational Research in Metabolism,
Maastricht University, Maastricht, The Netherlands
Full list of author information is available at the end of the article
microarchitecture in the hand joints [8–10]. A study by Stach et al. has demonstrated that HR-pQCT is more sensitive than CR in detecting cortical breaks in the hand joints in RA and also in healthy controls [8]. However, the resolution of the HR-pQCT images can be of the same order as the thickness of the cortical bone in finger joints. Due to partial volume effects, it is possible that thin cortices are falsely identified as breaks. Therefore, in particular with thin cortices, the reliability, sensitivity and specificity of the measure-ments might be impaired and depend on the reader’s perception.
The aims of this study were 1). to investigate the intra-and interreader reliability, intra-and 2). to determine the sensitivity, specificity, positive predictive value (PPV) and negative predictive value (NPV) of HR-pQCT in de-tecting cortical breaks in hand joints, using μCT images with a much higher resolution (18μm) as gold standard. We were particularly interested in the methodology of identifying cortical breaks by HR-pQCT, not to study the clinical value of these cortical breaks. We hypothe-sized that HR-pQCT is a reliable and sensitive imaging method for identifying cortical breaks in hand joints compared toμCT.
Methods
Specimens
For this study, we used cadaveric specimen, because
μCT imaging can only be executed in-vitro. MCP and PIP joints of ten female right hand human cadaveric index fingers were imaged by both HR-pQCT and μCT. The donors had dedicated their body by testament signed during life to the Department of Anatomy and Embryology of the University of Amsterdam, the Netherlands. The fingers were fixated in formalin.
HR-pQCT andμCT image acquisition
HR-pQCT (XtremeCT1, Scanco Medical AG, Switzerland) scans were performed at clinical in vivo settings, ie at 60 kVp tube voltage, 900μA tube current, 100 ms integration time and 82μm voxel size.μCT (μCT 80, Scanco Medical AG, Switzerland) scans were performed at 70 kVp tube voltage, 114μA tube current, 300 ms integration time and 18 μm voxel size. On HR-pQCT, the region of interest of the MCP joint covered an area of 18.04 mm, 220 slices and for the PIP joint 9.02 mm, 110 slices.
On μCT, the region of interest covered an area of 15.26 mm; 848 slices and for the PIP joint 9.45 mm, 525 slices (Additional file 1: Figure S1) (see supplementary data available atBMC Musculoskeletal Disordersonline).
HR-pQCT andμCT image analysis
Scans of HR-pQCT and μCT were exported in Digital Imaging and Communications in Medicine (DICOM)
format and analyzed using Osirix (v.5.8.5 64-bit) multi-planar DICOM viewer. Differences in the extent of the scanned areas as well as in joint angles were noticed because the fingers were scanned horizontally on HR-pQCT and vertically on μCT. Corresponding first and last slices of the overlapping region were visually deter-mined to ensure that the same region of interest was used in the detection of cortical breaks on both imaging modalities.
Two trained readers (AS and MP) independently scored the HR-pQCT and μCT images visually for the presence of cortical breaks. The readers received exten-sive training from Study grouP for xtrEme Computed Tomography in Rheumatoid Arthritis (SPECTRA) and have additional reading experience, before the current dataset was read. Readers were aware of the hypothesis of this study. The images were not anonymized. HR-pQCT images were first and independently scored from
μCT images, with at least one day in between, and a two week interval for the rescoring by Reader 1.
A cortical break was defined as a clear disruption of the cortex, seen on two consecutive slices on two orthogonal planes (on transverse and on sagittal or coronal plane) on HR-pQCT, and similarly, but on nine consecutive slices on μCT to cover the same area as evaluated by HR-pQCT (Additional file 2: Figure S2).
To assess the location of the breaks in each joint, the transverse plane was divided into four quadrants: palmar, ulnar, dorsal and radial (Additional file 3: Figure S3). The phalangeal base and metacarpal head of the MCP joints, and proximal phalanx and distal phalanx of the PIP joints were separately assessed. In total eight quadrants per joint were analyzed, four in the proximal bone, and four in the distal bone of the same joint. Each joint was systematically analyzed per quadrant. Quadrants with large discrepancies between the readers (ie more than four breaks difference) were re-examined to identify reasons for discrepancy. Also, total volumetric bone mineral density (vBMD) of the specimens was calculated using HR-pQCT.
Statistics
Descriptive analyses were done to calculate the total number of cortical breaks scored by the readers per quadrant for each imaging modality.
quadrant. k and ICC were calculated on the level of all available quadrants. Kappa values were also re-cal-culated, corrected for potential prevalence and bias within the kappa value (Prevalence-Adjusted Bias Adjusted Kappa, PABAK) [11, 12]. Reliability was rated according to Landis et al.: <0.00 poor, 0.00–0.20 slight, 0.21–0.40 fair, 0.41–0.60 moderate, 0.61–0.80 substan-tial, 0.81–1.00 almost perfect [13]. Sensitivity, specifi-city, PPV, and NPV of HR-pQCT in the detection of cortical breaks were calculated withμCT as gold stand-ard. The mean value of the two readings of reader 1 (AS) was used for this purpose. Statistical analyses were performed with SPSS Statistics for Windows version 23.0 (IBM Corp., Armonk, NY).
Results
The mean age of the donors was 85.1 ± 9.6 years, the medical history was unknown. Average vBMD was 203 mgHA/cm3 for MCP joints, 293 mgHA/cm3 for PIP joints and 245 mgHA/cm3for the total joints. The scans of ten MCP and nine PIP joints with in total 152 quad-rants were available for analysis. One PIP joint could not be evaluated due to a missing μCT scan. Furthermore, Reader 1 considered the quality of the images of the metacarpal head in one MCP joint as too low on μCT due to a protocol error during scanning. Therefore four quadrants were excluded in the analyses of the
μCT images.
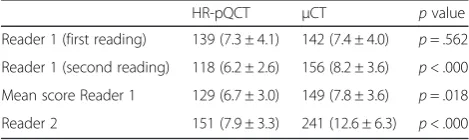
Table 1 shows the total number of cortical breaks each reader found on HR-pQCT andμCT images. The differ-ences in scores between the first and second reading of Reader 1 were not statistically significant on HR-pQCT (139 vs 118 breaks, p= .064) and μCT (142 vs 156 breaks, p= .163). However, the difference in the mean score between HR-pQCT versus μCT was statistically significant (respectively, 129 and 149 breaks, p< 0.05). The total number of cortical breaks on HR-pQCT scored by Reader 1 (first reading) versus Reader 2 was not sta-tistically significant (respectively, 139 versus 151 breaks, p= .288). On μCT, Reader 2 found significantly more breaks than Reader 1 (first reading) (241 vs 142 breaks, p< .001). In total 4 quadrants with large discrepancies
between the readers were re-examined. Several reasons for discrepancy were identified:
OnμCT we defined a cortical break when present on nine consecutive slices. Sometimes Reader 1 observed the cortical break on eight consecutive slices, hence not considering it a break, whereas Reader 2 observed it on nine consecutive slices, thereby fulfilling the criteria for a break.
The smaller the break, the less agreement between the readers. An example of this discrepancy is shown in Additional file4: Figure S4 panel A and B. Due to the low bone mineral density and thin
cortices, there was low contrast in some cases (example in Additional file4: Figure S4 panel C). Reader 1 considered a break as one large break,
whereas Reader 2 counted several small cortical breaks inside the same large break (example in Additional file4: Figure S4 panel D).
Table 2 shows the intra- and interreader reliability based on the 152 quadrants on HR-pQCT and 148 quadrants on μCT that were evaluated. Intrareader reliability was moderate to substantial for the pres-ence of breaks (HR-pQCT: k = 0.52 and μCT: k = 0.71) and for the number of breaks (HR-pQCT: ICC = 0.61 and μCT: ICC = 0.75).
Interreader reliability was fair to moderate for the pres-ence of breaks (HR-pQCT: k = 0.37 and μCT: k = 0.45,) and for the number of breaks (HR-pQCT: ICC = 0.55 and μCT: ICC = 0.54). The values of PABAK were comparable (Table 2).
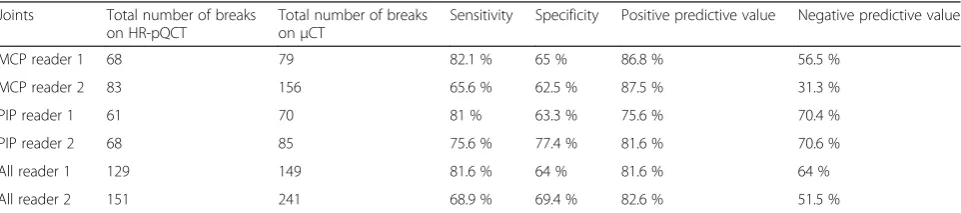
Sensitivity, specificity, PPV and NPV of HR-pQCT in the detection of cortical breaks withμCT as gold stand-ard were calculated with the mean scores of Reader 1 (reading 1 and 2) and the score of Reader 2. The sensi-tivity was 81.6 %, specificity 64 %, PPV 81.6 %, and NPV 64 % respectively for Reader 1, and sensitivity 68.9 %, specificity 69.4 %, PPV 82.6 % and NPV 51.5 % for Reader 2 (Table 3 and Additional file 5).
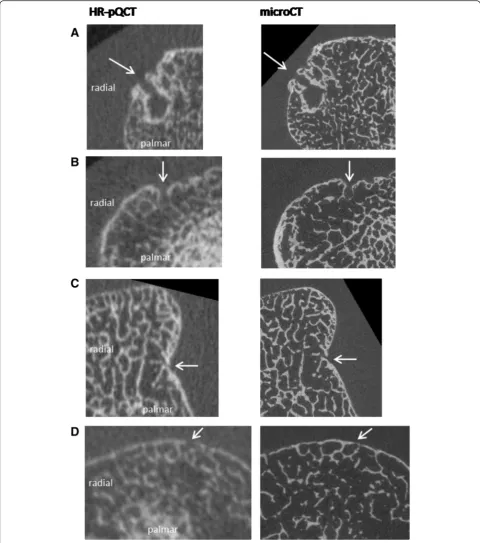
In Fig. 1, several examples of cortical breaks on corre-sponding HR-pQCT and μCT images are presented. Panel A and B show a cortical break on both HR-pQCT and μCT. In panel C, a discontinuity of the cortex is found on HR-pQCT. However, it did not meet the definition of a cortical break applied in this study, because it was visible on one slice only, leading to discrepancy with the results from μCT. In panel D, a cortical break was detected on HR-pQCT, but not on
μCT, where a thin cortical lining was seen.
Discussion
[image:3.595.56.291.620.690.2]This study is the first that reports on aspects of reliabil-ity and validreliabil-ity of detecting cortical breaks in hand joints
Table 1Number of cortical breaks scored per imaging modality
HR-pQCT μCT pvalue
Reader 1 (first reading) 139 (7.3 ± 4.1) 142 (7.4 ± 4.0) p= .562 Reader 1 (second reading) 118 (6.2 ± 2.6) 156 (8.2 ± 3.6) p< .000 Mean score Reader 1 129 (6.7 ± 3.0) 149 (7.8 ± 3.6) p= .018 Reader 2 151 (7.9 ± 3.3) 241 (12.6 ± 6.3) p< .000
Total number of detected cortical breaks on the HR-pQCT andμCT scans (mean ± SD per joint)
n= 19 joints
using HR-pQCT with μCT as gold standard. Cortical breaks were found in all joints with both imaging modal-ities. Intrareader reliability of HR-pQCT and μCT was moderate to substantial, while interreader reliability was fair to moderate. The sensitivity of HR-pQCT in detect-ing cortical breaks was high (81.6 %).
In our study, only cortical discontinuities meeting the definition of a break, ie clearly visible cortical interrup-tions on at least 2 HR-pQCT (or 9 μCT) consecutive slices in two planes, were scored as a cortical break. They may have different pathological or physiological backgrounds, such as erosions or vascular channels [8, 9]. A formal classification system for defining breaks visualized on HR-pQCT andμCT is lacking. Histological examination is needed to provide more insight in the na-ture of these cortical breaks and for developing definitions.
In a previous study by Stach et al. an almost perfect and substantial intra- and interreader reliability was reported using HR-pQCT for grading bone lesions and discrimination between healthy individuals and RA patients (k = 0.82 and k = 0.75 respectively), but reliabil-ity on the presence and number of cortical breaks was not reported [8]. The precision in scoring abnormalities visualized with several imaging techniques varies widely, even by experienced readers, as has been demonstrated for example for scoring radiographs in RA (ICC ranged from 0.65 to 0.99) [14]. In general, lower values for interreader reliability in comparison with intrareader re-liability are reported [15], corresponding to our find-ings. In our study, the breaks were scored visually,
which is reader dependent. An automatic scoring algorithm, with detection of pre-defined definitions of breaks and executed automatically by the computer, could potentially improve reliability by minimizing reader interventions.
We investigated the sensitivity of HR-pQCT in detect-ing cortical breaks with μCT as the gold standard and found a high sensitivity (81.6 %). Unfortunately, no com-parative studies are available. In contrast, two studies used HR-pQCT as the reference method for investigat-ing the sensitivity to detect cortical breaks of other imaging modalities [9, 16]. These studies reported a sen-sitivity of 85.7 % for MRI, 60.9 % for CR, and 83–100 % for ultrasound with HR-pQCT as the reference method [9, 16]. We found a lower specificity of HR-pQCT in detecting cortical breaks (64 %) in comparison to sensi-tivity. A possible explanation for this could be a phenomenon attributed to a partial volume effect leading to a reduced cortical signal on HR-pQCT, giv-ing the impression that a cortical break is present, whereas on μCT the cortex is intact. An example of this is shown in Fig. 1, panel D.
[image:4.595.58.544.100.154.2]There are several limitations of this study. First, we evaluated whether the total number of breaks counted per quadrant corresponded between the two imaging modalities, but did not consider correspondence in exactly the same location. This might have led to an overestimation of the reliability. Second, we used fingers from cadaver specimens with unknown medical history and a relatively high mean age (85.1 years). Due to the old age of the donors, and the preservation in formalin,
Table 2Intra- and interreader reliability per imaging modality
Intrareader (reader 1) Interreader (reader 1 first reading versus reader 2) k (95 % CI) PABAK (95 % CI) ICC (95 % CI) k (95 % CI) PABAK (95 % CI) ICC (95 % CI) HR-pQCT .52 (0.48 to 0.56) .53 (0.39 to 0.66) 0.61 (0.49 to 0.70) .37 (0.33 to 0.41) .38 (0.23 to 0.53) 0.55 (0.43 to 0.65) μCT .71 (0.67 to 0.75) .72 (0.60 to 0.83) 0.75 (0.68 to 0.82) .45 (0.41 to 0.49) .47 (0.33 to 0.61) 0.54 (0.35 to 0.67)
Intra- and interreader reliability of HR-pQCT andμCT images based on 152 quadrants for HR-pQCT and 148 quadrants onμCT. Kappa value was calculated on the presence of a cortical break (yes/no) and ICC was calculated on the total number of cortical breaks in all quadrants
Abbreviations:PABAKprevalence-adjusted bias-adjusted kappa values,ICCintraclass correlation,HR-pQCThigh resolution peripheral quantitative computed tomography, μCTmicroCT
Table 3Sensitivity, specificity, positive predictive value and negative predictive value of HR-pQCT
Joints Total number of breaks on HR-pQCT
Total number of breaks onμCT
Sensitivity Specificity Positive predictive value Negative predictive value
MCP reader 1 68 79 82.1 % 65 % 86.8 % 56.5 %
MCP reader 2 83 156 65.6 % 62.5 % 87.5 % 31.3 %
PIP reader 1 61 70 81 % 63.3 % 75.6 % 70.4 %
PIP reader 2 68 85 75.6 % 77.4 % 81.6 % 70.6 %
All reader 1 129 149 81.6 % 64 % 81.6 % 64 %
All reader 2 151 241 68.9 % 69.4 % 82.6 % 51.5 %
Sensitivity, specificity, positive predictive value and negative predictive value of HR-pQCT in the detection of cortical breaks withμCT as gold standard based on the mean score of Reader 1 (readings 1 and 2), and the score of Reader 2
[image:4.595.58.539.599.706.2]the cortices might become less mineralized [17]. The average vBMD of the specimens was 245 mgHA/cm3, which is some 20 % lower than the average in the normal population (>300 mgHA/cm3) [10, 18]. This may hamper the scoring of a cortical break on HR-pQCT. It is also possible that thin regions were falsely identified as a cortical break. However, the use of cadaveric speci-mens was essential as in vivo human subjects cannot be measured by μCT because of a long scanning time. Third, the cadaveric specimens had slightly different orientations in the HR-pQCT versus the μCT scanner. Despite the careful visual matching of the regions of interest on HR-pQCT and μCT, the angle at which the transversal images were viewed was slightly different in some joints and a cortical break might therefore be missed. Fourth, a discrepancy between the readers re-garding the number of cortical breaks identified onμCT was noticed. μCT images provide much detail, and in particular very small cortical interruptions were not al-ways picked up by Reader 1. This indicates that, when visually analyzing μCT images, more stringent defini-tions are necessary than when using HR-pQCT because of the higher resolution.
Conclusions
Cortical breaks were commonly visualized in hand joints with HR-pQCT andμCT. Reliability of both HR-pQCT and μCT was fair to moderate. HR-pQCT was sensitive to detect cortical breaks with μCT as gold standard. In spite of the limitations of our study, including the discrepancy ofμCT results between the readers, we have shown that HR-pQCT is highly sensitive to detect cor-tical breaks with a fair to moderate reliability compared toμCT. Our findings need further evaluation, preferably with focus on histological analyses to clarify the nature of the breaks and to establish more reliable definitions and a classification system for analyzing cortical breaks on high-resolution CT images.
Additional files
Additional file 1:Method of selection of regions of interest. Method of selection of regions of interest in an MCP and PIP joint on HR-pQCT and μCT. Total scan area for an MCP joint on HR-pQCT was 18.04 mm and for a PIP joint 9.02 mm. Total scan area for an MCP joint onμCT was 15.26 mm and for a PIP joint 9.45 mm. Abbreviations: HR-pQCT; high-resolution peripheral quantitative computed tomography,μCT; micro computed tomography, MCP; metacarpophalangeal, PIP; proximal interphalangeal. (TIF 11020 kb)
Additional file 2:Resolution of HR-pQCT andμCT imaging. Resolution of HR-pQCT imaging is 82μm, while the resolution ofμCT imaging is 18μm. To match both resolutions, two consecutive slices on HR-pQCT correspond with 9 consecutive slices onμCT. Abbreviations: HR-pQCT; high-resolution peripheral quantitative computed tomography,μCT; microCT. (TIF 3952 kb)
Additional file 3:Division of a phalangeal base of an MCP joint. Phalangeal base of an MCP joint divided into palmar, ulnar, dorsal and radial quadrants. Abbreviations: MCP; metacarpophalangeal (TIF 9718 kb)
Additional file 4:Examples ofμCT images. Examples ofμCT images that could have attributed to the differences in scoring cortical breaks between Reader 1 and 2. Panel a. Large cortical breaks (arrow) show high agreement. Panel b. Small cortical breaks (arrow) show less agreement. Panel c. An extremely thin cortex (arrow). Panel d. One large break (in brackets) was counted by Reader 1, where Reader 2 considered this as several smaller cortical breaks (arrow). Abbreviations:μCT; microCT. (PNG 460 kb)
Additional file 5:2 × 2 contingency tables. 2 × 2 contingency tables for Reader 1 (all joints and MCP and PIP separately) and Reader 2 (all joints and MCP and PIP joints separately). (DOCX 17 kb)
Abbreviations
CR, conventional radiographs; CT, computed tomography; DICOM, digital Imaging and communications in medicine; HR-pQCT, high-resolution peripheral quantitative computed tomography; ICC, intraclass correlation coefficient; MCP, metacarpophalangeal; PIP, proximal interphalangeal; PPV, positive predictive value; RA, rheumatoid arthritis; k, Cohen’s Kappa;μCT, microCT;μm, micrometer
Acknowledgements None.
Funding
This study did not have any funding.
Availability of data and materials Data are available upon request.
Authors’contributions
AvT, PG, JvdB, BvR designed the study. AS and MP were responsible for the scoring. AS, AvT and PG analyzed the data. All authors were involved in discussing and interpreting the results, commented on the draft version of the manuscript and approved the final version.
Authors’information Not applicable.
Competing interests
Bert van Rietbergen is a consultant for Scanco Medical AG. The authors declare that they have no competing interests.
Consent for publication Not applicable.
Ethics approval and consent to participate
For this study cadaveric specimens were used. A handwritten and signed codicil from each donor, posed when still alive and well, is kept at the Department of Anatomy and Embryology, University of Amsterdam, Amsterdam, The Netherlands. This is required by Dutch law for the use of cadavers for scientific research and education.
Author details
1Department of Medicine, division of Rheumatology, Maastricht University
Medical Centre, P.O. Box 5800NL-6202 AZ Maastricht, The Netherlands.
2NUTRIM School of Nutrition and Translational Research in Metabolism,
Maastricht University, Maastricht, The Netherlands.3CAPHRI School for Public
Health and Primary Care, Maastricht University, Maastricht, The Netherlands.
4
Department of Internal Medicine, Viecuri Medical Center, Venlo, The Netherlands.5Faculty of Medicine and Life Sciences, Hasselt University,
Hasselt, Belgium.6Department of Radiology, Maastricht University Medical
Centre, Maastricht, The Netherlands.7Department of Biomedical Engineering,
Eindhoven University of Technology, Eindhoven, The Netherlands.
References
1. Schett G, Gravallese E. Bone erosion in rheumatoid arthritis: mechanisms, diagnosis and treatment. Nat Rev Rheumatol. 2012;8(11):656–64. doi:10.1038/nrrheum.2012.153. published Online First: Epub Date. 2. Geusens P, van den Bergh J. Bone erosions in rheumatoid arthritis.
Rheumatology (Oxford). 2014;53(1):4–5. doi:10.1093/rheumatology/ket358. published Online First: Epub Date.
3. Sommer OJ, Kladosek A, Weiler V, Czembirek H, Boeck M, Stiskal M. Rheumatoid arthritis: a practical guide to state-of-the-art imaging, image interpretation, and clinical implications. Radiographics. 2005;25(2):381–98. doi:10.1148/rg.252045111. published Online First: Epub Date.
4. Baillet A, Gaujoux-Viala C, Mouterde G, et al. Comparison of the efficacy of sonography, magnetic resonance imaging and conventional radiography for the detection of bone erosions in rheumatoid arthritis patients: a systematic review and meta-analysis. Rheumatology (Oxford). 2011;50(6): 1137–47. doi:10.1093/rheumatology/keq437. published Online First: Epub Date.
5. Geusens P, Chapurlat R, Schett G, et al. High-resolution in vivo imaging of bone and joints: a window to microarchitecture. Nat Rev Rheumatol. 2014;10(5):304–13. doi:10.1038/nrrheum.2014.23. published Online First: Epub Date.
6. Saraux A, Berthelot JM, Chales G, et al. Ability of the American College of Rheumatology 1987 criteria to predict rheumatoid arthritis in patients with early arthritis and classification of these patients two years later. Arthritis Rheum. 2001;44(11):2485–91.
7. Dohn UM, Ejbjerg BJ, Hasselquist M, et al. Detection of bone erosions in rheumatoid arthritis wrist joints with magnetic resonance imaging, computed tomography and radiography. Arthritis Res Ther. 2008;10(1):R25. doi:10.1186/ar2378. published Online First: Epub Date.
8. Stach CM, Bauerle M, Englbrecht M, et al. Periarticular bone structure in rheumatoid arthritis patients and healthy individuals assessed by high-resolution computed tomography. Arthritis Rheum. 2010;62(2):330–9. doi:10.1002/art.27252. published Online First: Epub Date.
9. Finzel S, Ohrndorf S, Englbrecht M, et al. A detailed comparative study of high-resolution ultrasound and micro-computed tomography for detection of arthritic bone erosions. Arthritis Rheum. 2011;63(5):1231–6. doi:10.1002/ art.30285. published Online First: Epub Date.
10. Fouque-Aubert A, Boutroy S, Marotte H, et al. Assessment of hand bone loss in rheumatoid arthritis by high-resolution peripheral quantitative CT. Ann Rheum Dis. 2010;69(9):1671–6. doi:10.1136/ard.2009.114512. published Online First: Epub Date.
11. Sim J, Wright CC. The kappa statistic in reliability studies: use, interpretation, and sample size requirements. Phys Ther. 2005;85(3):257–68.
12. Byrt T, Bishop J, Carlin JB. Bias, prevalence and kappa. J Clin Epidemiol. 1993;46(5):423–9.
13. Landis JR, Koch GG. The measurement of observer agreement for categorical data. Biometrics. 1977;33(1):159–74.
14. Sharp JT, Wolfe F, Lassere M, et al. Variability of precision in scoring radiographic abnormalities in rheumatoid arthritis by experienced readers. J Rheumatol. 2004;31(6):1062–72.
15. Salaffi F, Carotti M. Interobserver variation in quantitative analysis of hand radiographs in rheumatoid arthritis: comparison of 3 different reading procedures. J Rheumatol. 1997;24(10):2055–6.
16. Lee CH, Srikhum W, Burghardt AJ, et al. Correlation of structural abnormalities of the wrist and metacarpophalangeal joints evaluated by high-resolution peripheral quantitative computed tomography, 3 Tesla magnetic resonance imaging and conventional radiographs in rheumatoid arthritis. Int J Rheum Dis 2014 doi: 10.1111/1756-185X.12495 [published Online First: Epub Date]|.
17. Zebaze RM, Ghasem-Zadeh A, Bohte A, et al. Intracortical remodelling and porosity in the distal radius and post-mortem femurs of women: a cross-sectional study. Lancet. 2010;375(9727):1729–36. doi:10.1016/S0140-6736(10)60320-0. published Online First: Epub Date.
18. Feehan L, Buie H, Li L, McKay H. A customized protocol to assess bone quality in the metacarpal head, metacarpal shaft and distal radius: a high resolution peripheral quantitative computed tomography precision study. BMC Musculoskelet Disord. 2013;14:367. doi:10.1186/1471-2474-14-367. published Online First: Epub Date.
• We accept pre-submission inquiries
• Our selector tool helps you to find the most relevant journal • We provide round the clock customer support
• Convenient online submission • Thorough peer review
• Inclusion in PubMed and all major indexing services • Maximum visibility for your research
Submit your manuscript at www.biomedcentral.com/submit