2019 International Conference on Applied Mathematics, Modeling, Simulation and Optimization (AMMSO 2019) ISBN: 978-1-60595-631-2
A Method for Safety Evaluation and Enhancement of Urban Rail Transit
Network Based on Passenger Flow Assignment
Wei HUANG, Wei DONG
*and Xin-ya SUN
Beijing National Research Center for Information Science and Technology (BNRist), Tsinghua University, Beijing, China
Department of Automation, Tsinghua University, Beijing, China
*Corresponding author
Keywords: Passenger flow assignment, Urban rail transit, Safety evaluation, Safety enhancement.
Abstract. Safety evaluation and enhancement of urban rail transit network can identify risk bottlenecks and improve the network operation status, thereby reducing accidents and improving efficiency. Existing studies seldom consider quantitative calculation of operation risk and overall network distribution. In contrast, this paper proposes to quantitatively measure the safety of the rail transit network with a risk function. Minimizing the overall risk of the rail transit network is modeled as a convex optimization problem. Finally, a real case of Chongqing metro is taken for example to verify the method. The results show that with reasonable passenger flow assignment, the overall risk of the rail transit network is reduced.
Introduction
Urban rail transit is a significant way for residents to travel. With the gradual networking of urban rail transit and the continuous expansion of the city scale, passengers’ travel demand has increased rapidly. The operation characteristics of the rail transit network are different from a single line. Most of the traffic is concentrated on a small number of lines, resulting in a notable contradiction between capacity and demand. Besides, due to the stronger correlation between lines, the passenger flow of a single station has a greater influence on the rail transit network. Therefore, the operation risk increases. In the current situation, there is an urgent need for safety evaluation and enhancement of the entire operation network. In the meantime, on account of the growing degree of urban rail transit networking, the number of redundant paths in the network has increased. By reasonably distributing and controlling the passenger flow, the capacity and demand of the transportation system can be more matched, and the operation state of the rail transit network can be more stable, thereby reducing risks and improving safety. Hence, this paper takes the load rate of stations and sections as the input of the risk function to calculate the overall risk of the rail transit network. By minimizing the overall risk of the rail transit network, the optimal assignment strategy for passenger flow is obtained, which enhances operation safety.
Related Literature
Related researches about the evaluation of the rail transit network safety focus on the selection and integration of evaluation indicators. Niu [1] applied risk assessment, analytic hierarchy process and multi-level gray evaluation model to the risk evaluation of coal railway transportation network in China. Xiao [2] constructed a multi-level evaluation index system and employed gray clustering to integrate the indexes so as to assess the safety status of the rail transit network. Through analyzing the operation risk of urban rail transit network, Xiao [3] identified key stations and sections and used Topsis along with gray correlation analysis to perform time series dynamic evaluation of the rail transit network operation safety.
framework to model network cost and passenger route choice. Yao [6] regarded travelers and trains as individual agents and built a framework based on simulation for dynamic passenger assignment. Zhao [7] embedded railway ticket selling strategy and passenger ticketing time sequence into the process of passenger flow assignment and designed a high-speed railway passenger flow assignment method in consideration of ticket selling strategy.
Researches on passenger flow control usually concentrate on stations or a single line. Li [8] comprehensively considered train dynamic control and passenger flow control, proposed to minimize the deviation of subway timetable, and used predictive control to transform the problem into quadratic programming. Xu [9] focused on the organization of passenger flow in stations when demand was uncertain and studied the passenger flow control results in three different cases. In [10], in order to solve the contradiction between supply and demand, the network passenger flow was firstly distributed, and the time-based passenger flow of the effective path was obtained, so as to coordinately control and optimized the inbound passenger flow of the entire road network. Literature [11] established an integer programming model by monitoring the passenger flow and flow direction of the rail transit station to match the passing capability of the node with the passenger flow demand. With the goal of maximizing passenger throughput, Lu [12] created a linear planning model for passenger flow control.
The above researches on the assessment of the rail transit network safety usually focus on selecting various static indexes to reflect the state of the rail transit network, while think less about the passenger flow assignment scheme. The passenger flow assignment researches aim to accurately describe the passengers’ path selection behavior and derive the traffic through the OD data after the trip is completed. Most of the researches on passenger flow control pay more attention to the station than the rail transit network. Under the premise that passengers’ OD demand is known in advance, this paper abstracts the discrete train operation into continuous traffic flow and designs the passenger flow distribution plan to minimize the overall risk of the rail transit network.
Models
As urban rail transit becomes networked to a higher degree, there are more redundant paths between OD pairs, leading to more transfer options. Many researches on passenger flow assignment focus on passengers’ transfer behavior. After the travel is completed, the optimization objective is obtained through passengers’ utility function to derive the transfer passenger flow. In this paper, it is assumed that passengers’ OD demand is known in advance, and passengers will complete their travel according to the distribution plan.
The following notations are defined to formulate the proposed model. Let i,j,n=1,…,S be the station indices, where S is the stations’ total number. Set the passenger flow demand matrix as Q and let qij be the travel demand from station i to station j, the unit of which is passengers/h (here “h” means “hour”, and the same below). In view of the structural constraints of the station and the relevant national regulations, the station has a maximum throughput while ensuring passengers’ safety, which is denoted by Ci(passengers/h). Set k=1,…,T as the section indices, T being the
sections’ total number. Owing to the short interval in urban rail transit, it is proper to regard the discrete train operation based on timetables as a continuous process. Use Lk(passengers/h) to represent the transport capacity of section k. Denote Pij as the path set of OD pair qij and pijm as the m
th simple path. Obviously, the decision variables are the OD traffic assigned to each path, which are denoted by xijm(passengers/h). This paper mainly considers the steady state established after the distribution of the passenger flow. Different OD flows will be superimposed on the same section. Let yk(passengers/h) be the actual transportation status of section k . Set zi(passengers/h) as the
throughput of station i after the passenger flow distribution. Let ∆ be the set of the correspondence between sections and paths. δkijm =1 indicates section k is on path pijm. Let Θ be the set of the
topology. In this paper, ai,bk are the multiplication factors when calculating the risk of station i and
section k.
After the OD demand is assigned, the actual transportation status of the station and the section can be obtained. The matching relation between the actual state and the capability reflects the safety state of the rail transit network. In order to quantitatively assess the rail transit network risk, it is necessary to use the risk function for calculation. Let the risk function of stations and sections be f(·) and g(·). Obviously, as the input increases, the derivative of the risk function will also increase. This paper chooses ex as the risk function. Therefore the optimization goal is to minimize the following risk function
min (∑ ai*f(zi
Ci)+∑ bk*g( yk Lk)
k )
i . (1)
The constraints are as follows
zi= ∑jqij + ∑jqji + ∑njm(xnjm*θinjm) i,j,n=1,…,S. (2)
∑ xijm
m =qij i,j=1,…,S. (3)
xijm≥0 i,j=1,…,S. (4)
yk= ∑ (xijm*δ kij
m) k=1,…T
ijm . (5)
Eq. 2 is used to calculate the load of passenger flow at the station, including inbound and outbound passenger flow and transfer passenger flow for the transfer station. Eq. 3 and Eq. 4 are passenger flow distribution constraints. Eq. 5 is used to calculate the passenger load of sections.
Solution Procedure
First, we need to analyze the nature of the optimization problem. In this paper, xijm is a decision variable whose constraints are linear functions. So the feasible domain is a convex set. As for the objective function, it can be known from the constraints that zi,ykare linear combinations of xijm, so
the objective function can be expressed as ∑c*eAx+b. It is not difficult to prove that eAx+b is also a convex function. Thus, the optimization problem of this paper is a convex optimization problem.
Solutions to the convex optimization problem are relatively mature. This paper uses Matlab's CVX toolbox to solve the convex optimization problem. CVX converts Matlab into a modeling language and allows Matlab expressions to be used to specify constraints and targets. Besides, convex optimization problems can be efficiently solved. When determining the optimization variables, it’s essential to find simple paths between any two stations in the rail transit network. In order to avoid too many optimization variables, K shortest paths are usually considered in practice. This paper uses the networkx package in python for path search. The main steps are as follows.
Step 1 Input the static topology information of the rail transit network and the capability parameters of stations and sections to determine Ci and Lk.
Step 2 According to the OD matrix and the rail transit network topology, the statistical indicators in graph theory are used to determine the risk factors ai and bk of stations and sections.
Step 3 Search for K shortest paths of each OD pair to get xijm.
Step 4 Express zi and yk as linear combinations of xijm according to the correspondence among
stations, sections, and paths.
Step 5 Represent the constraints and the objective function in CVX with zi and yk obtained by the
Case Study
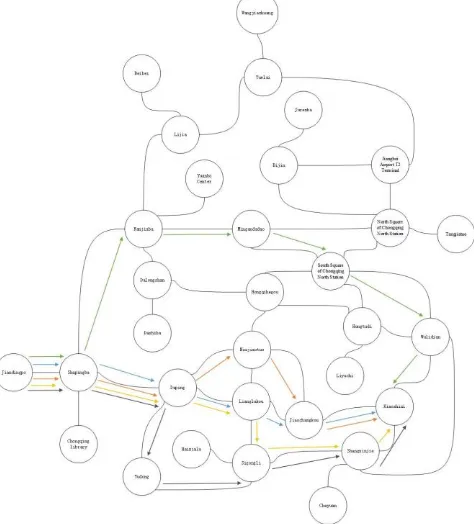
[image:4.595.208.372.156.357.2] [image:4.595.169.428.382.671.2]This paper takes the Chongqing rail transit network as an example. Figure 1 shows the information of Chongqing rail transit operation lines provided by Baidu Map. After combing ordinary stations and retaining departure stations, terminal stations, and transfer stations, the network topology is like Figure 2.
Figure 1. Chongqing Rail Transit Operation Lines[13].
Figure 2. Chongqing Rail Transit Network Topology.
different passing ability and train type lead to different line transport capabilities. Referring to the related information, the data of the Chongqing rail transit lines is shown in Table 1.
Table 1. Chongqing Rail Transit Line Data.
Line Train Type Train Capacity [passengers] Departure Interval [min]
Line 1 Subway B 1440 4
Line 2 Monorail 880 2.5
Line 3 Monorail 1320 3
Line 4 Subway As 2322 5
Line 5 Subway As 2322 8
Line 6 Subway B 1440 6
Line 10 Subway As 2322 8
Line loop Subway As 2322 6
Take line 1 as an example, its transport capacity is 1440* 60 4⁄ =21600passengers/h. This paper uses degree as the factor in calculating the risk function of stations and sections. Referring to the passenger traffic data published by the Chongqing Municipal Transportation Commission, the OD pairs considered in this paper are shown in Table 2.
Table 2. Chongqing Rail Transit OD Demand[14].
No Origin Destination Demand [ten thousand passengers/h]
1 JianDingpo Xiaoshizhi 4.17
2 Yudong Jiaochangkou 2.33
3 Yudong Chongqing North Station North Square of 4.50 4 Chongqing North Station North Square of Jiangbei Airport T2 Terminal 1.93
5 Chayuan BeiBei 3.53
6 Lijia Yuelai 0.1
7 Dashiba Yuanbo Center 0.24
8 Liyuchi Wangjiazhuang 0.57
[image:5.595.180.417.510.772.2]As can be seen from Figure 2, there are many loops inside the Chongqing rail transit network. In this paper, only K shortest paths are considered and K is set to be 5. The K shortest paths of the first OD pair are shown in Figure 3.
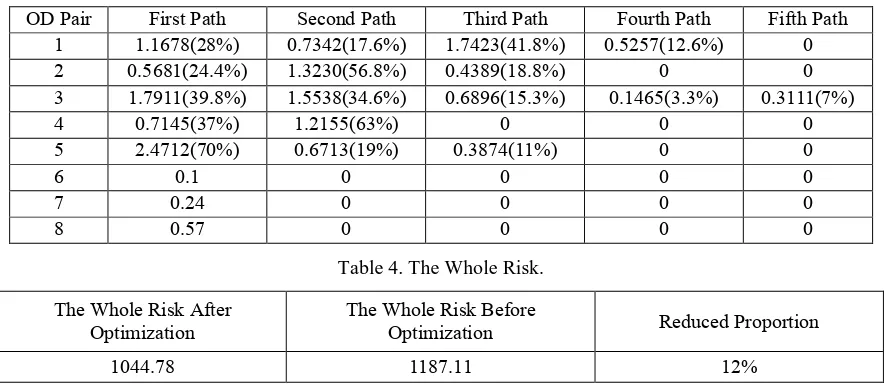
In real life, passengers prefer to choose the shortest path. The comparison between the optimal plan obtained through the above solution procedures and the passengers’ preference is shown in Table 3 and Table 4. After a reasonable distribution plan, the overall risk of the rail transit network is indeed reduced. Furthermore, it can be found that the optimal solution is not uniformly distributed. This is because the capability of each section is different and it is necessary to match the passenger flow demand with the transportation capacity. As for OD pair with small passenger flow demand, since the supply exceeds demand, the whole passenger flow demand can be assigned to the shortest path.
Table 3. The Optimal Passenger Flow Assignment Plan.
OD Pair First Path Second Path Third Path Fourth Path Fifth Path 1 1.1678(28%) 0.7342(17.6%) 1.7423(41.8%) 0.5257(12.6%) 0
2 0.5681(24.4%) 1.3230(56.8%) 0.4389(18.8%) 0 0
3 1.7911(39.8%) 1.5538(34.6%) 0.6896(15.3%) 0.1465(3.3%) 0.3111(7%)
4 0.7145(37%) 1.2155(63%) 0 0 0
5 2.4712(70%) 0.6713(19%) 0.3874(11%) 0 0
6 0.1 0 0 0 0
7 0.24 0 0 0 0
8 0.57 0 0 0 0
Table 4. The Whole Risk. The Whole Risk After
Optimization The Whole Risk Before Optimization Reduced Proportion
1044.78 1187.11 12%
Summary
Aiming at the safety evaluation and enhancement of urban rail transit network, this paper proposes to use the risk function to quantitatively evaluate the rail transit network safety and then distributes the passenger flow at the rail transit network level to reduce the risk.
In this paper, the matching degree between the operation state and the ability of stations and sections is taken as the input of the risk function. As different stations and sections are of different importance, network statistical indicators are used as weighting factors. By minimizing risk as the optimization goal and analyzing the constraints, it can be found that the optimization problem is convex. Therefore, the optimal network distribution scheme of the rail transit network can be easily obtained. Finally, an example analysis of Chongqing rail transit network is carried out to verify the effectiveness of the optimization algorithm.
The model presented in this paper does not consider the actual distance between stations. Thus, there may be a long path in the assignment plan. Future research should improve the objective function and constraints to make the solution more practical.
Acknowledgments
This work is supported by the National Key Research and Development Program of China under Grant 2017YFB1200700.
References
[1] Niu W, Wang X. Risk Evaluation of Railway Coal Transportation Network Based on Multi Level Grey Evaluation Model[C].IOP Conference Series: Earth and Environmental Science. IOP Publishing, 2018, 108(4): 042108.
[3] Xiao X M. Risk and Safety Assessment of Urban Rail Transit Networks Operation[D]. Beijing Jiaotong University, 2014.
[4] Pan H, Liu Z, Hu H. An Enhanced Dynamic User Optimal Passenger Flow Assignment Model for Metro Networks[J]. Discrete Dynamics in Nature and Society, 2017, 2017.
[5] Sun L, Lu Y, Jin J G, et al. An integrated Bayesian approach for passenger flow assignment in metro networks[J]. Transportation Research Part C: Emerging Technologies, 2015, 52: 116-131.
[6] Yao X, Han B, Yu D, et al. Simulation-based dynamic passenger flow assignment modelling for a schedule-based transit network[J]. Discrete Dynamics in Nature and Society, 2017, 2017.
[7] Zhao S,Shi F,Hu X L, et al. Passenger Flow Assignment Method for High-speed Railway Based on Ticket Strategies[J]. Journal of the China Railway Society, 2018,40(09):12-21.
[8] Li S, Dessouky M M, Yang L, et al. Joint optimal train regulation and passenger flow control strategy for high-frequency metro lines[J]. Transportation Research Part B: Methodological, 2017, 99: 113-137.
[9] Xu X, Liu J, Li H, et al. Capacity-oriented passenger flow control under uncertain demand: Algorithm development and real-world case study[J]. Transportation Research Part E: Logistics and Transportation Review, 2016, 87: 130-148.
[10] Wu Z Y. Research on The Theory of Passenger Flow Assignment and Control Technology in Urban Rail Transit Network[D]. Southwest Jiaotong University, 2018.
[11] Jiang Q W, Cai S, et al. Passenger Flow Control Decision-making Method of Urban Rail Transit Station[J].Systems Engineering,2017,35(09):94-102.
[12] Lu G Y, M S, et al. Integer Programming Model of Passenger Flow Assignment for Congested Urban Rail lines[J].Journal of Southwest Jiaotong University, 2017, 52(02):319-325.
[13] Information on https://map.baidu.com
![Figure 1. Chongqing Rail Transit Operation Lines[13].](https://thumb-us.123doks.com/thumbv2/123dok_us/247841.1024686/4.595.169.428.382.671/figure-chongqing-rail-transit-operation-lines.webp)