2019 International Conference on Applied Mathematics, Modeling, Simulation and Optimization (AMMSO 2019) ISBN: 978-1-60595-631-2
Application of DRASTIC Model for Vulnerability Assessing Land
Subsidence of Beijing New Airport Line
Qi-wu HUANG
1,2,*, Tian-zheng LIU
1,2and Cang-qin JIA
31Beijing MTR Construction Administration Corporation, Fengtai District, Beijing 100068, China
2
Beijing Key Laboratory of Fully Automatic Operation and Safety Monitoring for Urban Rail Transit, Fengtai District, Beijing 100068, China
3
School of Engineering and Technology, China University of Geosciences, Haidian District, Beijing 100083, China
*Corresponding author
Keywords: Land subsidence, DRASTIC, Model parameters, Beijing, New Airport Line.
Abstract. The article reports a study of the influence of regional land subsidence on the 41km long Beijing New Airport Line. The characteristics of the major compressive geological layers and their potential to settlement are discussed in the light of the past and continuing groundwater exploitation in the area. A DARATIC model for land subsidence quantification was developed and used to predict the differential settlements along the metro line axis. There is a significant difference in the settlement occurring in the north and south areas of the bridge, in part due to the variation in the Quaternary alluvial sediments. The case study highlights the importance of considering both site specific and regional subsidence conditions when designing large structures in such an area. A subsidence parameter is developed to represent the ground deformation gradient, and then used to depict areas where damage risk to urban infrastructure is higher due to fracture propagation. InSAR data was used to evaluate subsidence rates and gradients, integrating hydrogeological and geomechanical variables into a GIS environment. Results show that classic DRASTIC approaches may estimate land subsidence vulnerability in settings such as the one at hand. The integrated vulnerability map shows the high risk imposed on the southern part of the metro line due to the high potential of intensive uneven settlement. Hence, it is concluded that the DRASTIC parameter is a welcome contribution to develop reliable vulnerability assessments in the project.
Introduction
Land subsidence is an environmental geological phenomenon consisting in the slow surface elevation decrease under the effects of natural process and anthropogenic activities. Specifically, in urban areas, uneven settlements seriously cause damages to urban infrastructures and lead huge losses of national economy. Therefore, the continuous monitoring of land subsidence is critical for deeply understanding regional and local ground subsidence mechanism and providing remediation and contrasting measures as well as updated reference for urban construction.
large-scale buildings is remarkable on ground deformation. Further studies discovered that the subsidence rates have direct correlation with the age of building construction. But there’s few research focus on the relation between uneven settlement and building construction.
Due to the potential effects of land subsidence geo-hazards on metro lines in terms of human lives and economic losses, great efforts have been put forth to develop sustainable solutions for these hazards.
This paper presents an environmental risk assessment of regional land subsidence on the structure of Beijing New Airport Line using DRASTIC model. The Beijing New Airport Line was designed to have a service life at least 100 years, but the occurrence of land subsidence raised the question that such an environmental problem could pose a potential risk to the subway. In this article, the characteristics of the main compressive layer and the potential for subsidence of this layer at the subway site are discussed. An attempt is made to predict the possible land subsidence with different water levels using numerical modeling.
Geological and Hydrogeological Setting
The total length of the first phase of the Beijing New Airport Line is 41.36 km, including 23.65 km of tunnels and U-shaped grooves and 17.71 km of elevated and roadbed sections in Fig. 1. The line runs through Fengtai district and Daxing district with three stations from north to south: Caoqiao, Cigezhuang and the North Terminal Station. The line transfers at Caoqiao Station to Line 10, which is already in operation, and Line 19, which is currently under construction. The maximum speed of the Beijing New Airport Line is 160 kilometers per hour while the actual travel speed will be set at 110 kilometers per hour. It will take only 19 minutes from Caoqiao station to the new airport.
Caoqiao station
Cigezhuang station
Beijing New Airport
Banbidian Panggezhuang
Xihongmen Tugang
Xiaomafang
Beijing New Airport U-shape groove section Elevated and roadbed sections Tunnel section
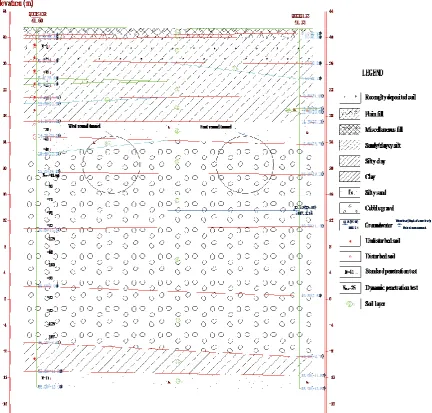
[image:2.595.179.426.394.702.2]All dimensions in millimeter Beizangcun Dingfuzhuang Tiantang River Yufa Lixian Anding Weishanzhuang Qingyundian Dalong River Beixintun NiantanReservior Lucheng Yinghaizhuang Yihezhuang Luquan Jiugong Nanyuan Dahongmen Shibalidian Fengtai District Yongding River Yongding River
Figure 1. Location and cumulative land subsidence from 1955 to 2014 of Beijing New Airport Line.
than 500 m. The Quaternary origin is alluvial-diluvial. The strata in the south (K2+250-K26+050) are mainly clayey soil, silt and sand interbedded deposits, with local conglomerate beds. The upper strata in the north (K26+050-K40+800) are mainly clayey soil, silt and sandy soil, while the lower strata are mainly sandy, pebble and clayey soil interbedded structures.
Figure 2. Schematic hydrogeological cross-section of the study area (All dimensions in meter).
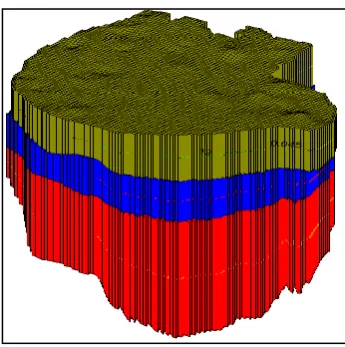
Figure 3. Modelling of land subsidence with Beijing New Airport Line project.
By the end of 2014, the total land subsidence over 1200 mm is 1.48 km, the mileage is K8+720-K10+200; the total land subsidence is 900-1200 mm, the length is 5.77 km, the mileage is K5+600-K8+720 and K10+200-K12+850; the total settlement is 500-900 mm, the length is 10.4 km, the mileage is K2+250-K5+600 and K12+850-K19+900; the total land subsidence is 100-500 mm. The length of the section is 12.7 km and the mileage is K19+900-K32+600; the length of the section with the accumulated settlement of 50-100 mm is 0.8 km and the length of the section with the accumulated settlement of less than 50 mm is K32+600-K33+400; and the length of the section with the accumulated settlement of less than 50 mm is 9.6 km. The mileage is K33 + 400 to the end of the project. The distribution of accumulated settlement along the line is shown in Fig. 1.
Methodology
In this study for mapping the vulnerability is used of the DRASTIC model and GIS. DRASTIC model is one of the tools created to protect groundwater that first introduced by [7]. It was based on the concept of the hydrogeological setting that is defined as “a composite description of all the major geological and hydrologic factors that affect and control the groundwater movement into, through and out of an area. The acronym DRASTIC stands for the seven parameters used in the model which are: Depth to water, net Recharge, Aquifer media, Soil media, Topography, Impact of vadose zone and hydraulic Conductivity. The model yields a numerical index that is derived from ratings and weights assigned to the seven model parameters. The significant media types or classes of each parameter represent the ranges, which are rated from 1 to 10 based on their relative effect on the aquifer vulnerability. The seven parameters are then assigned weights ranging from 1 to 5 reflecting their relative importance. The DRASTIC index is then computed applying a linear combination of all factors according to the following equation:
DRASTIC Index=DrDw+RrRw+ArAw+SrSw+TrTw+IrIw+CrCw (1) where D, R, A, S, T, I, and C are the seven parameters and the subscripts r and w are the corresponding rating and weights, respectively.
DRASTIC was originally developed for hydrogeological settings in the US, which is the reason why it sometimes needs to be adapted to other regions. Similarly, DRASTIC has been implemented as an extension of the classical DRASTIC approach. Its novelty resides in the definition of a specific land-deformation parameter, the subsidence gradient, which caters for the effects of subsidence on groundwater vulnerability. The underlying assumption is that aquifer vulnerability increases with higher differential subsidence rates because deformation tensile stress is an abrupt, irreversible and permanent process, which is likely to induce or propagate open cracks. Additionally, land deformation causes structural damage to infrastructures such as gas stations, wastewater pipelines and oil ducts, which also increases aquifer risk by favoring spills.
a modern, cost-effective and synoptic technology that allows for the evaluation of regional topographic changes in a wide variety of geological settings.
[image:5.595.159.437.165.409.2]The subsidence gradient was developed as a tool to evaluate faulting potential and its associated damage to the urban infrastructure in cities subject to strong subsidence. The concept of a subsidence gradient is analogous to that of hydraulic gradient that is commonly used in groundwater hydrology, but it involves subsidence rates instead of hydraulic heads. It is computed as the maximum slope between neighboring points.
Figure 4. The annual sedimentation ratio of Beijing Municipality by InSAR.
DRASTIC Parameters
This work focuses on the development of the DRASTIC model and the subsidence gradient component.
The risk of land subsidence along the project is mainly affected and controlled by several factors. Firstly, in the area with the fastest development of land subsidence, the higher the risk degree is, especially in the area where the slope rate of land subsidence changes greatly. Secondly, because land subsidence is closely related to the variation of groundwater level, the change trend of groundwater level in future will directly respond to it. Finally, the development of land subsidence is related to engineering geological conditions. Therefore, the risk zoning evaluation of land subsidence mainly considers four factors as the main factors of the evaluation: the slope change of land subsidence rate, the severity of land subsidence, the degree of groundwater level decline and engineering geological conditions. Hence, Table 1 summarizes the overall methodology employed to develop the DRASTIC parameters.
Table 1. Development and assigned weights of DRASTIC parameters.
Parameters Weights Land subsidence gradient (G) 8 Severity of land subsidence (S) 7 Groundwater (GW) 5 Geological condition (GC) 1
DRASTIC Index=8G+7S+5GW+GC (2)
Results and Discussion
Land Subsidence and Relative Vulnerability
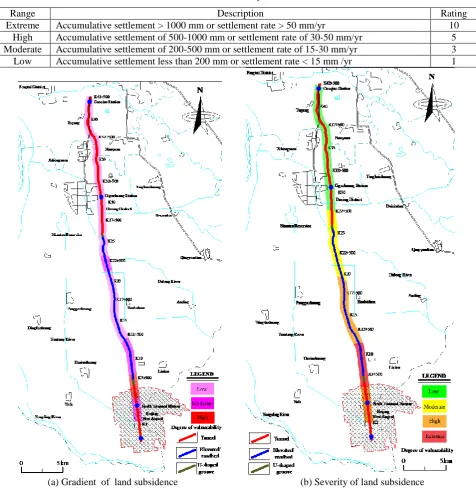
[image:6.595.61.538.276.766.2]The land subsidence gradient has a great influence on the safe operation of the first phase of the project, especially the slope change of land subsidence after the operation of the project. The slope of regional land subsidence rate in 2014 along the line is selected as the reference value, and the Phase I of the project is divided into three sections: large, medium and small gradient of land subsidence. The large slope of land subsidence is mainly located in the K5+300-K8+270 section (Fig. 1); the middle section of land subsidence rate is mainly located in the K2+250-K5+300, K8+270-K12+600 and K21+450-K23+200 sections; the northern section of K12+600-K21+450 and the first phase of the project is the section with relatively small slope change, as shown in Table 2 and Fig. 5.
Table 2. Subdivision on Severity of land subsidence.
Range Description Rating
Extreme Accumulative settlement > 1000 mm or settlement rate > 50 mm/yr 10 High Accumulative settlement of 500-1000 mm or settlement rate of 30-50 mm/yr 5 Moderate Accumulative settlement of 200-500 mm or settlement rate of 15-30 mm/yr 3 Low Accumulative settlement less than 200 mm or settlement rate < 15 mm /yr 1
Considering the current development rate of land subsidence and the situation of accumulated land subsidence, the area along the 3 km area on both sides of the first phase of the project is divided into serious affected area, more serious affected area, general affected area and weak affected area, as shown in Table 2. Among them, the area with serious impact of land subsidence is mainly the area with accumulated settlement greater than 1000 mm from 1955 to 2014; the area with serious impact of land subsidence is mainly the area with accumulated settlement of 500 to 1000 mm from 1955 to 2014; the area with general impact of land subsidence is the area with accumulated settlement of 200 to 500 mm from 1955 to 2014, and the area with weak impact of land subsidence is the area with accumulated settlement less than 200 mm from 1955 to 2014.
The zoning results show that the serious land subsidence areas along the project are mainly located in the K6+700-K11+900 mileage, the more serious areas are located in the K2+250-K6+700 and K11+900-K19+900 mileage, and the general area of land subsidence is located in the K19+900-K27+870 mileage, and the lighter area of land subsidence from K27+870 mileage to the end of the project.
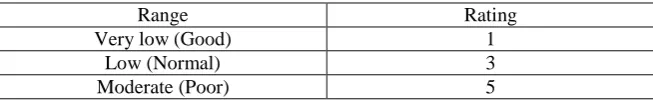
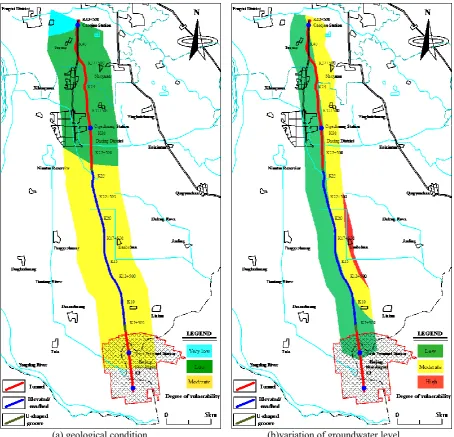
[image:7.595.134.461.369.419.2]Based on the comprehensive analysis of the engineering geological conditions of the area along the first phase of the project, the areas along the three kilometers are divided into areas with poor engineering geological conditions, areas with normal engineering geological conditions and areas with good engineering geological conditions. From the Table 3 and Fig. 6, the zoning maps show that the K2+500-K26+200 mileage sections are all areas with poor engineering geology. K26+200-K42+200 is the general area of engineering geology.
Table 3. Grade for geological conditions.
Range Rating
Very low (Good) 1
Low (Normal) 3
Moderate (Poor) 5
Subsidence Prediction under Different Groundwater Levels
During the repeated lifting and lowering of the groundwater level, the formation is in a state of repeated loading and unloading, and the land subsidence is mainly caused by the compaction of cohesive soil, and is characterized by continuous settlement. The analysis of land subsidence mechanism shows that the deep compression layer contributes a lot to the ground subsidence. Therefore, the water level change of the third aquifer is selected to evaluate the ground subsidence along the line.
[image:8.595.71.526.69.506.2]
(a) geological condition (b)variation of groundwater level Figure 6. Vulnerability map of geological condition and variation in the groundwater level.
Table 4. Grade for groundwater fluctuation of land subsidence.
Range Rating
High 5
Moderate 1
Low 0
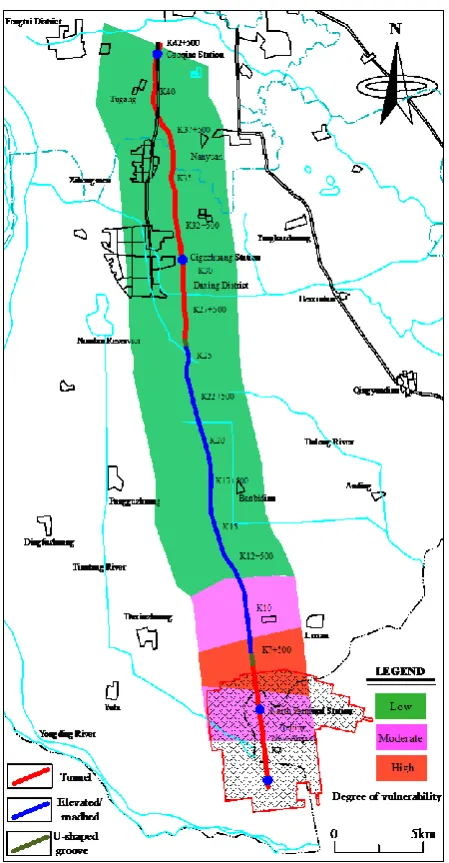
Figure 7. Integrated vulnerability map of Beijing New Airport Line combining several parameters with land subsidence.
The most dangerous area is located in the south of Daxing Yuyuan-Lixian subsidence center with the mileage of K5+300-K8+250. The land subsidence is more serious, the accumulated land subsidence reaches 900-1200 mm, and the annual average subsidence rate is between 30-40 mm. Overall, land subsidence is developing rapidly.
The middle risk area is mainly located in the mileage K2+250-K5+300 and K8+250-K11+900. The development of land subsidence in the K2+250-K5+300 area is relatively slow, and the water level of the third aquifer is rising, but the cumulative settlement is between 700-800 mm, and the slope caused by land subsidence changes greatly. The mileage is K8+250-K11+900, which is close to Daxing Yuyuan-Lixian subsidence center. Due to its influence, the water level of the third aquifer on the east side of the project decreases in varying degrees. The gradient of land subsidence is between 3-10×10-3, and the surface undulates greatly.
Hazardous residential areas are mainly located in the north of the Phase I, mainly in the K11 + 900 -K27 + 870 section, K27 + 870 - the end of the project. The K11+900-K27+870 area has always been areas with slow development of land subsidence and general engineering geological conditions. From K27+870 to the end of the project, the change of slope gradient is less than ±1‰, the annual average rate of land subsidence is less than 10 mm, and the accumulated settlement is less than 50 mm.
Conclusions
This report has presented the DRASTIC model, an extension to the standard DRASTIC approach for mapping groundwater vulnerability in urban aquifers subject to differential land subsidence effects. A subsidence gradient parameter was designed to represent ground deformation, which is useful to depict areas where subsidence may cause structural damage to urban infrastructures, thus favoring contaminant spillage and propagation along newly developed fractures. The DRASTIC model was tested in Beijing New Airport Line, where intense subsidence has been recorded for over sixty years (1955~2014). Form this study land subsidence plays a relatively important role in groundwater vulnerability, and that it should be taken into account in prospective studies. Therefore, the DRASTIC model is advocated as a valuable decision-making tool to underpin urban, environmental and water management strategies in Beijing.
References
[1] M. Gao, H. Gong, B. Chen, C. Zhou, K. Liu, and M. Shi, Mapping and characterization of land subsidence in Beijing Plain caused by groundwater pumping using the Small Baseline Subset (SBAS) InSAR technique, Proceedings of the International Association of Hydrological Sciences. 372(2015) 347-349.
[2] K. Lei, B. Chen, S. Jia, S. Wang, and Y. Luo, Primary investigation of formation and genetic mechanism of land subsidence based on PS-InSAR technology in Beijing, Spectroscopy and Spectral Analysis. 8(2014) 2185-2189.
[3] C. Zhou, H. Gong, B. Chen, J. Li, M. Gao, F. Zhu, W. Chen, and Y. Liang, InSAR Time-Series analysis of land subsidence under different land use types in the eastern Beijing plain, China, Remote Sensing. 9(2017)380.
[4] L. Zhu, H. Gong, X. Li, R. Wang, B. Chen, Z. Dai, and P. Teatini, Land subsidence due to groundwater withdrawal in the northern Beijing plain, China, Engineering Geology. 193(2015) 243-255.
[5] B. Chen, H. Gong, X. Li, K. Lei, L. Zhu, M. Gao, and C. Zhou, Characterization and causes of land subsidence in Beijing, China, International Journal of Remote Sensing. 38(3)(2017) 808-826.
[6] H. Antonio, R. J. Antonio, S. Emilio, C. Enrique, C. Jaime, M. Pedro, M. Sergio, F. Giacomo, and C. Davide, The DRASTIC-Sg model: an extension to the DRASTIC approach for mapping groundwater vulnerability in aquifers subject to differential land subsidence, with application to Mexico City, Hydrogeology Journal. 22(6) (2014) 1469-1485.