2018 2nd International Conference on Applied Mathematics, Modeling and Simulation (AMMS 2018) ISBN: 978-1-60595-580-3
Feasibility of Using NIR Spectroscopy with SVM to Identify
Kinds of Oil in Character Components
Qiang XU, Shuang WU and Xiao ZHENG
*School of Mechanical Engineering, Wuhan Polytechnic University *Corresponding author
Keywords: Edible oil, Characteristic component, Near infrared spectroscopy, Support vector machine classification.
Abstract. To identify the type of edible oil, we proposed a near-infrared (NIR) spectral analysis method based on the contents of four characteristic components: iodine value, palmitic acid, oleic acid, and linoleic acid. Built support vector machine qualitative models that can identify eight kinds of oil. The four characteristic component values of 129 oil samples from 8 kinds of oil were collected and detected. Established three SVC identification models by using three parameter optimization methods including genetic algorithm, grid search and particle swarm optimization. The results showed that the prediction sets’ accuracy rates of all the three models were up to 100%. Especially, both the accuracy rates of the correction and prediction sets of the particle-swarm-optimization-support-vector-machine classification (PSO-SVC) model reached 100%. The results indicate that it is effective and feasible to use the contents of characteristic components to identify the type of edible oil, and this method is fast, convenient, and accurate.
Introduction
Edible oil contains many valuable essential nutrients on daily diet, and it’s indispensible in daily life. Researches show that edible oil contain many characteristic components including saturated fatty acids, iodine value[1], palmitic acid, oleic acid, acid value, peroxide value. The contents of characteristic components in different types of edible oils are also variant. In addition, these characteristic components could determine the nutritional value and quality of edible oils. The increasing of people’s demand for the quality of edible oil causing the price rising, a lot of merchants even put low-value oils into high-quality edible oils to gain more benefits. Therefore, it is necessary to establish a method to fast identify the type of edible oils for the sake of consumers’ interests.
This study combines near infrared technology[2]with support vector machines and establish quantitative models of iodine value, palmitic acid, oleic acid and linoleic acid content in edible oil referring to the researches of Bo Peng[3], Bin Tu[3]and Shuang Wu[4].Then build qualitative model of iodine value, palmitic acid, oleic acid and linoleic acid content in edible oil on the basis of former quantitative models ,making accurate and fast identification of edible oil species come true.
Materials and Methods
Samples and Sample Sets
Table 1. Numbers of samples in the calibration and prediction sets.
Entry Type Calibrat
ion set
Prediction
set Subtotal Type Entry
Calibra tion set
Prediction
set Subtotal
1 tea seed oil 11 6 17 rice
oil 6 12 3 15
2 sunflower oil 13 2 15 corn
oil 7 11 4 15
3 soybean oil 12 7 19 olive
oil 8 11 2 13
4 rapeseed oil 14 2 16
Total 97 32 129
5 peanut oil 13 6 19
Instruments and Software
A custom-made laser near-infrared (NIR) vegetable-oil-quality detection instrument we applied in the tests. The central detector was applied in an Axsun XL410-type laser near-infrared spectrometer from the US, and it’s scanning range was roughly 1350–1800 nm. The light path was 2 mm in length and spectral resolution was 3.5 cm-1. The scanning performed 32 times. The spectral data I preprocessed by the MATLAB_R2013a software, and the models obtained were built and optimized with the Unscrambler X10.4 software.
Spectral Data Acquisition
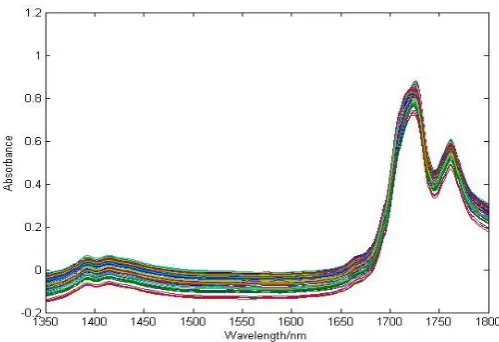
Firstly, heated the oil samples to 60°C with a thermostatic water bath. Then, moved a sample into a 2-mm special cuvette quickly, which was placed into a sample cell fastly at 60°C in the NIR detection instrument. After 1 minute, I could get spectral data of the sample. Each sample was withdrawn and detected three times. The average spectrum was derived for the establishment of the quantitative model. The original NIR spectra acquired are shown in Figure 1.
Figure 1. The original near-infrared spectra acquired.
Preprocessing and Wavelength Extraction of Spectral Data
[image:2.595.164.414.428.599.2]1 ) ( 1 2
m x x x x x m k k SNV (1) ( m x x m k k
1 , m is the number of wavelength points, k=1,2,3,...,m).
Modeling Method
Quantitative Model. Support vector machine[8-9]regression (SVR) is applied to establish quantitative model because it’s often used in quantitative prediction analysis. Studies have shown that error penalty factor C and radial basis function (RBF) kernel function[10-11]parameterg in SVM are the key factors affecting SVM performance(the transformed formula of SVM follows as(2)),Therefore, obtained a high prediction correlation coefficient regression model by selecting the optimal parameter combination (C, g)that is optimized using a grid search algorithm [12](CV).
. ,..., 2 , 1 1, ) ) ( ( y . . || || 2 1 min T 2 , m i b x t
s i i
b (2)
((xi)represents the mapped eigenvectors of x)
Qualitative Model. The qualitative model was built by support vector machine classification (SVC) method, Selected the optimal combination of parameters (C, g)and optimized them with genetic algorithm (GA), grid search (SG), particle swarm optimization (PSO) methods to get best model for prediction finally.
Results and Discussion
Prediction Performances of the Quantitative Models
The collected near-infrared spectral data was used as the input value of the SVR model to establish a quantitative prediction model for the iodine value, palmitic acid, oleic acid and linoleic acid content, set the correlation coefficient R and the root mean square error RMSE as evaluation standard to obtain the quantitative detection model parameter table shown in Table 2 and Table 3.
Table 2. Parameters of the NIR-SVR models for iodine value prediction[4].
Modeling method
Method for the extraction of characteristic wavelength Number of variables
Parameter Calibration set Prediction set
C g R RMSE R RMSE
SNV-SG-SVR Raw 451 1024 0.0156 92.7406 4.2625 96.8263 4.4679
DT- CARS-SG-SVR CARS 28 1024 16 92.5404 4.5010 97.4141 4.2471
MSC-SPA-SG-SVR SPA 12 1024 256 95.3879 3.4504 98.8761 2.7461
[image:3.595.50.546.537.651.2]MSC-iPLS[10]-SG-SVR iPLS 44 1024 4 93.8180 3.9511 97.6902 4.2010
Table 3. Parameters of the SVR models for the prediction of the contents of fatty acids[3].
Fatty acid Parameter Calibration set Prediction set
C g R MSE R MSE
palmitic acid 1 16 95.0876% 5.27304e-05 96.3034% 5.55093e-05
oleic acid 1 4 99.8592% 6.34736e-05 99.2265% 29.6267e-05
linoleic acid 1 4 98.5951% 48.5675e-05 99.2438% 30.2678e-05
Identification Performances of the Qualitative Models
[image:4.595.158.438.376.535.2]Using the established quantitative models of palmitic acid, oleic acid, linoleic acid, and iodine values, to predict the content of the four components of the predicted sample in the eight oil samples, and use this value as the prediction set of the qualitative model of the edible oil, and then use real content of the iodine value, palmitic acid, oleic acid, and linoleic acid in the calibration set as input values for the calibration set of the qualitative model in 129 samples, grid optimization, genetic algorithm, particle swarm and other methods were used to optimized the parameters of the classification model, establishing a quantitative-qualitative model based on the criteria of palmitic acid, oleic acid, linoleic acid and iodine value, and it’s parameters and test results as shown in Table 4.
Table 4. Parameters and qualitative prediction results.
Modeling method
Number of
variables Parameter Results of calibration set Results of prediction set
C g Accuracy/% (error/total) Accuracy/% (error/total)
GS-SVC 4 4 0.0078 98.9691(1/97) 100(0/32)
GA-SVC 4 25.78893 0.0010 97.9381(2/97) 100(0/32)
PSO-SVC 4 2.6581 0.01 100(0/97) 100(0/32)
Table 3 shows that the characteristic-value-based edible-oil identification technique is feasible and accurate. Among all the parameter optimization methods, the PSO-SVC method can achieve relatively good modeling and prediction results: No wrong prediction results were found among the 129 results. The two-dimensional parameter optimization diagram of PSO is shown in Figure 2.
Figure 2. Parameter optimization diagram of the PSO classification model.
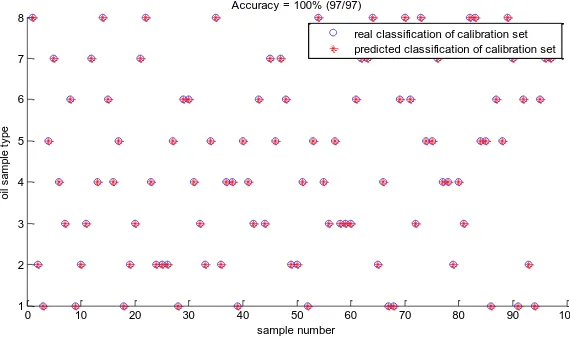
The contents of unsaturated fatty acids, palmitic acid, oleic acid and linoleic acid were selected as the input variables of the qualitative model. The PSO-SVC model was used to identify the types
Figure 3. Prediction results of the calibration set of PSO-SVC model.
0 10 20 30 40 50 60 70 80 90 100
20 30 40 50 60 70 80 90 100
number
re
co
g
n
it
io
n
r
a
te
Fit curve Accuracy[PSOmethod] Best c=2.6581 g=0.01 CVAccuracy=93.8144%
best fitness average fitness
0 10 20 30 40 50 60 70 80 90 100
1 2 3 4 5 6 7 8
sample number
o
il
s
a
m
p
le
t
y
p
e
real classification and predicted classification of calibration set Accuracy = 100% (97/97)
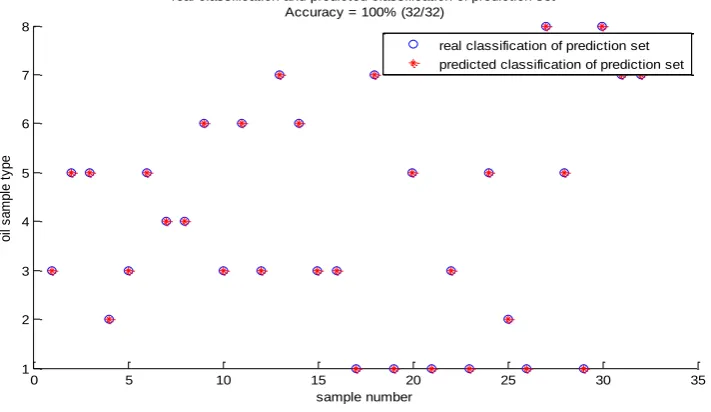
[image:4.595.155.440.595.764.2]Figure 4. Prediction results of the prediction set of PSO-SVC model.
of oil samples. The prediction results of calibration and prediction sets of the PSO-SVC model are shown in Figures 3 and 4, respectively. It can be found that: the three optimization methods were all reliable and all the prediction results are good, and the PSO-SVC model has a great generalization ability and good prediction performance.
Conclusions
According to the results of this study, the characteristic-value-based method for the identification of edible-oil type is viable. The established three SVC identification models have a prediction accuracy of 100%. And, only 1 or 2 errors took place in the calibration set. The accuracy of the prediction set of PSO-SVC model was also up to 100%, indicating that this method can successfully identify edible oils.
Acknowledgement
Innovation and Transformation of Grain Science and Technology of Hubei Province (20165104); Key Science and Technology Project of Wuhan City (2013010501010147).
References
[1] Qihui Xi, Wei Wu, Yanfang Lai, et al. Detection of oil saponification value based on infrared spectroscopy[J].Food Science and Technology, 2015, 40 (1): 319-321.
[2] Guangtong Xu, Hongfu Yuan, Wanzhen Lu. Development of Modern Near-Infrared Spectroscopic Techniques and Its Applications[J]. Spectroscopy and Spectral Analysis, 2000 (02): 134-142.
[3] Bo Peng. Near Infrared Spectroscopy to Predict Oil Fatty Acid Content and the Kind of Research to Identify Oil Species. AICS, 2016: 428-433.
[4] Shuang Wu. Quantitative determination of edible oil iodine value and saponification value for the identification of edible oil types[D]. Wuhan Polytechnic University, 2016.
[5] Yuan Ying, Wei Wang, Xuan Chu, et al. Selection of Characteristic wavelengths using SPA and qualitative discrimination of mildew degree of corn kernels based on SVM[J]. Spectroscopy and Spectral Analysis, 2016, 36 (1): 226-230.
[6] Jiangbo Li, Zhiming Guo, Wenqian Huang, et al. Near-Infrared Spectra Combining with CARS
0 5 10 15 20 25 30 35
1 2 3 4 5 6 7 8
sample number
o
il
s
a
m
p
le
t
y
p
e
real classification and predicted classification of prediction set Accuracy = 100% (32/32)
and SPA Algorithms to Screen the Variables and Samples for Quantitatively Determining the Soluble Solids Content in Strawberry. Spectroscopy and Spectral Analysis, 2015, 35 (2): 372-378.
[7] Haigen Peng, Yunfa Peng, Ying Zhan, Huaping Luo. Determination of the sugar content of jujube in south Xinjiang by near infrared spectroscopy combine with siPLS methods[J]. Food Science and Technology, 2014, 39 (06): 276-280.
[8] Tian Y J, Shi Y, Liu X H. Recent Advances on Support Vector Machines Research[J].Technological and Economic Development of Economy,2012, 18: 5-13.
[9] Guibin Li. Research on detecting Methods for Soybean oil Colour Based on SVM and Near-Infrared Spectrum Analysis[D]. Harbin University of Commerce, 2013.
[10] Suykens J K, Van Gestel T, Vandewalle J, De Moor B. A support vector machine formulation to PCA analysis and its kernel version.[J]. IEEE Transactions on Neural Networks, 2008, 14(2).
[11] Yangyang Chen. Research on Optimization method of Support Vector Machine Kernel Based on Multi-Scale Kernel Weighted-Fusion[D]. Electronic University of Science &Technology of Hangzhou, 2017.
![Table 3. Parameters of the SVR models for the prediction of the contents of fatty acids[3]](https://thumb-us.123doks.com/thumbv2/123dok_us/265347.1026739/3.595.50.546.537.651/table-parameters-svr-models-prediction-contents-fatty-acids.webp)