JOURNAL OFCLINICALMICROBIOLOGY, Sept. 2011, p. 3309–3315 Vol. 49, No. 9 0095-1137/11/$12.00 doi:10.1128/JCM.00602-11
Copyright © 2011, American Society for Microbiology. All Rights Reserved.
Development of a Second Version of the Cobas AmpliPrep/Cobas
TaqMan Hepatitis C Virus Quantitative Test with
Improved Genotype Inclusivity
䌤
Johannes Vermehren,
1Giuseppe Colucci,
2Peter Gohl,
3Nabila Hamdi,
4Ahmed Ihab Abdelaziz,
4Ursula Karey,
1Diana Thamke,
2Heike Zitzer,
2Stefan Zeuzem,
1and Christoph Sarrazin
1*
Medizinische Klinik 1, Klinikum der J. W. Goethe-Universita¨t, Frankfurt am Main, Germany1; Roche Molecular Diagnostics,
Ltd., Rotkreuz, Switzerland2; Bioscientia Institut fu¨r Medizinische Diagnostik, Ingelheim, Germany3; and
Department of Molecular Pathology, German University in Cairo, Cairo, Egypt4
Received 24 March 2011/Returned for modification 6 May 2011/Accepted 6 July 2011
Hepatitis C virus (HCV) RNA measurement has been facilitated by the introduction of real-time PCR-based assays with low limits of detection and broad dynamic ranges for quantification. In the present study, the performance of two second-version prototypes of the Cobas AmpliPrep/Cobas TaqMan HCV Quantitative Test (CAP/CTM v2) with decreased sample input volume and improved genotype inclusivity was investigated. A total of 232 serum and plasma samples derived from patients with chronic hepatitis C (genotype 1 [GT1],nⴝ108; GT2,nⴝ8; GT3,nⴝ24; GT4,nⴝ87; GT5,nⴝ3; and GT6,nⴝ2) were processed in parallel with the Cobas AmpliPrep/Cobas TaqMan HCV Test (CAP/CTM), Cobas Amplicor HCV Monitor Test v2.0 (CAM), and two second-version prototype formulations of CAP/CTM, Mastermix 1 (MMx1) and MMx2. In addition, three GT4 transcripts containing rare variant sequences were tested. The mean log10HCV RNA differences for the best-performing CAP/CTM v2/MMx2 formulation in
com-parison to CAM wereⴚ0.05, 0.05,ⴚ0.12,ⴚ0.10,ⴚ0.44, andⴚ0.29 for patients with GT1, GT2, GT3, GT4, GT5, and GT6 infections, respectively. GT1, GT2, and GT4 samples including isolates with known variants within the 5ⴕ untranslated region (G145A, A165T) that were underquantified with CAP/CTM were cor-rectly quantified with the second-version prototype. In addition, CAP/CTM v2 was able to accurately quantify the three transcripts with rare variant sequences. In conclusion, CAP/CTM v2 accurately quantifies HCV RNA across all HCV genotypes, including specimens with rare polymorphisms previously associated with underquantification.
Chronic hepatitis C affects up to 170 million people world-wide, and more than 350,000 people die from hepatitis C virus (HCV)-related liver diseases each year (23). However, with the current standard of care, a combination of pegylated interferon alfa plus ribavirin, HCV can be permanently eradicated in ca. 50% of patients (6, 11).
The study of HCV replication and of its kinetics during antiviral therapy with pegylated interferon and ribavirin has led to the identification of distinct response patterns that serve to individualize treatment durations. Response-guided therapy durations are recommended by national and international treatment guidelines (5, 15). However, these require the use of HCV RNA assays that allow for precise measurement and monitoring of viral kinetics. Real-time PCR has increasingly gained in importance for the detection and quantification of HCV RNA because of its higher sensitivity and broader dy-namic range compared to conventional, endpoint PCR (4, 19). Currently, there are two real-time PCR-based assays commer-cially available: the Cobas AmpliPrep/Cobas TaqMan HCV Test (CAP/CTM; Roche Molecular Systems, Pleasanton, CA)
and the Abbott RealTime HCV Test (Abbott Molecular, Des Plaines, IL).
The TaqMan-based CAP/CTM test has been successfully used in clinical practice and in drug development trials and has been approved by European and U.S. authorities for the monitoring of anti-HCV therapy. However, CAP/CTM has been reported to occasionally underquantify certain genotype 4 (GT4) samples, as well as isolates of other HCV genotypes that may include nucle-otide polymorphisms at the hybridization sites for the PCR prim-ers and/or TaqMan probe in the 5⬘untranslated region (5⬘UTR) of the HCV genome (1–3, 8, 10, 16, 17, 20, 22). This has prompted the development of an upgraded, second-generation assay that could provide an improved genotype inclusivity and workflow.
In the present study, we evaluated the genotype-specific per-formance of two formulations (Mastermix 1 [MMx1] and MMx2) of a second-version prototype of the Cobas AmpliPrep/Cobas TaqMan HCV Quantitative Test (CAP/CTM v2) in comparison to the already licensed CAP/CTM assay and the Cobas Amplicor HCV Monitor Test v2.0 (CAM; Roche Molecular Systems), the latter serving as our reference method.
MATERIALS AND METHODS
Clinical specimens and genotyping.A total of 232 leftover clinical specimens, 121 serum samples, and 111 EDTA plasma samples from patients with chronic HCV infection were obtained at the J. W. Goethe University Hospital, Frank-furt, Germany, the German University in Cairo, Cairo, Egypt, and the Biosci-entia Institut fu¨r Medizinische Diagnostik, Ingelheim, Germany. The ethics committee of the J. W. Goethe University Hospital approved the study. All * Corresponding author. Mailing address: Medizinische Klinik 1,
Klinikum der J. W. Goethe-Universita¨t, Theodor-Stern-Kai 7, 60590 Frankfurt am Main, Germany. Phone: 496 96301 5122. Fax: 496 96301 83112. E-mail: [email protected].
䌤Published ahead of print on 13 July 2011.
3309
on May 16, 2020 by guest
http://jcm.asm.org/
samples were frozen immediately at⫺40 to⫺80°C and shipped to the testing site in Frankfurt. A nonblinded operator performed all testing at the J. W. Goethe University Hospital.
Due to the large volume required for testing with multiple assays, all of the
[image:2.585.86.497.67.651.2]clinical specimens were diluted with pools of HCV RNA-negative human serum or EDTA plasma at a concentration of 1:12 prior to testing. HCV genotypes and subtypes of each sample were determined by sequencing of the 5⬘UTR region of the HCV genome.
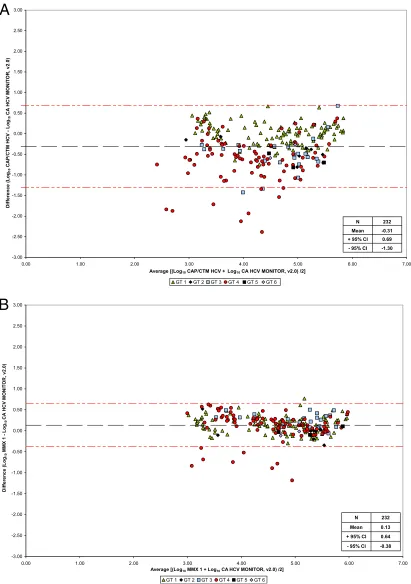
FIG. 1. Bland-Altman analysis of CAP/CTM versus CAM (A), prototype CAP/CTM v2/MMx1 versus CAM (B), and prototype CAP/CTM v2/MMx2 versus CAM (C).
on May 16, 2020 by guest
http://jcm.asm.org/
Technical system features.The Cobas AmpliPrep/Cobas TaqMan HCV Test (CAP/CTM; Roche Molecular Systems) is based on reverse transcription-PCR technology. The system combines automated sample extraction (required sample input volume, 1 ml) with automated amplification and detection on the Cobas TaqMan HCV instrument. Reverse transcription and amplification primers, as well as the TaqMan probe, are targeted to the highly conserved 5⬘UTR. The assay procedure has been described previously (16).
The second-version prototypes, MMx1 and MMx2, differ from the present assay by requiring a smaller sample input volume (0.65 ml instead of 1 ml). In addition, a redesigned primer set was used. Finally, in light of known underes-timation of HCV RNA levels, particularly in GT4 samples, a second TaqMan hydrolysis probe was introduced to the MMx2 prototype assay for better overall genotype coverage and the dedicated AmpliLink software was upgraded accord-ingly.
The Cobas Amplicor HCV Monitor Test v2.0 (CAM; Roche Molecular Sys-tems) is a semiautomated assay, with manual sample preparation and automated amplification and detection on the Cobas Amplicor analyzer. The procedure has been described previously (7).
In the present study, all testing procedures were performed at one testing site, according to the manufacturer’s instructions as described in the respective pack-age inserts.
Analytical assay performance.The limit of detection (LOD) of the prototype CAP/CTM v2/MMx2 assay was determined in serum and plasma using panels of the second WHO International Standard for HCV RNA (NIBSC code 96/798, 50,000 IU/vial). The standard was serially diluted to the following concentration levels: 30, 15, 7.5, 3, and 0 IU/ml.
High titer clinical specimens, including one serum and one plasma GT1 spec-imen (both with⬎106
IU/ml HCV RNA) and a high-titer GT1 armored HCV RNA control (3.08⫻1011IU/ml HCV RNA) were used to assess the lower limit
of quantification and linearity over the dynamic range. Serial dilutions to the following concentrations were produced for the clinical specimens to cover the expected range of the assay: 3.0⫻105
, 3.0⫻104
, 3.0⫻103
, 300, 30, 15, and 7.5 IU/ml HCV RNA. The armored HCV RNA sample was diluted to the following concentrations: 2.0⫻108
, 1.0⫻108
, 3.0⫻107
, 3.0⫻106
, and 3.0⫻104
IU/ml HCV RNA. Linearity was evaluated by polynomial regression analysis in accor-dance with the Clinical and Laboratory Standards Institute guideline EP6-A (21).
HCV genotype inclusivity.The agreement of CAP/CTM and CAP/CTM v2 with the reference assay CAM for the quantification of HCV RNA was assessed using clinical specimens harboring HCV genotypes 1 through 6. All titer values were log10transformed, and the mean log titer values of each
genotype were compared to the corresponding values obtained from the other tests.
Results were classified as moderately or severely under- or overquantified if they differed by 0.5 to 1.0 log10IU/ml HCV RNA or⬎1.0 log10IU under- or
over, respectively, compared to the reference assay. For sequence analyses, amplification of the HCV 5⬘noncoding region was performed by a nested reverse transcription-PCR to assess the frequency of mutations at positions A165, G145, and A142.
GT4 transcripts.Genotype inclusivity was also assessed using synthetic tran-scripts harboring rare GT4 variants. In brief, three trantran-scripts representing the complete 5⬘UTR of GT4 patient samples with known polymorphisms in com-parison with a GT1 sample were investigated. The transcripts, containing sub-stitutions A165T (transcript 1), A165T⫹G145A (transcript 2), and A165T⫹ G145A⫹A142G (transcript 3), were obtained from Trenzyme (Constance, Germany) and from Roche Molecular Diagnostics. The RNA concentration of all transcripts was determined using the RiboGreen RNA Assay (Invitro-gen, Carlsbad, CA). Readings were converted into copies/ml (cp/ml) and subsequently diluted in PCR-grade water to the desired concentrations. Ali-quots were stored at⫺15°C to⫺25°C. All samples were thawed and refrozen the same number of times. On the day of testing, the transcripts were spiked into the lysis buffer included in the respective kits at a concentration level of 10,000 cp/ml and tested with CAP/CTM and the two prototype formulations, MMx1 and MMx2. The samples were taken through the entire process on the CAP/CTM system, including sample preparation, amplification, and detec-tion.
Data analysis.Probit analysis was performed to determine the LOD of the prototype CAP/CTM v2/MMx2 assay. The LOD was determined as the 95% probability of obtaining a positive HCV RNA result. Bland-Altman plot analysis was performed to assess the agreement level between each assay for the quan-tification of HCV RNA. In addition, Deming regression analyses were per-formed.
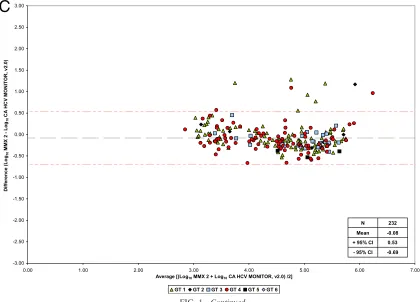
FIG. 1—Continued.
VOL. 49, 2011 COBAS AmpliPrep/COBAS TaqMan HCV QUANTITATIVE TEST 3311
on May 16, 2020 by guest
http://jcm.asm.org/
[image:3.585.82.502.71.373.2]RESULTS
Analytical performance.The LOD of the prototype CAP/ CTM v2/MMx2 was determined in five different concentration levels of the second WHO International Standard for HCV RNA. Analytical sensitivities of 13.6 and 12.8 IU/ml for serum and EDTA plasma, respectively, were calculated by probit analysis (95% hit rate). In addition, three replicates each of
high-titer specimens and cloned HCV RNA controls were used to determine a dynamic range from 15 IU/ml extending up to
1.0⫻ 108IU/ml for serum and EDTA plasma, respectively.
Standard deviations for these measurements varied from 0.46 to 0.05 log10IU/ml across the dynamic range.
[image:4.585.60.538.70.596.2]Genotype inclusivity. A total of 232 clinical samples were analyzed in parallel by CAP/CTM, the two prototype CAP/
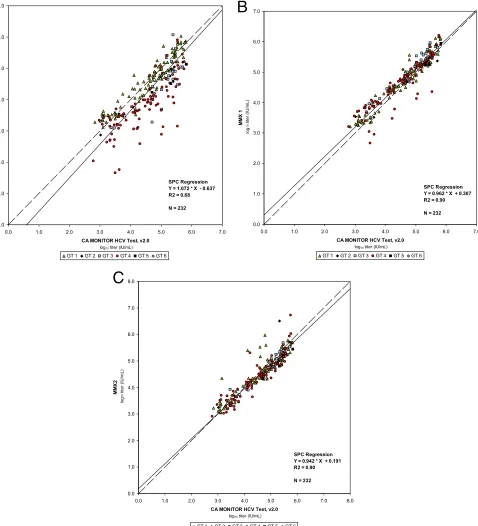
FIG. 2. Regression analysis of CAP/CTM versus CAM (A), prototype CAP/CTM v2/MMx1 versus CAM (B), and prototype CAP/CTM v2/MMx2 versus CAM (C).
on May 16, 2020 by guest
http://jcm.asm.org/
CTM v2/MMx1 and v2/MMx2 assays, and CAM. These spec-imens included 108 samples with HCV GT1 (mean viral load assessed with CAM, 4.59 log10IU of HCV RNA/ml; range, 690 to 650,000 IU/ml), 8 samples with HCV GT2 (mean, 4.91 log10
IU/ml; range, 1,000 to 510,000 IU/ml), 24 samples with HCV GT3 (mean, 4.93 log10IU/ml; range, 2,300 to 520,000 IU/ml),
87 samples with HCV GT4 (mean, 4.48 log10IU/ml; range, 610 to 660,000 IU/ml), and 3 and 2 samples with HCV GT5 (mean, 5.29 log10IU/ml; range, 51,000 to 680,000 IU/ml) and HCV GT6 (mean, 4.94 log10IU/ml; range, 61,000 to 120,000 IU/ml),
respectively.
Bland-Altman analysis showed that mean differences be-tween CAP/CTM, CAP/CTM v2/MMx1, CAP/CTM v2/MMx2, and the reference assay were ⫺0.31, 0.13, and ⫺0.08 log10
IU/ml HCV RNA, respectively (Fig. 1A to C). No differences between serum and plasma samples were observed. Deming regression analysis yieldedR2 regression coefficients of 0.68,
0.90, and 0.90 for CAP/CTM, CAP/CTM v2/MMx1, and CAP/ CTM v2/MMx2 versus CAM, respectively (Fig. 2A to C). Mean differences in log10IU/ml HCV RNA for individual genotypes
are shown in Table 1. When the prototype CAP/CTM v2/
MMx2 and CAP/CTM were directly compared, mean log10
differences of 0.23 and 0.53 IU/ml were determined for all genotypes and GT4 specimens, respectively.
In the present study, a reduction of moderately and severely under-quantified samples was observed with prototype CAP/
CTM v2/MMx1 (n⫽ 8) and prototype CAP/CTM v2/MMx2
(n⫽8) compared to the CAP/CTM test (n⫽73) (Table 2).
Assessment of HCV isolates with sequence mismatches.In 87 GT4 samples, sequencing of the HCV 5⬘noncoding region revealed one sequence with a G-to-A substitution at position 145 and 7 sequences that contained an A-to-T substitution at nucleotide 165. Overall, a mean underquantification of 1.8
log10IU/ml HCV RNA by CAP/CTM compared to CAM was
observed in these eight isolates. In contrast, the mean differ-ence between CAP/CTM v2/MMx2 and CAM for the same eight isolates was only⫺0.3 log10IU/ml. One sample with an A165T substitution was not quantifiable by CAP/CTM, whereas CAP/CTM v2/MMx2 yielded a quantifiable viral load (161 IU/ml).
Interestingly, the G145A substitution was also observed in two non-GT4 samples (one GT1 and one GT2 sample). Com-parable quantification of HCV RNA was observed in the GT1 sample. However, HCV RNA could not be detected by CAP/ CTM in the GT2 sample that also contained an A142G sub-stitution, whereas high levels of HCV RNA were detected with
the prototype CAP/CTM v2/MMx2 and CAM (5.1 and 4.6 log10IU/ml HCV RNA, respectively).
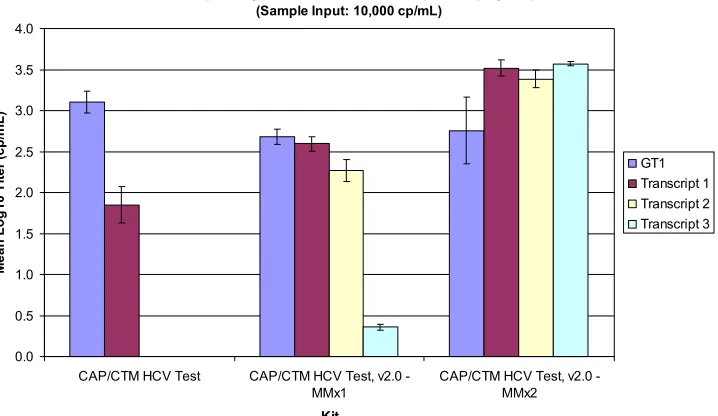
To further investigate the ability of the prototype CAP/CTM v2 assay to accurately quantify GT4 specimens harboring the described amino acid substitutions, three GT4 transcripts, as well as one GT1 transcript without mismatches, were tested in parallel by CAP/CTM and the prototype CAP/CTM v2/MMx1 and v2/MMx2 assays, respectively. The sample input was 10,000 cp/ml (4.0 log10 cp/ml) for all tested transcripts. Al-though quantification of the GT1 transcript was similar across the three assays, CAP/CTM could not detect two of three GT4 transcripts. In addition, the only GT4 transcript detected by CAP/CTM (transcript 1, containing the A165T substitution) was severely underquantified (⬎2 log10cp/ml). CAP/CTM v2/
MMx1 was readily able to detect all three GT4 transcripts. However, all three transcripts were severely underquantified, especially transcript 3 that contained three different amino
acid substitutions (A165T ⫹ G145A ⫹ A142G). Finally, all
[image:5.585.44.541.91.190.2]three GT4 transcripts were readily and properly quantified by
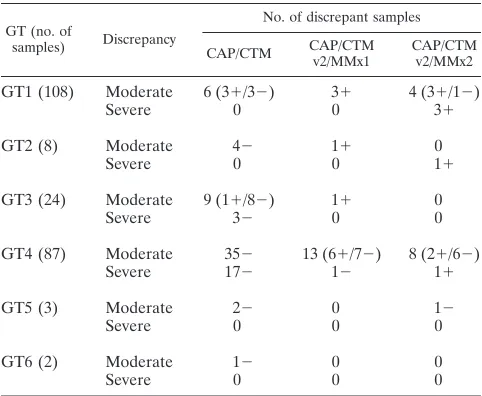
TABLE 1. Performance comparison of CAM, CAP/CTM, and the prototype CAP/CTM v2/MMx1 and v2/MMx2 assays for the determination of HCV RNA concentrations in patients infected with genotypes 1 to 6
GT No. of
samples
CAM (reference assay) CAP/CTM CAP/CTM v2/MMx1 CAP/CTM v2/MMx2
Mean IU/ml Mean log10
IU/ml Mean log10 Difference to CAM Mean log10 Difference to CAM Mean log10 Difference to CAM
GT1 108 3.9⫻104 4.59 4.60 0.01 4.73 0.14 4.54 –0.05
GT2 8 8.1⫻104 4.91 4.49 –0.42 4.89 –0.02 4.96 0.05
GT3 24 8.4⫻104 4.93 4.46 –0.47 5.18 0.25 4.81 –0.12
GT4 87 3.0⫻104 4.48 3.85 –0.63 4.59 0.11 4.38 –0.10
GT5 3 1.9⫻104 5.29 4.62 –0.67 5.28 –0.01 4.85 –0.44
GT6 2 8.6⫻104 4.94 4.51 –0.43 4.87 –0.07 4.65 –0.29
TABLE 2. Overestimation and underestimation of HCV RNA by CAP/CTM and the prototype CAP/CTM v2/MMx1 and
v2/MMx2 assays in comparison to CAMa
GT (no. of
samples) Discrepancy
No. of discrepant samples
CAP/CTM CAP/CTM v2/MMx1
CAP/CTM v2/MMx2
GT1 (108) Moderate 6 (3⫹/3⫺) 3⫹ 4 (3⫹/1⫺)
Severe 0 0 3⫹
GT2 (8) Moderate 4⫺ 1⫹ 0
Severe 0 0 1⫹
GT3 (24) Moderate 9 (1⫹/8⫺) 1⫹ 0
Severe 3⫺ 0 0
GT4 (87) Moderate 35⫺ 13 (6⫹/7⫺) 8 (2⫹/6⫺)
Severe 17⫺ 1⫺ 1⫹
GT5 (3) Moderate 2⫺ 0 1⫺
Severe 0 0 0
GT6 (2) Moderate 1⫺ 0 0
Severe 0 0 0
a
Discrepancies are classified as follows: moderate, titer value differences be-tween⫾0.5 log10and⫾1.0 log10IU/ml; severe, titer value differences⬎1.0 log10
IU/ml;⫹, overquantification compared to the reference assay.
VOL. 49, 2011 COBAS AmpliPrep/COBAS TaqMan HCV QUANTITATIVE TEST 3313
on May 16, 2020 by guest
http://jcm.asm.org/
[image:5.585.300.541.502.700.2]the prototype CAP/CTM v2/MMx2 assay, returning results close to the expected concentration of 4.0 log10cp/ml (Fig. 3).
DISCUSSION
HCV RNA viral load monitoring plays a key role in the management of response-guided therapy in patients with chronic hepatitis C (18). This calls for a sensitive and accurate HCV RNA assay that offers both a low limit of detection and linear quantification over a broad dynamic range.
The CAP/CTM assay is widely used in clinical research and practice, and it has been evaluated in a number of studies (2, 12, 14, 16, 17, 20, 22). Among these, several report underesti-mation of HCV RNA levels in up to 30% of GT4 specimens compared to competitor assays (2, 16, 17, 20, 22). Recently, the hypothesis was established that these findings were linked to the occurrence of GT4 specimens harboring amino acid sub-stitutions at positions 145 (G to A) and 165 (A to T) in the 5⬘UTR of the HCV genome (1, 3, 8, 10).
In the present study, we evaluated two formulations of a second-generation prototype real-time PCR-based assay, CAP/CTM v2/MMx1 and CAP/CTM v2/MMx2. Both formu-lations showed improved genotype inclusivity and tolerance for polymorphisms in GT4 isolates. While these polymorphisms are generally considered rare, a GenBank search revealed that the A substitution at position 145 was seen in 0.4%, and a T at position 165 was seen in 8.1% of patients with HCV GT4 (3). Indeed, within 87 HCV GT4 patient samples included in the
present study, sequence analyses of the 5⬘UTR revealed a
G-to-substitution at position 145 in one patient and an A-to-T substitution at position 165 in 7 patients. In line with previous findings on quantification of isolates with sequence
mismatches, a mean underquantification of almost 2 log10
IU/ml was observed in these patient isolates when measured with CAP/CTM. However, these discrepancies were overcome
when the prototype CAP/CTM v2/MMx2 assay was used (mean difference from the reference assay,⫺0.3 log10IU/ml; mean difference in all genotype four samples, ⫺0.10 log10
IU/ml). In addition, the improved prototype CAP/CTM v2/ MMx2 assay properly quantified synthetic HCV RNA tran-scripts corresponding to GT1 and GT4, the latter engineered to express amino acid substitutions at positions 145, 165, and 142 of the 5⬘UTR.
Furthermore, the study demonstrated the ability of the pro-totype CAP/CTM v2/MMx1 and v2/MMx2 formulations to de-tect and quantify HCV RNA in a large collection of clinical samples representing GT1 to GT6 with a robust and linear correlation to CAM that we used as the reference assay. Bland-Altman analysis showed that the improved assay confirmed the overall good performance of CAP/CTM for the quantification of samples with HCV GT1 to GT3 and GT5 and GT6 based on three and two samples, respectively, while significantly improv-ing GT4-specific performance. Since the best results for quan-tification of clinical specimens and GT4 transcripts were ob-tained with the MMx2-prototype, this formulation was selected for further development. A subsequent larger performance characteristics study is already under way.
[image:6.585.114.473.77.285.2]The prototype CAP/CTM v2/MMx2 assay includes re-engi-neered TaqMan hydrolysis probes that bind within the same 5⬘UTR target region. This should ensure coverage of current and future HCV sequence variants, an aspect that remains crucial for expanding clinical applications of viral load moni-toring in light of the changing face of anti-HCV therapeutic regimens in the years to come. Despite a general effort toward test harmonization and standardization, differences among as-says are not likely to be completely overcome, and it will still be recommended to use the same test when assessing viral kinet-ics for response guided therapy in a single patient (5, 9, 13, 15). In conclusion, our data indicate that a second-generation prototype of the CAP/CTM assay with MMx2 has improved
FIG. 3. Detection and quantification of one GT1 transcript and three GT4 transcripts by CAP/CTM and the prototype CAP/CTM v2/MMx1 and v2/MMx2 assays. GT4 transcripts 1, 2, and 3 contain the following amino acid substitution(s): transcript 1, A165T; transcript 2, A165T⫹ G145A; and transcript 3, A165T⫹G145A⫹A142G.
on May 16, 2020 by guest
http://jcm.asm.org/
genotype inclusivity, including GT4 samples that contain vari-ants previously shown to be not detected or underestimated by the current CAP/CTM version. The assay’s new formulation makes it better suited to detect evolving populations of HCV variants and may support the expanding applications of viral load monitoring in the clinical management of chronic hepa-titis C.
ACKNOWLEDGMENTS
G.C., D.T., and H.Z. are employees of Roche Molecular Diagnos-tics. P.G. received a research grant from Roche Molecular DiagnosDiagnos-tics. C.S. has been a consultant for and has received research grants from Roche Molecular Diagnostics. The remaining authors have no poten-tial conflicts of interest to declare.
This study was funded by Roche Molecular Diagnostics, Rotkreuz, Switzerland.
REFERENCES
1.Akhavan, S., C. Ronsin, S. Laperche, and V. Thibault.2011. Genotype 4 hepatitis C virus: beware of false-negative RNA detection. Hepatology53: 1066–1067.
2.Chevaliez, S., M. Bouvier-Alias, R. Brillet, and J. M. Pawlotsky.2007. Over-estimation and underOver-estimation of hepatitis C virus RNA levels in a widely used real-time PCR-based method. Hepatology46:22–31.
3.Chevaliez, S., M. Bouvier-Alias, L. Castera, and J. M. Pawlotsky.2009. The Cobas AmpliPrep-Cobas TaqMan real-time PCR assay fails to detect hep-atitis C virus RNA in highly viremic genotype 4 clinical samples. Hepatology 49:1397–1398.
4.Chevaliez, S., and J. M. Pawlotsky.2009. How to use virological tools for optimal management of chronic hepatitis C. Liver Int.29(Suppl. 1):9–14. 5.Craxi, A.2011. EASL clinical practice guidelines: management of hepatitis C
virus infection. J. Hepatol.55:245–264.
6.Fried, M. W., et al.2002. Peginterferon alfa-2a plus ribavirin for chronic hepatitis C virus infection. N. Engl. J. Med.347:975–982.
7.Gerken, G., et al.2000. Performance of the COBAS Amplicor HCV Monitor test, version 2.0, an automated reverse transcription-PCR quantitative sys-tem for hepatitis C virus load determination. J. Clin. Microbiol.38:2210– 2214.
8.Germer, J. J., C. E. Bommersbach, D. M. Schmidt, J. L. Bendel, and J. D. Yao. 2009. Quantification of genotype 4 hepatitis C virus RNA by the COBAS AmpliPrep/COBAS TaqMan hepatitis C virus test. Hepatology 50:1679–1680.
9.Ghany, M. G., D. B. Strader, D. L. Thomas, and L. B. Seeff.2009. Diagnosis, management, and treatment of hepatitis C: an update. Hepatology49:1335– 1374.
10.Halfon, P., M. Martinot-Peignoux, H. Khiri, and P. Marcellin.2010. Quan-tification of genotype 4 serum samples: impact of hepatitis C virus genetic variability. Hepatology52:401.
11.Manns, M. P., et al.2001. Peginterferon alfa-2b plus ribavirin compared with interferon alfa-2b plus ribavirin for initial treatment of chronic hepatitis C: a randomised trial. Lancet358:958–965.
12.Martinot-Peignoux, M., et al.2009. Clinical performances of two real-time PCR assays and bDNA/TMA to early monitor treatment outcome in patients with chronic hepatitis C. J. Clin. Virol.46:216–221.
13.McCaughan, G. W., et al.2007. Asian Pacific Association for the Study of the Liver consensus statements on the diagnosis, management and treatment of hepatitis C virus infection. J. Gastroenterol. Hepatol.22:615–633. 14.Pittaluga, F., et al.2008. Clinical evaluation of the COBAS AmpliPrep/
COBAS TaqMan for HCV RNA quantitation in comparison with the branched-DNA assay. J. Med. Virol.80:254–260.
15.Sarrazin, C., et al.2010. Prophylaxis, diagnosis and therapy of hepatitis C virus (HCV) infection: the German guidelines on the management of HCV infection. Z. Gastroenterol.48:289–351. (In German.)
16.Sarrazin, C., et al.2008. Evaluation of an automated, highly sensitive, real-time PCR-based assay (COBAS AmpliPrep/COBAS TaqMan) for quantifi-cation of HCV RNA. J. Clin. Virol.43:162–168.
17.Sarrazin, C., et al.2006. Comparison of conventional PCR with real-time PCR and branched DNA-based assays for hepatitis C virus RNA quantifi-cation and clinical significance for genotypes 1 to 5. J. Clin. Microbiol. 44:729–737.
18.Sarrazin, C., et al.2010. Definition of rapid virologic response with a highly sensitive real-time PCR-based HCV RNA assay in peginterferon alfa-2a plus ribavirin response-guided therapy. J. Hepatol.52:832–838.
19.Schutten, M.2008. Comparison of the Abbott RealTime HIV-1 and HCV viral load assays with commercial competitor assays. Expert Rev. Mol. Di-agn.8:369–377.
20.Sizmann, D., et al.2007. Fully automated quantification of hepatitis C virus (HCV) RNA in human plasma and human serum by the COBAS AmpliPrep/ COBAS TaqMan system. J. Clin. Virol.38:326–333.
21.Tholen, D. W., et al.2003. Evaluation of the linearity of quantitative mea-surement procedures: a statistical approach: approved guideline. CLSI, Wayne, PA. http://www.clsi.org/source/orders/free/ep6-a.pdf.
22.Vermehren, J., et al.2008. Differences between two real-time PCR-based hepatitis C virus (HCV) assays (RealTime HCV and Cobas AmpliPrep/ Cobas TaqMan) and one signal amplification assay (Versant HCV RNA 3.0) for RNA detection and quantification. J. Clin. Microbiol.46:3880–3891. 23.World Health Organization.2009. Viral hepatitis: Report by the Secretariat.
World Health Organization, Geneva, Switzerland. http://apps.who.int/gb /ebwha/pdf_files/EB126/B126_15-en.pdf.
VOL. 49, 2011 COBAS AmpliPrep/COBAS TaqMan HCV QUANTITATIVE TEST 3315