Quantitative Assessment of Commutability for Clinical Viral Load
Testing Using a Digital PCR-Based Reference Standard
L. Tang,aY. Sun,aD. Buelow,bZ. Gu,bA. M. Caliendo,cS. Pounds,aR. T. Haydenb
Departments of Biostatisticsaand Pathology,bSt. Jude Children’s Research Hospital, Memphis, Tennessee, USA; Department of Medicine, Alpert Medical School of Brown University, Providence, Rhode Island, USAc
Given recent advances in the development of quantitative standards, particularly WHO international standards, efforts to better understand the commutability of reference materials have been made. Existing approaches in evaluating commutability include prediction intervals and correspondence analysis; however, the results obtained from existing approaches may be ambiguous. We have developed a “deviation-from-ideal” (DFI) approach to evaluate commutability of standards and applied it to the assess-ment of Epstein-Bar virus (EBV) load testing in four quantitative PCR assays, treating digital PCR as a reference assay. We then discuss advantages and limitations of the DFI approach as well as experimental design to best evaluate the commutability of an assay in practice.
Q
uantification of viral load is integral to clinical care,particu-larly among immunocompromised patients (1–4). Increases
in viral load may trigger preemptive therapy to prevent or treat systemic viral disease. It may also be used to monitor therapeutic response and to determine treatment endpoints. A wide variety of assays are used for these determinations (few FDA approved), and the field continues to be hindered by a lack of agreement among
the results of these tests (5–8). In turn, this lack of agreement
(particularly between laboratories) prevents both the develop-ment of standardized therapeutic breakpoints and the portability of patient results among institutions. Numerous factors have been
shown to contribute to the variability of results (9), one of which is
a lack of standardized calibration standards. The availability of WHO international quantitative standards for cytomegalovirus (CMV) and, more recently, Epstein-Barr virus (EBV) should help the process of developing such standardization; however, numer-ous issues remain. These issues include the development of reli-able secondary standards, which are tracereli-able to and accurately representative of the WHO standard material. As has been shown for CMV secondary standards, such trueness cannot be assumed
(10).
Another issue of concern is the commutability of reference materials, which focuses on whether standards behave like patient samples and are consistent across different assays. Commutability has been defined as “the equivalence of the mathematical relation-ships among the results of different measurement procedures for a reference material and for representative samples of the type
in-tended to be measured” (11). First defined and accepted in the
field of clinical chemistry, more recent work in clinical molecular virology demonstrated its importance to interassay agreement, with commutable standards improving and noncommutable
standards diminishing quantitative agreement (12–15).
Cur-rently, commutability is typically assessed via prediction interval
approaches (14) or by multivariate techniques such as
correspon-dence analysis (16), both based on evaluating whether a reference
material belongs to the same distribution obtained from measures of human specimens using two or more assays. Prediction interval approaches are intuitive and simple to apply; however, they are often restricted to a two-assay setting. If there are more assays of interest, advanced multivariate techniques are often used. A
draw-back of the current approaches is that when a series of dilutions of a reference material is under examination, conclusions can be difficult to interpret. The “commutability” conclusion drawn from existing approaches is a relative concept, referring to the behavior of a reference material between two or more assays com-pared to that of human specimens. It cannot address whether a reference material is commutable to human specimens in a single assay of interest (AI). This can lead to differing determinations of commutability depending on which assays are included in a given evaluation. In addition, both prediction interval approaches and multivariate approaches do not take data variability into account; thus, a conclusion of commutability may be drawn only because the data are too variable. Furthermore, both primary methods in use today often produce only a “yes” or “no” determination of commutability, failing to make a straightforward connection be-tween interassay discrepancies in clinical values and commutabil-ity inference. Moreover, this limitation of existing approaches arises from the definition of commutability that does not reflect result accuracy, hindering direct comparisons of commutability results across assays.
Here, we seek to evaluate commutability by using traditional approaches that produce relative commutability between assays but also by producing absolute measures of commutability in a single assay by normalizing both patient and reference material results against the reference standard of digital PCR. The latter depends on the concept of limiting dilution, using large-scale
par-Received23 December 2015Returned for modification25 January 2016
Accepted5 April 2016
Accepted manuscript posted online13 April 2016
CitationTang L, Sun Y, Buelow D, Gu Z, Caliendo AM, Pounds S, Hayden RT. 2016. Quantitative assessment of commutability for clinical viral load testing using a digital PCR-based reference standard. J Clin Microbiol 54:1616 –1623.
doi:10.1128/JCM.03346-15.
Editor:A. J. McAdam
Address correspondence to R. T. Hayden, [email protected].
Supplemental material for this article may be found athttp://dx.doi.org/10.1128
/JCM.03346-15.
Copyright © 2016, American Society for Microbiology. All Rights Reserved.
on May 16, 2020 by guest
http://jcm.asm.org/
titioning of each master mix, followed by endpoint PCR. Quanti-tation is then determined by counting the number of positive nanoscale reactions and using Poisson statistics to produce a re-sult that no longer depends on relation to a standard curve. Digital PCR has increasingly been thought to represent a reference
stan-dard for quantitation, particularly of DNA viruses (17–19). In
addition to generating single-assay commutability determina-tions, we introduce a novel statistical term that directly relates the concept of commutability with clinical scales, asking whether de-gree of commutability is a useful concept in establishing clinical significance. This approach is presented together with methods that have been widely applied in evaluating commutability. All methods are applied here to four quantitative real-time EBV PCR assays using commercial secondary standard material and the WHO standard as proof-of-concept examples for this approach.
MATERIALS AND METHODS
Patient samples and quantitative standards.Reference materials utilized in the study included the EBV B95-8 WHO international standard (NIBC, Potters Barr, United Kingdom) and purified B95-8 virus stock (EBV type 1) inactivated cell extract (Advanced Biotechnologies [ABI], Columbia, MD). External positive-control material was prepared by using the AcroMetrix EBV plasma panel (Thermo Fisher Scientific, Inc., Waltham, MA). WHO standard material was reconstituted, according to the man-ufacturer’s recommendations, to a final concentration of 6.7 log10IU/ml,
with subsequent 10-fold serial dilutions in human whole blood (Biologi-cal Specialty Corporation, Colmar, PA) to concentrations of 5.7 to 1.7 log10IU/ml. Material from ABI was diluted in phosphate-buffered saline
(PBS) to⬃8 log10copies/ml and then further diluted in whole blood in
10-fold increments from⬃7 to 1 log10copies/ml. The 7-log10member of
the AcroMetrix panel was diluted in whole blood to produce high and low controls of 5 log10copies/ml and 3 log10copies/ml, respectively.
Clinical patient samples included for evaluation included frozen whole blood remaining from clinical testing performed at St. Jude Chil-dren’s Research Hospital (SJCRH) from November 2008 to February 2013. Subsequent to clinical testing, samples were aliquoted and frozen at ⫺80°C prior to use. A total of 194 samples were selected for inclusion, based on the results of routine clinical EBV load testing (using a labora-tory-developed test [LDT]). These samples were thawed and anonymized prior to nucleic acid extraction. Each sample was tested in duplicate by each PCR methodology (see below). This study was classified as “exempt” by the SJCRH Institutional Review Board (IRB), thereby allowing in-formed consent requirements to be waived.
Nucleic acid extraction of 200-l aliquots of all calibrators, controls, and patient samples was carried out on the QiaSymphony SP instrument (Qiagen, Valencia, CA) using the Qiagen QiaSymphony DNA minikit 200v6_Blood protocol, producing 200l of eluate in ATE buffer.
Quantitative testing by real-time and digital PCR.The reader is re-ferred elsewhere for details regarding PCR methodologies, together with comparisons of the performance characteristics of these methods (20). In
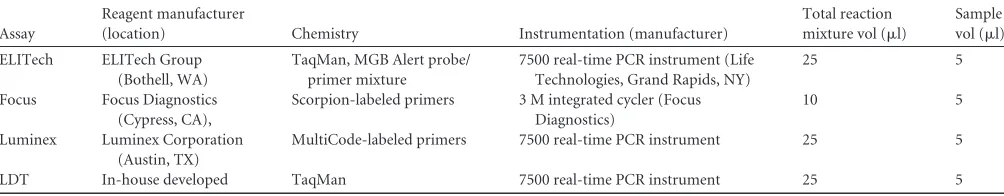
brief, four LDT methods were used here, three utilizing analyte-specific reagents (ASRs), produced by Luminex Corporation (Austin, TX), Focus Diagnostics (Cypress, CA), and ELITech Group (Bothell, WA), and the fourth using in-house-developed reagents. Information regarding instru-mentation, cycling parameters, and master mix composition is shown in
Table 1. Digital PCR (dPCR) was performed on a QX100 droplet dPCR (ddPCR) system (Bio-Rad, Hercules, CA) for ddPCR amplification, using reagents from the in-house-developed LDT. While it is ideal if the refer-ence assay (RA) is completely independent of the methods under evalua-tion, the same primers and probes were used for the digital PCR and for the LDT real-time PCR methods. This lack of independence is not desir-able but was tolerated for this teaching example.
Commutability assessment. (i) Prediction interval analysis.Simple linear regression (SLR) was applied to log10-transformed EBV load
mea-sures of patient samples between the Luminex, LDT, Focus, and ELITech methods with dPCR. Ninety percent, 95%, and 99% prediction intervals were then plotted. Measures of dilution series of reference materials were overlaid and checked for whether they all fell within the prediction inter-vals. Commutability of a reference material in an assay was concluded only if all measures of a reference material fell within the designated pre-diction interval.
(ii) Correspondence analysis.Technical details of correspondence analysis were reported previously (10,16). In short, log10-transformed
measures of patient samples using all assays of interest and reference ma-terials were considered active elements and projected onto a factorial plane, with the two axes representing the first two factors explaining most of the information in data. A 95% confidence eclipse was plotted. Mea-sures of reference materials were then treated as supplemental or inactive elements to avoid distortion of the pattern derived from clinical samples. Reference material was determined to be commutable if its measures all fell within the confidence region, indicating close proximity of the behav-ior of that reference material to patient samples.
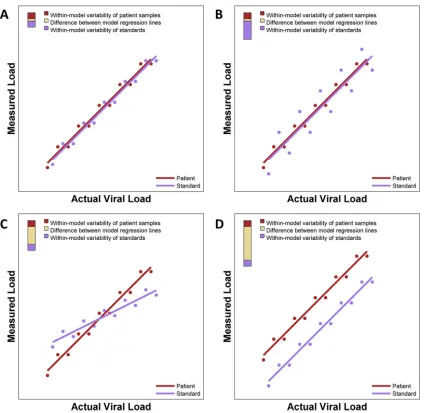
(iii) Deviation-from-ideal approach.For an ideal assay, the quanti-tative relationship between the actual and measured viral loads of quan-titative standards (often modeled by simple linear regression) is identical to that of patient samples, and both patient samples and standard samples should show minimal variability (Fig. 1A). We propose that commutabil-ity be quantitatively evaluated by computing a statistical metric of an assay’s deviation from the ideal (DFI), which is partitioned into compo-nents that are directly attributable to certain forms of deviation from the ideal.
There are several ways in which the actual performance of an assay may deviate from the ideal (Fig. 1BtoD), with similar quantitative rela-tionships but with one set of samples having much larger variability or even different regression relationships between actual and measured viral loads. It can be advantageous for DFI to capture specific forms of depar-ture. For example, in a setting like that shown inFig. 1B, the variability of the standards is the greatest contribution to the overall DFI. In such a setting, improvements in the processing of standards that reduce variabil-ity may greatly reduce the overall DFI.
DFI metrics are developed for studies that collect viral load
measure-TABLE 1Key assay characteristicsa
Assay
Reagent manufacturer
(location) Chemistry Instrumentation (manufacturer)
Total reaction mixture vol (l)
Sample vol (l)
ELITech ELITech Group
(Bothell, WA)
TaqMan, MGB Alert probe/ primer mixture
7500 real-time PCR instrument (Life Technologies, Grand Rapids, NY)
25 5
Focus Focus Diagnostics (Cypress, CA),
Scorpion-labeled primers 3 M integrated cycler (Focus Diagnostics)
10 5
Luminex Luminex Corporation (Austin, TX)
MultiCode-labeled primers 7500 real-time PCR instrument 25 5
LDT In-house developed TaqMan 7500 real-time PCR instrument 25 5
aSee reference20.
Quantitative Assessment of Commutability
on May 16, 2020 by guest
http://jcm.asm.org/
[image:2.585.41.543.78.176.2]ments for both patient samples and quantitative standards and with both the assay under evaluation (AUE) and an RA. The DFI metric is computed from the regression of AUE viral loads on RA viral loads for the patient samples and the regression of AUE viral loads on RA loads for the quan-titative standards. In the appendix, we mathematically define the DFI as a metric of the average deviation between the AUE measurements of a pa-tient sample and a quantitative standard that have the same actual viral load according to the RA. The interpretative implications of this defini-tion of DFI are elaborated below.
The DFI is partitioned into three distinct components: (i) precision of measurements for patient samples, (ii) precision of measurements for standards, and (iii) accuracy of standards as a representation of patient samples.
The DFI and the relative contributions of its three components may be reported numerically and graphically.Figure 1illustrates a graphical rep-resentation of the DFI and its three components with a tricolored bar in the top left corner of each panel. The height of the bar is the DFI, and the
proportions of the bar in red, violet, and gold represent the contributions of patient sample variability, standard sample variability, and difference between regression lines to the DFI, respectively. Thus, the short bar in
Fig. 1Aindicates that the DFI is small (suggesting very good performance of the AUE), and the very tall bar inFig. 1Dindicates that the DFI is large (suggesting poor performance of the AUE). The long violet segment of the bar shown inFig. 1Bindicates that most of the deviation from the ideal is attributable to variability of standards, and the long gold segments inFig. 1CandDindicate that most of the deviation from the ideal is attributable to differences between the regression line of patient samples and that of standard samples. The relative contributions of these three components to the DFI may provide some guidance to help determine which elements of a particular assay should be improved to enhance its performance. For instance, one may consider revising laboratory procedures for prepara-tion and processing of standards if 90% of the DFI is attributable to vari-ability among standard samples.
A major advantage of DFI is that it measures deviation from the ideal
FIG 1Idealized illustration of DFI plots showing differing types of assay performance. Each panel shows regression models of both patient samples and
standards. To the right of each regression model, a three-color bar graphically depicts contributions to the deviation from the ideal. The total height of the bar is the DFI. The proportions of the DFI attributable to within-model variability of patient samples, within-model variability of standards, and the difference between model regression lines are shown. (A) Nearly ideal case with almost identical regression lines that each have minimal variability, giving a small DFI. (B) Two nearly identical regression lines but with one line having extensive variability and the other having minimal variability. (C) Two very skewed regression lines. (D) Two parallel regression lines with distinct intercepts.
on May 16, 2020 by guest
http://jcm.asm.org/
[image:3.585.82.506.63.476.2]in the same units that the AUE measures viral load, which makes it pos-sible to perform meaningful comparisons of DFI values among a set of assays that measure viral load in the same units. Furthermore, with con-sensus among a range of stakeholders and the relationship between DFI and meaningful consensus, a “clinically acceptable threshold of variabil-ity” could be established. For example, one may consider cutoffs to inter-pret the DFI value as showing “good” (i.e., 0.0 to 0.40 log10copies/ml),
“intermediate” (i.e., 0.41 to 0.60 log10copies/ml), or “poor” (i.e.,⬎0.60
log10copies/ml) commutability.
By definition, the DFI is an absolute measure of deviation from the ideal only in settings in which the RA can legitimately be considered a “gold standard.” Otherwise, the DFI can be interpreted in the more lim-ited sense that it measures deviation relative to the particular assay.
For this study, we computed the DFI metrics of the LDT, Luminex, Focus, and ELITech methods using WHO material and ABI standards as assay systems under evaluation, with digital PCR as the reference assay.
All statistical analyses were performed on measures no lower than the lower limit of quantification of all assays, as reported previously (20), on 194 samples and with SAS 9.3 unless otherwise specified. The SAS macro and R function for generating DFI results are available as Files S1 and S2 in the supplemental material.
RESULTS
WHO standards.Results of the prediction interval analysis for WHO standards are shown in Fig. S1 in the supplemental mate-rial. This analysis fits a linear regression to the clinical samples for each pair of assay systems to determine prediction intervals. The results for the standards are then plotted to determine whether standards fall within these intervals. At least one standard value fell outside the 90% prediction intervals in the evaluations of the LDT and Luminex (see Fig. S1A in the supplemental material), LDT and Focus (see Fig. S1D in the supplemental material), Focus and ELITech (see Fig. S1E in the supplemental material), and LDT and ELITech (see Fig. S1F in the supplemental material) methods. All standards fell within the 90% prediction intervals in evalua-tions of the Focus and Luminex (see Fig. S1B in the supplemental material) and ELITech and Luminex (see Fig. S1C in the supple-mental material) methods. For some comparisons, the number of points falling within or outside the prediction intervals depends on the arbitrary selection of 90%, 95%, or 99% prediction inter-vals (see Fig. S1A, S1D, and S1E in the supplemental material). This analysis shows that the performance of the LDT differs from that of the other three assay systems. However, without a gold standard assay system, this analysis does not clearly indicate which, if any, of these assay systems is actually the best performer in terms of commutability.
Correspondence analysis results are shown in Fig. S2 in the supplemental material. One standard sample falls outside the 95% prediction ellipse, suggesting that the standard samples do not have a behavior similar to that of patient samples across all four assays.
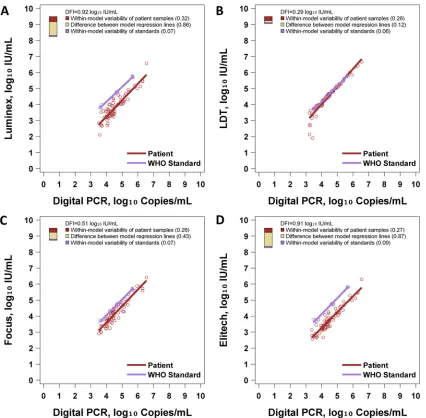
Figure 2andTable 2show the results of DFI analysis. The Luminex, LDT, Focus, and ELITech methods had DFI values of
0.92, 0.29, 0.51, and 0.91 log10IU/ml, respectively. Thus, in terms
of DFI, the LDT showed the best performance in this study, be-cause it performed well in each of the three components of DFI. With the LDT method, patient samples and standards had almost identical regression lines, patient samples showed little variability across most of the range, and standards showed little variability (Fig. 2B). Conversely, Luminex and ELITech had poor DFI due to large differences between the regression lines of patient samples
and standards (Fig. 2AandD). The Focus assay had an
interme-diate DFI of 0.51 log10IU/ml, attributable mostly to variability of
patient samples, with a moderate gap between the regression lines
of patient samples and standard samples (Fig. 2C). This analysis
also shows that the LDT differs from the other three assay systems: the LDT shows much better commutability than the other three systems. While the other three assay systems show a considerable shift between the regression lines of standards and patient sam-ples, these lines are almost identical for the LDT system. This is also observed in the numerical values for the deviation from the ideal due to a difference between the regression lines (0.12 for the LDT versus 0.43 for Focus, 0.86 for Luminex, and 0.87 for ELITech). The other components of DFI did not vary so dramat-ically across the four assay systems. The variability of standards ranged from 0.06 to 0.09 across assay systems, and the variability of patient samples ranged from 0.26 to 0.32 across assay systems.
ABI standards.Results of the prediction interval analysis for ABI standards are shown in Fig. S3 in the supplemental material. All standards fell within the 90% prediction intervals in the eval-uation of the LDT and Luminex (see Fig. S3A in the supplemental material) and in the evaluation of the LDT and Focus (see Fig. S3D in the supplemental material) methods. At least one standard fell outside the 90% prediction intervals for each of the other pairwise evaluations (see Fig. S3B, S3C, S3E, and S3F in the supplemental material). Again, the number of standards falling outside the pre-diction interval varied across pairwise evaluations and according to the arbitrary choice of using 90%, 95%, or 99% prediction intervals.
Correspondence analysis results are shown in Fig. S4 in the supplemental material. Overall, ABI standards behaved similarly to patients samples in the four assays under investigation when a 95% confidence region was applied as the threshold.
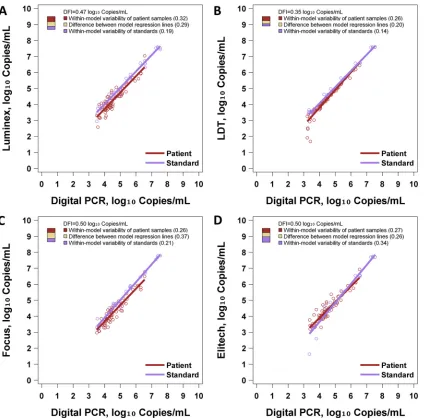
Figure 3and Table S1 in the supplemental material show the results of DFI analysis. The Luminex, LDT, Focus, and ELITech
methods had DFI values of 0.47, 0.35, 0.50, and 0.50 log10IU/ml,
respectively, when using the ABI standards. Notably, all assays
showed a DFI ofⱕ0.5 log10IU/ml. Comparatively, assay systems
including the ABI standards generally showed better commutabil-ity than did those using the WHO standards. Among the latter, the LDT-WHO assay system showed the best commutability by DFI. The LDT-ABI system showed the lowest DFI, and the ABI system showed a DFI of less than half a log unit with all four reagent sets. The partitioning of the DFI into its three sources is illuminating in this case. The four assay systems did not differ greatly in terms of variability of patient samples (range of 0.26 to 0.32). ELITech showed considerably greater variability of standards (0.34 versus 0.14 to 0.21 for others), and the LDT showed considerably less difference between the patient sample regression line and the stan-dard sample regression line (0.20 versus 0.26 to 0.37 for others).
DISCUSSION
Evaluation of commutability with any given quantitative stan-dards can be viewed as fundamental to the performance of viral load assays. Commutability may directly affect quantitative accu-racy and comparability of results among assays and therefore may be a determinant of clinical utility. Much of the literature has discussed commutability as a property of standards. While it is certainly true that properties and processing of standards may profoundly impact commutability, it is also important to recog-nize that commutability is a property of an entire assay system. All procedures and materials of an assay impact the data that should
Quantitative Assessment of Commutability
on May 16, 2020 by guest
http://jcm.asm.org/
be ultimately evaluated statistically. Many studies that formally evaluate commutability are not designed to isolate the contribu-tions of particular components of an assay due to the excessive cost and effort required. Thus, the conclusions of a statistical eval-uation of commutability apply to an entire assay procedure and not just the standards themselves.
Currently, linear regression prediction intervals and
corre-spondence analysis prediction ellipses are two statistical methods that are commonly used to evaluate commutability in the litera-ture. These methods have provided useful insights regarding the commutability of several assays. However, the results of these methods should be interpreted with caution due to a number of technical considerations involving variability and sample size. The sizes of prediction intervals and ellipses increase with variability of
FIG 2DFI assessment of WHO EBV standards. Each panel illustrates regression models for patient samples and standards. Digital PCR is regarded as the
[image:5.585.82.508.64.482.2]reference standard assay. To the right of each regression model, a three-color bar graphically depicts the DFI. The total height of the bar is the DFI. The proportions of the DFI attributable to within-model variability of patient samples, within-model variability of standards, and differences between model regression lines are shown. (A) Performance of the WHO standard with Luminex. (B) Performance of the WHO standard with the LDT. (C) Performance of the WHO standard with Focus. (D) Performance of the WHO standard with ELITech.
TABLE 2DFI commutability assessment of the WHO standard
Assay
Root variability of patient sample regression line (log10IU/ml) (%)
Root variability of WHO material regression line (log10IU/ml) (%)
Avg difference between 2 regression
lines (log10IU/ml) (%) DFI (log10IU/ml)
ELITech 0.27 (9) 0.09 (1) 0.87 (90) 0.91
Focus 0.26 (27) 0.07 (2) 0.43 (71) 0.51
LDT 0.26 (79) 0.06 (5) 0.12 (16) 0.29
Luminex 0.32 (12) 0.07 (1) 0.86 (87) 0.92
on May 16, 2020 by guest
http://jcm.asm.org/
[image:5.585.41.545.657.723.2]the data. Conceptually, it is possible that an assay may produce extremely noisy viral load measurements for patient samples so that the prediction intervals or ellipses are very large. In such a setting, it is essentially guaranteed that the standard samples will fall within the 95% prediction bounds. In such a setting, this ob-servation is not scientifically meaningful. Also, sample size must be considered when interpreting the number of points that fall within or outside prediction bounds. If a large number of data points are collected, then by definition, 5% of such points are expected to fall outside the prediction bounds when statistical modeling assumptions are satisfied. Therefore, simply counting the number of data points falling outside linear regression predic-tion intervals or correspondence analysis predicpredic-tion ellipses does not always yield a scientifically, practically, or statistically mean-ingful interpretation. Finally, as seen in our analysis of the WHO
samples, pairwise comparison of two assay systems with predic-tion intervals can show only that the assay systems perform differ-ently but does not indicate whether either is truly commutable.
Here, we provide a formal statistical definition of the DFI and describe how to compute it. The DFI is developed for studies that collect viral load measures for both patient samples and standards from an assay under evaluation and a reference assay. The DFI is a function of the data values and the results of linear regression of AUE viral loads on RA viral loads for patient samples and for standards. The DFI reports deviation of the viral load measure-ments of the assay under evaluation from the ideal performance and measures deviation from the ideal in the units of the assay under evaluation. This greatly facilitates the interpretation and practical utility of the DFI. This property makes it easier to char-acterize the relationship between DFI and other metrics of
accu-FIG 3DFI assessment of ABI EBV standards. Each panel illustrates regression models for patient samples and standards. Digital PCR is regarded as the reference
assay. To the right of each regression model, a three-color bar graphically depicts the DFI. The total height of the bar is the DFI. The proportions of the DFI attributable to within-model variability of patient samples, within-model variability of standards, and the difference between model regression lines are shown. (A) Performance of ABI standards with Luminex. (B) Performance of ABI standards with the LDT. (C) Performance of ABI standards with Focus. (D) Performance of ABI standards with ELITech.
Quantitative Assessment of Commutability
on May 16, 2020 by guest
http://jcm.asm.org/
[image:6.585.84.508.64.482.2]racy and agreement to guide the subsequent development of guidelines regarding clinically acceptable limits for the DFI. Also, the DFI can be partitioned into relative contributions from three distinct sources: precision of measurements for patient samples, precision of measurements for standards, and accuracy of stan-dards as a representation of patient samples. In some cases, this partition may help focus attention on improving specific elements of an assay to improve its performance.
Clearly, the appropriate interpretation of DFI is determined largely by the reliability of the reference assay. This may be con-sidered a limitation of DFI. All three of the presented methods implicitly have the limitation that at least two assays must be used to obtain statistical results. For linear regression prediction
inter-vals, the assay used to obtain data for the “x” axis could be
implic-itly used as a reference assay, although the usage of a reference assay in this approach was barely touched upon in the literature. Also, from a technical perspective, correspondence analysis eval-uates the agreement of a set of assays. As such, the assays that are most influential in defining the prediction ellipse in a particular data set are implicitly serving as references. Thus, we feel that it is appropriate to explicitly state that evaluation of commutability is uniformly subject to the intrinsic limitation that some assay is essentially serving as a reference, and the reliability of the final result depends on the reliability of the reference assay. Likewise, it is ideal if the reference assay is completely independent of the methods under evaluation. In the work presented here, the same primers and probes were used for the digital PCR and for the LDT real-time PCR methods, which is a major limitation of this study. This likely was an important factor in the lower DFI value of the LDT assay.
The apparent advantage of the LDT in commutability was more marked when using the WHO standard, where the DFI us-ing the other three assay systems was more clearly elevated. When
using the ABI standard, all DFIs were within a range of 0.15 log10
copies/ml. Examination of the DFI regressions showed little dif-ference among the four assay systems, suggesting that commut-ability would not significantly impact interassay agreement. The reason for the differing commutability between the WHO and ABI material is uncertain. Previous work has shown limitations in
commutability utilizing WHO standards (21). Here, both
stan-dards were whole-virus preparations, but one still showed behav-ior more like clinical samples. However, in the absence of DFIs for all of the assays in the previous study, the results here are not directly comparable. Numerous factors can affect viral load accu-racy, and it is likely that any of these factors can also affect com-mutability, reflected by a change in any or all components of the DFI. Possibilities might include differing sample matrices or dif-ferences in virus strains used for each standard.
Work here highlights the limitations of methodologies that do not evaluate commutability based on a reference assay (here dig-ital PCR). The analyses performed using only regression predic-tion intervals and correspondence analysis can show only that assay systems differ from one another but cannot indicate which is best. In some cases, the apparent outlier assay by such methods may in fact show the best commutability compared to a reference standard assay. This is seen in the present study, where the LDT would be called least commutable by prediction intervals and cor-respondence analysis but turns out to be the most commutable compared to a reference assay using DFI.
Like existing approaches based on regressions, there are several
other limitations of the DFI approach. If the underlying mathe-matical relationship is not linear, or if the relationship does not have constant variability, any approach based on simple linear regression is questionable. Furthermore, investigation can be per-formed only within the quantitative patient sample range. Finally, all approaches require a well-established commutability accep-tance criterion, which is largely missing in the field. Potential rem-edies to the violation of linear regression assumptions could take
advantage of weighted Deming regression (22) or nonparametric
regressions (23). Commutability acceptance criteria may depend
on the intent of the investigator, but when used to determine impact on interassay system agreement, one approach would be to develop an agreement statistic (data not shown) using principles introduced in this work. Empirically, an achievable upper bound for acceptable DFI might be set, based on the data presented above.
The DFI statistic measures how closely the behavior of the standard material resembles that of human specimens. To estab-lish an acceptable limit of agreement using the DFI, one can com-bine the knowledge of the uncertainty budget and the clinical
deviation allowance (24). However, in practice, it is always
opti-mal to assess commutability or agreement of an assay(s) using DFI together with descriptive plots, as presented in this study. DFI describes the average deviation from the ideal defined above; thus, the magnitude of the DFI alone may hide the fact that standard material samples behave differently from human specimens. For
example, inFig. 1C, the two regression lines clearly cross, and it
would be questionable to conclude commutability, while the overall DFI value could still be small, since in the middle range, the deviation is close to zero. In this case, the plot will clearly comple-ment the numerical inference. Thus, we recommend that a com-plete analysis of commutability include the generation and visu-alization of regression plots to complement the computation of the DFI statistic and its three components.
Although commutability is not a new concept, more in-depth work is needed to reliably assess the performance of standard ma-terials together with various assays and to set clinically meaningful thresholds for acceptable commutability. Our proposal could be regarded as a first exploratory step toward this goal. Work is under way to develop formal statistical metrics for the evaluation of DFI in two or more assays, allowing DFI-based prediction of interassay result comparability, and to assess how the choices of DFI com-ponent weighting would impact the result. The latter will help to understand the performance of the DFI metric if, in practice, one component is of most interest. Another future extension of the current DFI approach includes the generalization of the definition when Deming regression (weighted or unweighted) is applied.
APPENDIX
Here, we describe the calculation of the deviation-from-ideal (DFI) met-ric. Suppose we have obtained measurements fori⫽1,. . .,npatient sam-ples andj⫽1,. . .,mreference material samples from both the reference assay (RA) and the assay of interest (AI). For thei⫽1,. . .,npatient sam-ples, letxiandyirepresent the measurements obtained from the RA and AI, respectively. For thej⫽1,. . .,mreference material samples, letujand wjrepresent the measurements obtained from the RA and AI, respectively. A simple linear regression is fitted on the patient measurements (xiand yi) to obtain the estimated liney⫽ 0⫹ 1x, and a simple linear
regression is fitted on the reference material measurements (ujandwj) to obtain the estimated line w⫽ ␥0⫹ ␥1u. Using these estimated lines,
we computeyˆ1⫽ ˆ0⫹ ˆixifor each patient samplei⫽1,. . .,nand
on May 16, 2020 by guest
http://jcm.asm.org/
w
ˆj⫽ ␥ˆ0⫹ ␥ˆ1uifor each reference material samplej⫽1,. . .,m. Here, the notation ^ represents estimates from a fitted linear regression. Now, the mean square error of the patient samples (MSPS) is defined
asMSPS⫽1
n
兺
in⫽1共Yˆi⫺Yi兲2, the mean square error of the reference samples (MSRS) is defined asMSRS⫽ 1m
兺
j⫽1m 共Wˆ
j⫺Wj兲2, and the mean square difference between the lines (MSBL) is defined as
MSBL⫽ 1
n
兺
in⫽1共ˆYi ⫺Wˆi兲2. MSPS is a metric of the precision of patient sample measurements, MSRS is a metric of the precision of the reference material measurements, and MSBL is a metric of the accu-racy of the standards as a representation of the patient samples. The total value of MSPS⫹MSRS⫹MSBL is a metric of deviation from the ideal scenario in which the regression lines for patient samples and reference material are identical and both sets of samples show no de-viation from that line. The proportional contributions of these three terms to the total can also be reported. Finally, the DFI statistic is the square root of the sum of these three components.ACKNOWLEDGMENTS
We have no conflicts to report.
This work was supported in part by the ALSAC.
REFERENCES
1.Stevens SJ, Verschuuren EA, Verkuujlen SA, Van Den Brule AJ, Meijer
CJ, Middeldorp JM.2002. Role of Epstein-Barr virus DNA load
moni-toring in prevention and early detection of post-transplant lymphoprolif-erative disease. Leuk Lymphoma43:831– 840.http://dx.doi.org/10.1080 /10428190290016971.
2.Viscount HB, Eid AJ, Espy MJ, Griffin MD, Thomsen KM, Harmsen
WS, Razonable RR, Smith TF.2007. Polyomavirus polymerase chain
reaction as a surrogate marker of polyomavirus-associated nephropathy. Transplantation 84:340 –345. http://dx.doi.org/10.1097/01.tp.0000275 205.41078.51.
3.Heim A, Ebnet C, Harste G, Pring-Akerblom P.2003. Rapid and
quan-titative detection of human adenovirus DNA by real-time PCR. J Med Virol70:228 –239.http://dx.doi.org/10.1002/jmv.10382.
4.Ljungman P.2010. Molecular monitoring of viral infections after
hema-topoietic stem cell transplantation. Int J Hematol91:596 – 601.http://dx .doi.org/10.1007/s12185-010-0570-4.
5.Hayden RT, Hokanson KM, Pounds SB, Bankowski MJ, Belzer SW,
Carr J, Diorio D, Forman MS, Joshi Y, Hillyard D, Hodinka RL, Nikiforova MN, Romain CA, Stevenson J, Valsamakis A, Balfour HH,
Jr, US EBV Working Group.2008. Multicenter comparison of different
real-time PCR assays for quantitative detection of Epstein-Barr virus. J Clin Microbiol46:157–163.http://dx.doi.org/10.1128/JCM.01252-07.
6.Hirsch HH, Lautenschlager I, Pinsky BA, Cardenoso L, Aslam S, Cobb
B, Vilchez RA, Valsamakis A.2013. An international multicenter
perfor-mance analysis of cytomegalovirus load tests. Clin Infect Dis56:367–373.
http://dx.doi.org/10.1093/cid/cis900.
7.Hoffman NG, Cook L, Atienza EE, Limaye AP, Jerome KR. 2008.
Marked variability of BK virus load measurement using quantitative real-time PCR among commonly used assays. J Clin Microbiol46:2671–2680.
http://dx.doi.org/10.1128/JCM.00258-08.
8.Pang XL, Fox JD, Fenton JM, Miller GG, Caliendo AM, Preiksaitis JK.
2009. Interlaboratory comparison of cytomegalovirus viral load assays. Am J Transplant9:258 –268.http://dx.doi.org/10.1111/j.1600-6143.2008 .02513.x.
9.Hayden RT, Yan X, Wick MT, Rodriguez AB, Xiong X, Ginocchio CC,
Mitchell MJ, Caliendo AM, College of American Pathologists
Microbi-ology Resource Committee.2012. Factors contributing to variability of
quantitative viral PCR results in proficiency testing samples: a multivari-ate analysis. J Clin Microbiol50:337–345.http://dx.doi.org/10.1128/JCM .01287-11.
10. Hayden RT, Gu Z, Sam SS, Sun Y, Tang L, Pounds S, Caliendo AM.
2015. Comparative evaluation of three commercial quantitative cytomeg-alovirus standards by use of digital and real-time PCR. J Clin Microbiol 53:1500 –1505.http://dx.doi.org/10.1128/JCM.03375-14.
11. Clinical and Laboratory Standards Institute.2010. Characterization and
qualification of commutable reference materials for laboratory medicine; approved guideline, vol EP30-A. Clinical and Laboratory Standards Insti-tute, Wayne, PA.
12. Caliendo AM, Shahbazian MD, Schaper C, Ingersoll J, Abdul-Ali D,
Boonyaratanakornkit J, Pang XL, Fox J, Preiksaitis J, Schonbrunner ER. 2009. A commutable cytomegalovirus calibrator is required to improve the agreement of viral load values between laboratories. Clin Chem55: 1701–1710.http://dx.doi.org/10.1373/clinchem.2009.124743.
13. Cattozzo G, Franzini C, d’Eril GV.2001. Myoglobin and creatine kinase
isoenzyme MB mass assays: intermethod behaviour of patient sera and commercially available control materials. Clin Chim Acta303:55– 60.
http://dx.doi.org/10.1016/S0009-8981(00)00370-3.
14. Vesper HW, Miller WG, Myers GL.2007. Reference materials and
com-mutability. Clin Biochem Rev28:139 –147.
15. Hayden RT, Shahbazian MD, Valsamakis A, Boonyaratanakornkit J,
Cook L, Pang XL, Preiksaitis JK, Schonbrunner ER, Caliendo AM.2013.
Multicenter evaluation of a commercial cytomegalovirus quantitative standard: effects of commutability on interlaboratory concordance. J Clin Microbiol51:3811–3817.http://dx.doi.org/10.1128/JCM.02036-13.
16. Bretaudiere JP, Dumont G, Rej R, Bailly M.1981. Suitability of control
materials: general principles and methods of investigation. Clin Chem 27:798 – 805.
17. Sedlak RS, Jerome KR.2014. Viral diagnostics in the era of digital PCR.
Diagn Microbiol Infect Dis 75:1– 4. http://dx.doi.org/10.1016/j .diagmicrobio.2012.10.009.
18. Pavšicˇ J, Žel J, Milavec M.2016. Digital PCR for direct quantification of
viruses without DNA extraction. Anal Bioanal Chem408:67–75.http://dx .doi.org/10.1007/s00216-015-9109-0.
19. Haynes RJ, Kline MC, Toman B, Scott C, Wallace P, Butler JM, Holden
MJ.2013. Standard reference material 2366 for measurement of human cytomegalovirus DNA. J Mol Diagn 15:177–185. http://dx.doi.org/10 .1016/j.jmoldx.2012.09.007.
20. Buelow D, Sun Y, Tang L, Pounds S, Gu Z, Hayden R.Comparative
evaluation of four real-time PCR methods for the quantitative detection of EBV from whole blood specimens. J Mol Diagn, in press.
21. Hayden RT, Preiksaitis J, Tong Y, Pang X, Sun Y, Tang L, Cook L,
Pounds S, Fryer J, Caliendo AM.2015. Commutability of the first World
Health Organization international standard for human cytomegalovirus. J Clin Microbiol53:3325–3333.http://dx.doi.org/10.1128/JCM.01495-15.
22. Linnet K.1993. Evaluation of regression procedures for methods
com-parison studies. Clin Chem39:424 – 432.
23. Passing H, Bablok W.1983. A new biometrical procedure for testing the
equality of measurements from two different analytical methods. Appli-cation of linear regression procedures for method comparison studies in clinical chemistry, part I. J Clin Chem Clin Biochem 21:709 –720.http: //dx.doi.org/10.1515/cclm.1983.21.11.709.
24. Clinical and Laboratory Standards Institute.2012. Expression of
mea-surement uncertainty in laboratory medicine; approved guideline, vol EP29-A. Clinical and Laboratory Standards Institute, Wayne, PA.
Quantitative Assessment of Commutability