0095-1137/10/$12.00
doi:10.1128/JCM.00233-10
Copyright © 2010, American Society for Microbiology. All Rights Reserved.
Evaluation of One- and Two-Color Gene Expression Arrays for
Microbial Comparative Genome Hybridization Analyses
in Routine Applications
䌤
Roland Schwarz,
1,2†‡ Biju Joseph,
2† Gabriele Gerlach,
2Anja Schramm-Glu
¨ck,
2Kathrin Engelhard,
2Matthias Frosch,
2Tobias Mu
¨ller,
1and Christoph Schoen
2*
Department of Bioinformatics
1and Institute for Hygiene and Microbiology,
2University of Wu
¨rzburg, 98070 Wu
¨rzburg, Germany
Received 4 February 2010/Returned for modification 29 March 2010/Accepted 21 June 2010
DNA microarray technology has already revolutionized basic research in infectious diseases, and
whole-genome sequencing efforts have allowed for the fabrication of tailor-made spotted microarrays for an
increas-ing number of bacterial pathogens. However, the application of microarrays in diagnostic microbiology is
currently hampered by the high costs associated with microarray experiments and the specialized equipment
needed. Here, we show that a thorough bioinformatic postprocessing of the microarray design to reduce the
amount of unspecific noise also allows the reliable use of spotted gene expression microarrays for gene content
analyses. We further demonstrate that the use of only single-color labeling to halve the costs for dye-labeled
nucleotides results in only a moderate decrease in overall specificity and sensitivity. Therefore, gene expression
microarrays using only single-color labeling can also reliably be used for gene content analyses, thus reducing
the costs for potential routine applications such as genome-based pathogen detection or strain typing.
In recent years, molecular applications in the diagnosis of
infectious diseases have become commonplace in academic
medical centers and tertiary-care facilities and are becoming
also more tangible in community-based settings. However, to
be implemented in clinical microbiology laboratories with ease
and accuracy, the further advancement of molecular infectious
disease diagnostics is dependent on the ability of multiplexing
technologies or the ability to detect and identify more than one
pathogen simultaneously from the same specimen (18).
One approach to multiplex detection and characterization is
microarray analysis which, since its first description in the
1990s, has already revolutionized basic research in infectious
diseases (reviewed in references 7 and 18). Accordingly,
mi-crobial diagnostic microarrays (MDMs) have also been used in
a number of research applications in clinical microbiology (18).
For example, an oligonucleotide microarray targeting the 16S
rRNA gene was recently developed for the detection of a panel
of 40 predominant human intestinal bacterial pathogens in
human fecal samples (35), and assays using broad-range PCR
along with microarrays have been shown to allow rapid
bacte-rial detection and identification with positive blood culture (2).
Another promising application of microarray techniques in
clinical microbiology is the determination of antimicrobial
re-sistance by simultaneously detecting a panel of drug rere-sistance-
resistance-related mutations in microbial genomes, and oligonucleotide
microarrays were developed to analyze and identify
drug-re-sistant
Mycobacterium tuberculosis
strains with results that were
comparable to those of standard antimicrobial susceptibility
testing but obtained in less than 24 h (12, 17). Likewise, an
oligonucleotide microarray outperforming the standard
proce-dures in terms of assay time and the depth of information
provided was designed for the rapid identification of
extended-spectrum beta-lactamases in Gram-negative bacteria by
simul-taneously genotyping
bla
TEM,
bla
SHV, and
bla
CTX-M(14). The
accurate identification and prompt typing of pathogens is
fi-nally another important area where MDMs have numerous
potential applications, and microarray-based approaches that
can be used to support or replace the classical serotyping
methods for several conventional diarrhea bacterial pathogens,
including pathogenic
Escherichia coli
(16), as well as
Salmo-nella
(34) and
Campylobacter
(33) species, have already been
proposed. As a consequence, this multitude of possible clinical
applications, as well as their recent technical evaluation by the
MicroArray Quality Control (MAQC) consortium (27),
re-sulted in the approval of microarray technology by the U.S.
Food and Drug Administration (26), and recent advancements
in whole-genome sequencing technologies will allow for the
fabrication of tailor-made spotted microarrays for an
ever-increasing number of bacterial pathogens.
Unfortunately, one of the biggest challenges for the use of
MDMs in routine microbiological diagnostic laboratories is
still the high price not only for the design and manufacturing of
microarrays but also for the downstream experimental steps
(19). Moreover, since transcription profiling is still the most
widespread application of microarrays and the design of
oligo-nucleotides for gene expression arrays differs from the design
of oligonucleotides used, e.g., for strain identification and
typ-ing or the detection of antibiotic resistance genes by
compar-ative genome hybridization (aCGH) (4), tailor-made
microar-rays are required for each of these applications. Since the costs
for dye-labeled deoxynucleoside triphosphates (dNTPs) are
* Corresponding author. Mailing address: Institute for Hygiene and
Microbiology, University of Wu
¨rzburg, Josef-Schneider-Str. 2, Bau E1,
97080 Wu
¨rzburg, Germany. Phone: 49 931 201 46901. Fax: 49 931 201
46445. E-mail: [email protected].
† R.S. and B.J. contributed equally to this study.
‡ Present address: Cancer Research UK, Cambridge Research
In-stitute, Li Ka Shing Centre, Robinson Way, Cambridge, CB2 0RE,
United Kingdom.
䌤
Published ahead of print on 30 June 2010.
3105
on May 16, 2020 by guest
http://jcm.asm.org/
also still considerable, possibilities to reduce the costs would
therefore include the dual use of gene expression microarrays
also for aCGH experiments and/or the use of only a single
fluorescent dye for DNA labeling. However, the difference in
quality between one- and two-color designs have only been
assessed for measuring gene expression differences (21), as
well as with respect to tissue classification tasks (3), and thus
far no systematic comparisons have been made in the context
of aCGH studies. Likewise, a systematic comparison of the
effect of spotted array design on aCGH performance is also
still missing.
Since quality and reproducibility are critical issues in
mi-croarray experiments (6), we compared here computationally
unprocessed and postprocessed spotted oligonucleotide
mi-croarrays originally designed for transcriptional profiling in
Neisseria meningitidis
as a test case in a one-color and a
two-color aCGH setup with respect to specificity, sensitivity, and
prediction variability using the results from computational
ge-nome comparisons as a reference.
MATERIALS AND METHODS
Microarray design and fabrication.There are already two PCR-product-based
spotted microarrays available forN. meningitidiswhich were both termed pan-Neisseriamicroarray (30, 31) and representing open reading frames (ORFs) from the genomes of the invasiveN. meningitidisstrains Z2491 (20), MC58 (32), and FAM18 (5) among others. However, oligonucleotide-based microarrays were shown to offer important advantages over PCR product-based microarrays, in-cluding a reduction in cross-hybridization and an increase in the differentiation of overlapping genes or highly homologous regions (reviewed in reference 10). Therefore, to also include the recently sequenced genome of the meningococcal carriage strain␣14 (25), an oligonucleotide-based microarray was constructed in collaboration with Eurofins MWG Operon (Ebersberg, Germany) containing 2,872 oligonucleotides representing 2,098 open reading frame (ORFs) fromN. meningitidisMC58 (NCBI Ref_Seq NC_003112), 2,119 ORFs fromN. meningi-tidisZ2491 (NCBI Ref_Seq NC_003116), 2,131 ORFs fromN. meningitidis FAM18 (NCBI Ref_Seq NC_008767), and 2,067 ORFs fromN. meningitidis␣14 (GenBank accession no. AM889136), respectively. The oligonucleotides were designed according to the method described by Li and Stormo (15). Accordingly, 2,078 oligonucleotides were directly designed from the primary sourceN. men-ingitidisMC58, but the probes were selected such that a large number ofN. meningitidisZ2491,N. meningitidisFAM18, andN. meningitidis␣14 ORFs were also represented. An ORF was said to be represented by an oligonucleotide if the oligonucleotide had a greater than 93% identity over the entire length of the oligonucleotide in the corresponding ORF. The cross-hybridization percent identity was calculated from the number of matched bases divided by oligonu-cleotide length times 100 using ungapped BLASTN (1) comparisons against the top non-self-hit gene for that oligonucleotide. All oligonucleotides were first designed for each ORF in the primary sourceN. meningitidisMC58 minimized for cross-hybridization identity to other non-self ORFs in strain MC58 and to maximize cross-hybridization identity to all other ORFs of the three other ge-nomes. SinceN. meningitidisMC58 has a number of duplicate ORFs with almost identical nucleotide sequences, only one of these duplicate ORFs was used for oligonucleotide design. Accordingly, 296 oligonucleotides were directly designed fromN. meningitidisZ2491, 102 oligonucleotides were directly designed fromN. meningitidisFAM18, and 396 oligonucleotides were directly designed fromN. meningitidis␣14, respectively. All oligonucleotides hadⱕ70% cross-hybridiza-tion identity to all other non-self ORFs and were designed to be 70mers with a Tmof 75⫾5°C except for a few cases with too-high or too-low GC content. In addition, 14 oligonucleotides that represent different regions of the luciferase gene (from pGL3-Basic Vector; Promega, Manheim, Germany) were spotted, and 100 ng of a PCR product (using the primer pair LucF [5-CTAGCAAAAT AGGCTGTCCC-3⬘] and LucR [5⬘-GACGATAGTCATGCCCCGCG-3⬘]) was used as a spike in controls in each slide to assess the quality of hybridization. The oligonucleotides were resuspended in spotting buffer (3⫻SSC [1⫻SSC is 0.15 M NaCl plus 0.015 M sodium citrate], 1.5 M betaine) to a final concentration of 25 M and were spotted onto Schott Nexterion E epoxy-coated slides (Schott AG, Mainz, Germany) using an OmniGrid spotter (Genomic Solutions, Ann Arbor, MI) according to the manufacturer’s protocol. Test scans of slides hybridized
with Cy3-labeled nonamer probe [4⫻SSC, 1 mg of poly(dA)/ml, 50 mM HEPES, 0.2% sodium dodecyl sulfate, 7.5M Cy3 random nonamer (Qiagen, Hilden, Germany)] were performed to assess the quality of the spotted slides with respect to spot morphology and missing spots.
The layout of the spotted microarray slides and the data associated with the present study have been deposited in NCBI’s Gene Expression Omnibus (GEO) (http://www.ncbi.nlm.nih.gov/geo/) and are accessible through the GEO series accession number GSE18158 (two-color data set) and GSE18159 (one-color data set), respectively.
Microarray hybridization. Chromosomal DNA from the meningococcal
strains were isolated by using Qiagen Genomic-Tip 20/G (Qiagen, Hilden, Ger-many), and the microarray slides were prehybridized according to the manufac-turer’s protocols (Schott AG, Germany).
In a low-cost setting using only one fluorescently labeled dNTP, 4g of chromosomal DNA was labeled with Cy3 dCTP (GE Healthcare, Munich, Ger-many) and Klenow enzyme. Briefly, 4g of meningococcal DNA (denatured at 95°C for 10 min) was mixed with 100M dATP, dTTP, and dGTP and 50M dCTP; 10g of random nonamers (Sigma Aldrich, Heidenheim, Germany); 1 nmol of Cy3dCTP; and 2 U of Klenow enzyme (Roche Diagnostics, Mannheim, Germany) with a 1⫻reaction buffer (50 mM Tris-HCl, 10 mM MgCl2, 100M dithiothreitol, 2g of bovine serum albumin). The labeling reaction was per-formed at 37°C overnight. The reaction was stopped by using 200M EDTA (pH 8.0) and 4 M sodium acetate (pH 4.5), and the labeled DNA was precipitated using absolute ethanol. The labeled DNA pellet was resuspended in distilled water after washing with 70% ethanol and drying. Labeling efficiencies were measured by using Nanodrop 1000 (PeqLab Biotechnologie GmbH, Erlangen, Germany) to assess the quantity of labeled DNA and also the rate of incorpo-ration of the labeled dCTPs (Cy3/Cy5). Standard rates of incorpoincorpo-ration of la-beled nucleotides were adapted from reference 24 and, accordingly, a probe specific activity as defined by (pmol of dye perl)/(g of DNA perl)⬎25 pmol/g and a yield of labeled DNA⬎6g were used for hybridizations. The DNA probe for hybridization onto the microarray slides was prepared by mixing the labeled DNA with 3g of salmon sperm DNA (Sigma Aldrich) and two volumes of hybridization buffer (Eurogentec, Cologne, Germany). The probes were denatured at 95°C for 10 min, manually hybridized onto prehybridized microarray slides using a coverslip, and incubated overnight at 50°C. After hybridization, the slides were washed according to the manufacturer’s protocols and scanned using ScanArray HT (Perkin-Elmer, Ju¨gesheim, Germany), and the resulting images were analyzed using Imagene 4.0 (BioDiscovery, El Segundo, CA) to generate the raw files for further analyses.
In the high-cost setting using two fluorescently labeled dNTPs, an aliquot of all DNAs to be tested was pooled together to form the common reference. Then, 4 g of test DNA was labeled with Cy3 dCTP, and 4g of reference DNA was labeled with Cy5 dCTP using the protocol described above. Hybridization in this case was carried out on a Tecan 4800 Pro hybridization station (Tecan Trading AG, Switzerland). The slides were scanned by using GenePix 4200, and the raw data files were extracted by using GenePix Pro 4.0. Spots were flagged in obvious instances of high background or stray fluorescent signals in both experiments. In both cases (i.e., the low-cost and high-cost settings), three microarrays were performed for each probe.
Prediction of gene presence or absence from the genomic data.For
compu-tational gene presence or absence predictions, we performed gapped BLASTN searches (word size, 11) of all 2,870 oligonucleotides against both strands of the genomes ofN. meningitidisMC58,N. meningitidisZ2491,N. meningitidisFAM18, N. meningitidis␣14,N. meningitidis␣153 (GenBank accession no. AM889137), andN. meningitidis␣275 (GenBank accession no. AM889138). Hits below an E-value cutoff of 0.001 were considered significant and predicted the presence of the oligonucleotide in the genome and therefore of a hybridization signal.
Postprocessing of the microarray design for aCGH.To minimize the chance
for cross-hybridizations with noncoding regions, we used the available genome annotations to distinguish true gene hits from hits in intergenic regions. Oligo-nucleotides that resulted in a significant BLAST hit in an intergenic region within one or more genomes were therefore removed from downstream analyses.
Prediction of gene absence or presence from aCGH data.Microarrays were
analyzed using Limma (29) implemented in the R language (23). All processing and normalization steps were performed identically on both one- and two-color arrays. Normalization was carried out using variance stabilization (13) and, after fitting to the reference channel, the two-color arrays were transformed into single-channel intensities using Limma’s intraspot correlation routine. The nor-malized single-channel intensities were used for the absence or presence predic-tion of individual genes. To determine the intensity threshold above which a gene was predicted to be present, we fitted receiver operating characteristic (ROC) curves to the linear predictor and used the threshold minimizing the
on May 16, 2020 by guest
http://jcm.asm.org/
fication error, thus treating specificity and sensitivity as equal (28). To assess robustness of the threshold estimator, we generated 1,000 bootstrap samples by drawing with replacement from the original data set and repeated the threshold estimation for each bootstrap sample to create ca. 95% bootstrapped percentile confidence bounds for the threshold parameter. All normalization and boot-strapping steps were performed using R.
RESULTS AND DISCUSSION
Statistically rigid validation of the hybridization results with
respect to prediction accuracy has seldom been performed thus
far in aCGH studies. Therefore, we used available
whole-genome data as a “gold standard” against which we
individu-ally compared the results of aCGH experiments obtained
un-der two different test conditions representing different
complexity and cost scales: a simple one-color manually
hy-bridized intensity array versus the log fold changes from a
two-color study against a pooled common reference probeset,
hybridized with specialized hybridization station equipment.
Microarray experiments for both one- and two-color arrays
were carried out using identical arrays originally designed for
transcriptional profiling studies. Although there are steps in
the experimental design in both settings that are not identical,
the robust postprocessing of the obtained data in both cases
and their comparison to the available genome data allowed for
a robust and meaningful comparison between the one-color and
two-color arrays. Prediction accuracy was measured both with and
without computational postprocessing of the arrays to cope with
the danger of cross-hybridization to intergenic regions.
Effect of array design.
Typically, aCGH microarrays are
spe-cifically designed for the task, and oligonucleotides to be used
in expression analyses are usually not suited for aCGH studies
since they are designed to minimize cross-hybridization with
other coding regions but not with genomic regions that are not
expressed (15). To cope with possible cross-hybridizations
from intergenic regions, we performed a filtering step as
de-scribed above that excludes these oligonucleotides from the
6 8 10 12 14 16
−0.2
0
.2
0
.6
1
.0
Master vs. Intens (two−color)
intensity
absence / presenc
e
10 12 14 16
−
0
.2
0.2
0.6
1.0
Master vs. Intens (one−color)
intensity
absence / presenc
e
6 8 10 12 14 16
0.0
0
.1
0.2
0
.3
0.4
density intensities (two−color)
signal/noise = 1.6626 N = 1996 Bandwidth = 0.2079
Density
absent present
10 12 14 16
0.0
0
.2
0.4
0
.6
0.8
1
.0
1.2
density intensities (one−color)
signal/noise = 1.1616 N = 1996 Bandwidth = 0.08607
Density
[image:3.585.44.283.80.174.2]absent present
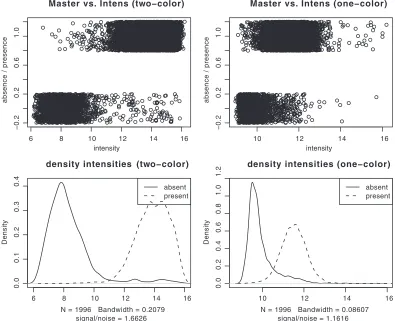
[image:3.585.95.490.369.690.2]FIG. 1. Comparison of spot intensities (upper panels) and the corresponding densities (lower panels) between one- and two-color arrays. The
two-color arrays (left panels) have clearly a wider spread, lower overlap, and therefore better differentiation between absent or present genes. Note
that the absence or presence data in the first plots (upper panels) are binary values that have been jittered solely for visualization purposes.
TABLE 1. Comparison of array performance
aResult
Relative error (⫾SD)
Two-color array One-color array
Filtered Unfiltered Filtered Unfiltered
True positive 0.99 (⫾0.00) 0.99 (⫾0.00) 0.98 (⫾0.01) 0.97 (⫾0.01) False negative 0.01 (⫾0.00) 0.01 (⫾0.00) 0.02 (⫾0.01) 0.03 (⫾0.01) True negative 0.95 (⫾0.05) 0.58 (⫾0.08) 0.81 (⫾0.04) 0.52 (⫾0.06) False positive 0.05 (⫾0.05) 0.42 (⫾0.08) 0.19 (⫾0.04) 0.48 (⫾0.06) Total correct 0.98 (⫾0.01) 0.88 (⫾0.04) 0.94 (⫾0.01) 0.85 (⫾0.03) Total wrong 0.02 (⫾0.01) 0.12 (⫾0.04) 0.06 (⫾0.01) 0.15 (⫾0.03)
aRelative error and correct classification rates for gene absence or presence predictions were averaged over all six strains comparing one- and two-color arrays before and after postprocessing.
on May 16, 2020 by guest
http://jcm.asm.org/
downstream analyses. Since most laboratories use microarrays
for gene expression analyses this filtering provides a
cost-effi-cient way to exploit a specific microarray to its fullest by using
the same array design for both expression and aCGH studies.
By excluding oligonucleotides with possible
cross-hybridiza-tions in intergenic regions 1,174 oligonucleotides were
re-moved, thus reducing the number of oligonucleotides available
for aCGH to 1696. However, for one- and two-color arrays,
comparison of the array performance before and after
post-processing showed that false-positive rates dramatically
de-creased in the filtered setting (Table 1). For example, in
␣
14
the false-positive rate decreased from 31% without filtering to
only 1.3%, and this rather simple computational
postprocess-ing therefore results in a drastically improved performance of
gene expression arrays in aCGH studies.
Prediction accuracy for one- and two-color arrays.
Explor-ative analysis of the experimental signal intensities with respect
to the results from computational genome comparisons further
[image:4.585.90.496.66.457.2]revealed that the cheaper one-color arrays had lower
signal-to-noise ratios (1.17 compared to 1.66) and greater overlap
between genes predicted as absent and present by
computa-tional genome comparisons (Fig. 1, right panel) than the
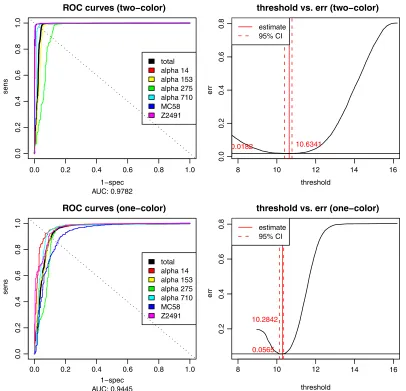
two-color arrays (Fig. 1, left panel). This was also confirmed by
analysis of the ROC of the linear classifiers, where the area
under the curve (AUC) indicated a higher accuracy of the
two-color experiments (AUC
⫽
0.98) compared to the
one-color design (AUC
⫽
0.94). The optimality criterion for
choos-ing the intensity threshold was to minimize the combined
spec-ificity and sensitivity error (left panel of Fig. 2) and was
comparable for both data sets (10.6743 in the one-color case
versus 10.6341 in the two-color case), but the curvature of the
error function (right panel of Fig. 2) clearly indicated lower
confidence in the one-color case. However, individual
compar-isons of the results of genome analysis with these gene absence
or presence classifications further showed that both one- and
two-color studies were indeed able to reproduce the results
FIG. 2. ROC curves for one- and two-color arrays. ROC curves are shown for both one-color (top left) and two-color (bottom left) arrays for
all six strains (colored) and the complete data set (black), which was used for determination of the optimal threshold (right). The threshold fitted
on the original data set had its optimum at 10.6341 at an error rate of 0.0182 in the two-color case and 10.2842 at 0.0565 in the one-color case.
err, error.
on May 16, 2020 by guest
http://jcm.asm.org/
from the computational genome analyses for the most part
(Fig. 3), and this could be done largely independent of whether
the analyzed genome was spotted on the chip
(misclassifica-tion rates of 2 and 6%, respectively, for one-color and
two-color studies). The difference in quality between one- and
two-color experiments is only apparent with 76 genes that the
one-color arrays failed to classify correctly compared to the
two-color experiments. Investigation of the misclassified genes
showed that their intensities lay close to the decision boundary,
and misclassification could therefore be due to the lower
sig-nal-to-noise ratio of the one-color arrays. The two-color arrays
thus outperformed the results from the one-color studies by
about a factor of 3, lowering the total misclassification rates
from 5.68 to 1.86%. However, even a combination of
state-of-the-art hybridization technology with an increased
experimen-tal effort requiring an automated hybridization station and
twice the amount of fluorescently labeled dCTP only led to an
overall increase in prediction accuracy from 94 to 98%
com-pared to manual hybridization and a one-color setup, provided
a careful selection of oligonucleotide probes.
Relative cost assessment and potential cost savings.
As
shown in this work, a DNA microarray experiment in its most
reduced version requires in addition to custom-made slides
only a microarray scanner and one fluorescently labeled dNTP
for labeling. Therefore, for institutions where microarrays are
already used for genome-wide gene expression analyses, the
dual use of the same microarray also for aCGH obviates the
need for extra array design and fabrication. Further, since
manual hybridization did not drastically impair the overall
performance of the aCGH, the acquirement of a costly
hybrid-ization station is also not required for laboratories with only a
low throughput of clinical specimens to be analyzed by aCGH.
Finally, cost differences between one- and two-color arrays are
mainly due to the twice-as-high consumption of the fluorescent
dCTP, Klenow enzyme, and dNTP in the two-color case.
[image:5.585.106.476.66.333.2]Conclusion and outlook.
Based on a careful selection of
oligonucleotide probes, our results show that the accuracy of
gene absence/presence prediction of manually hybridized
one-color microarrays in aCGH studies remains remarkable, with
an overall of 94% of genes correctly annotated compared to
two-color hybridization using specialized equipment. At least
for institutions where microarrays are already used for
ge-nome-wide gene expression analyses, the dual use of the same
microarray also for aCGH thus obviates the need for an extra
array design and, in particular, the one-color aCGHs could be
applied in diagnostic microbiology laboratories
complement-ing more traditional cultural or molecular approaches. Since
the computational postprocessing of the gene expression
mi-croarray design for aCGH application presented here is based
on the availability of whole-genome sequences, the clinical
applicability of MDMs might indeed be fostered by the
in-creasing number of whole-genome sequences currently
gener-ated by numerous genome sequencing efforts using so-called
next-generation sequencing technologies (9). The considerable
number of oligonucleotides that had be excluded from further
analyses is usually not a major drawback if the aCGH outcome
is used for simple pathogen identification by simultaneous
de-tection of pathogen-specific genes (8), for strain typing for
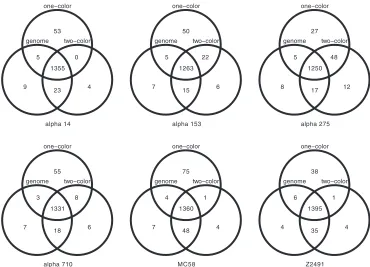
FIG. 3. Gene absence and presence comparisons for six meningococcal strains. Venn diagrams of gene presence comparing genome sequencing
with one-color and two-color arrays over all six test strains are shown. For the vast majority of the genes (92.94, 92.26, 91.61, 93.15, 91.14, and
94.09% from left to right, top to bottom) for genome sequencing, the one- and two-color arrays were in agreement (total intersection set and
universe). Prediction errors accumulate in the intersections, where one-color predictions contradict both two-color and genome analyses (66
and 19 in
␣
14, 52 and 13 in
␣
153, 30 and 13 in
␣
275, 56 and 17 in
␣
710, 79 and 39 in MC58, and 48 and 24 in Z2491).
on May 16, 2020 by guest
http://jcm.asm.org/
epidemiologic studies based on gene content (11), or for the
detection of multiple antibiotic resistance genes (22).
ACKNOWLEDGMENT
This study was supported by the PathoGenoMik-Plus funding initiative
grant 0313801A from the Bundesministerium fu
¨r Bildung und Forschung.
REFERENCES
1.Altschul, S. F., T. L. Madden, A. A. Scha¨ffer, J. Zhang, Z. Zhang, W. Miller,
and D. J. Lipman.1997. Gapped BLAST and PSI-BLAST: a new generation
of protein database search programs. Nucleic Acids Res.25:3389–3402.
2.Anthony, R. M., T. J. Brown, and G. L. French.2000. Rapid diagnosis of
bacteremia by universal amplification of 23S ribosomal DNA followed by hybridization to an oligonucleotide array. J. Clin. Microbiol.38:781–788.
3.Attoor, S., E. R. Dougherty, Y. Chen, M. L. Bittner, and J. M. Trent.2004.
Which is better for cDNA-microarray-based classification: ratios or direct intensities. Bioinformatics20:2513–2520.
4.Behr, M. A., M. A. Wilson, W. P. Gill, H. Salamon, G. K. Schoolnik, S. Rane,
and P. M. Small.1999. Comparative genomics of BCG vaccines by
whole-genome DNA microarray. Science284:1520–1523.
5.Bentley, S. D., G. S. Vernikos, L. A. Snyder, C. Churcher, C. Arrowsmith, T.
Chillingworth, A. Cronin, P. H. Davis, N. E. Holroyd, K. Jagels, M. Maddi-son, S. Moule, E. Rabbinowitsch, S. Sharp, L. Unwin, S. Whitehead, M. A.
Quail, M. Achtman, B. Barrell, N. J. Saunders, and J. Parkhill.2007.
Meningococcal genetic variation mechanisms viewed through comparative analysis of serogroup C strain FAM18. PLoS Genet.3:e23.
6.Brazma, A., P. Hingamp, J. Quackenbush, G. Sherlock, P. Spellman, C.
Stoeckert, J. Aach, W. Ansorge, C. A. Ball, H. C. Causton, T. Gaasterland, P. Glenisson, F. C. Holstege, I. F. Kim, V. Markowitz, J. C. Matese, H. Parkinson, A. Robinson, U. Sarkans, S. Schulze-Kremer, J. Stewart, R.
Taylor, J. Vilo, and M. Vingron.2001. Minimum information about a
mi-croarray experiment (MIAME)-toward standards for mimi-croarray data. Nat. Genet.29:365–371.
7.Bryant, P. A., D. Venter, R. Robins-Browne, and N. Curtis.2004. Chips with
everything: DNA microarrays in infectious diseases. Lancet Infect. Dis. 4:100–111.
8.Cleven, B. E., M. Palka-Santini, J. Gielen, S. Meembor, M. Kro¨nke, and O.
Krut.2006. Identification and characterization of bacterial pathogens causing
bloodstream infections by DNA microarray. J. Clin. Microbiol.44:2389–2397.
9.Coppe´e, J.-Y.2008. Do DNA microarrays have their future behind them?
Microbes Infect.10:1067–1071.
10.Dorrell, N., S. J. Hinchliffe, and B. W. Wren.2005. Comparative
phylo-genomics of pathogenic bacteria by microarray analysis. Curr. Opin. Micro-biol.8:620–626.
11.Dorrell, N., J. A. Mangan, K. G. Laing, J. Hinds, D. Linton, H. Al-Ghusein,
B. G. Barrell, J. Parkhill, N. G. Stoker, A. V. Karlyshev, P. D. Butcher, and
B. W. Wren.2001. Whole genome comparison ofCampylobacter jejuni
hu-man isolates using a low-cost microarray reveals extensive genetic diversity. Genome Res.11:1706–1715.
12.Gryadunov, D., V. Mikhailovich, S. Lapa, N. Roudinskii, M. Donnikov, S.
Pan’kov, O. Markova, A. Kuz’min, L. Chernousova, O. Skotnikova, A.
Moroz, A. Zasedatelev, and A. Mirzabekov.2005. Evaluation of hybridisation
on oligonucleotide microarrays for analysis of drug-resistantMycobacterium tuberculosis. Clin. Microbiol. Infect.11:531–539.
13.Huber, W., A. von Heydebreck, H. Sueltmann, A. Poustka, and M. Vingron.
2002. Variance stabilization applied to microarray data calibration and to the quantification of differential expression. Bioinformatics18(Suppl. 1):S96–S104.
14.Leinberger, D. M., V. Grimm, M. Rubtsova, J. Weile, K. Schroppel, T. A.
Wichelhaus, C. Knabbe, R. D. Schmid, and T. T. Bachmann.2010.
Inte-grated detection of extended-spectrum beta-lactam resistance by DNA mi-croarray-based genotyping of TEM, SHV, and CTX-M genes. J. Clin. Mi-crobiol.48:460–471.
15.Li, F., and G. D. Stormo.2001. Selection of optimal DNA oligonucleotides
for gene expression arrays. Bioinformatics17:1067–1076.
16.McNamara, S. E., U. Srinivasan, L. Zhang, T. S. Whittam, C. F. Marrs, and
B. Foxman.2009. Comparison of probe hybridization array typing to
mul-tilocus sequence typing for pathogenicEscherichia coli. J. Clin. Microbiol. 47:596–602.
17.Mikhailovich, V., S. Lapa, D. Gryadunov, A. Sobolev, B. Strizhkov, N.
Chernyh, O. Skotnikova, O. Irtuganova, A. Moroz, V. Litvinov, M. Vladimir-skii, M. Perelman, L. Chernousova, V. Erokhin, A. Zasedatelev, and A.
Mirzabekov.2001. Identification of rifampin-resistantMycobacterium
tuber-culosis strains by hybridization, PCR, and ligase detection reaction on oligonucleotide microchips. J. Clin. Microbiol.39:2531–2540.
18.Miller, M. B., and Y. W. Tang.2009. Basic concepts of microarrays and potential
applications in clinical microbiology. Clin. Microbiol. Rev.22:611–633.
19.Nolte, F. S., and A. M. Caliendo.2007. Molecular detection and
identifica-tion of microorganisms, p. 218–244.InP. Murray, E. J. Baron, J. H. Jor-gensen, M. L. Landry, and M. A. Pfaller (ed.), Manual of clinical microbi-ology. ASM Press, Washington, DC.
20.Parkhill, J., M. Achtman, K. D. James, S. D. Bentley, C. Churcher, S. R.
Klee, G. Morelli, D. Basham, D. Brown, T. Chillingworth, R. M. Davies, P. Davis, K. Devlin, T. Feltwell, N. Hamlin, S. Holroyd, K. Jagels, S. Leather, S. Moule, K. Mungall, M. A. Quail, M. A. Rajandream, K. M. Rutherford, M. Simmonds, J. Skelton, S. Whitehead, B. G. Spratt, and B. G. Barrell. 2000. Complete DNA sequence of a serogroup A strain ofNeisseria menin-gitidisZ2491. Nature404:502–506.
21.Patterson, T. A., E. K. Lobenhofer, S. B. Fulmer-Smentek, P. J. Collins,
T. M. Chu, W. Bao, H. Fang, E. S. Kawasaki, J. Hager, I. R. Tikhonova, S. J. Walker, L. Zhang, P. Hurban, F. de Longueville, J. C. Fuscoe, W. Tong, L.
Shi, and R. D. Wolfinger.2006. Performance comparison of one-color and
two-color platforms within the MicroArray Quality Control (MAQC) project. Nat. Biotechnol.24:1140–1150.
22.Perreten, V., L. Vorlet-Fawer, P. Slickers, R. Ehricht, P. Kuhnert, and J.
Frey.2005. Microarray-based detection of 90 antibiotic resistance genes of
gram-positive bacteria. J. Clin. Microbiol.43:2291–2302.
23.R Development Core Team.2008. R: a language and environment for
sta-tistical computing. R Foundation for Stasta-tistical Computing, Vienna, Austria.
24.Redon, R., D. Rigler, and N. P. Carter.2009. Comparative genomic
hybrid-ization: DNA preparation for microarray fabrication. Methods Mol. Biol. 529:259–266.
25.Schoen, C., J. Blom, H. Claus, A. Schramm-Gluck, P. Brandt, T. Muller, A.
Goesmann, B. Joseph, S. Konietzny, O. Kurzai, C. Schmitt, T. Friedrich, B.
Linke, U. Vogel, and M. Frosch.2008. Whole-genome comparison of disease
and carriage strains provides insights into virulence evolution inNeisseria meningitidis. Proc. Natl. Acad. Sci. U. S. A.105:3473–3478.
26.Shi, L., R. G. Perkins, H. Fang, and W. Tong.2008. Reproducible and
reliable microarray results through quality control: good laboratory profi-ciency and appropriate data analysis practices are essential. Curr. Opin. Biotechnol.19:10–18.
27.Shi, L., L. H. Reid, W. D. Jones, R. Shippy, J. A. Warrington, S. C. Baker,
P. J. Collins, F. de Longueville, E. S. Kawasaki, K. Y. Lee, Y. Luo, Y. A. Sun, J. C. Willey, R. A. Setterquist, G. M. Fischer, W. Tong, Y. P. Dragan, D. J. Dix, F. W. Frueh, F. M. Goodsaid, D. Herman, R. V. Jensen, C. D. Johnson, E. K. Lobenhofer, R. K. Puri, U. Schrf, J. Thierry-Mieg, C. Wang, M. Wilson, P. K. Wolber, L. Zhang, S. Amur, W. Bao, C. C. Barbacioru, A. B. Lucas, V. Bertholet, C. Boysen, B. Bromley, D. Brown, A. Brunner, R. Canales, X. M. Cao, T. A. Cebula, J. J. Chen, J. Cheng, T. M. Chu, E. Chudin, J. Corson, J. C. Corton, L. J. Croner, C. Davies, T. S. Davison, G. Delenstarr, X. Deng, D. Dorris, A. C. Eklund, X. H. Fan, H. Fang, S. Fulmer-Smentek, J. C. Fuscoe, K. Gallagher, W. Ge, L. Guo, X. Guo, J. Hager, P. K. Haje, J. Han, T. Han, H. C. Harbottle, S. C. Harris, E. Hatchwell, C. A. Hauser, S. Hester, H. Hong, P. Hurban, S. A. Jackson, H. Ji, C. R. Knight, W. P. Kuo, J. E. LeClerc, S. Levy, Q. Z. Li, C. Liu, Y. Liu, M. J. Lombardi, Y. Ma, S. R. Magnuson, B. Maqsodi, T. McDaniel, N. Mei, O. Myklebost, B. Ning, N. Novoradovskaya, M. S. Orr, T. W. Osborn, A. Papallo, T. A. Patterson, R. G.
Perkins, E. H. Peters, R. Peterson, et al.2006. The MicroArray Quality
Control (MAQC) project shows inter- and intraplatform reproducibility of gene expression measurements. Nat. Biotechnol.24:1151–1161.
28.Sing, T., O. Sander, N. Beerenwinkel, and T. Lengauer.2007. ROCR:
visu-alizing the performance of scoring classifiers.
29.Smyth, G. K.2005. Limma: linear models for microarray data, p. 397–420.In
R. Gentleman, V. Carey, S. R. Dudoit, R. Irizarry, and W. Huber (ed.), Bioinformatics and computational biology solutions using R and Bioconduc-tor. Springer, New York, NY.
30.Snyder, L. A. S., J. K. Davies, and N. J. Saunders.2004. Microarray
geno-motyping of key experimental strains ofNeisseria gonorrhoeaereveals gene complement diversity and five new neisserial genes associated with minimal mobile elements. BMC Genomics5:23.
31.Stabler, R. A., G. L. Marsden, A. A. Witney, Y. Li, S. D. Bentley, C. M. Tang,
and J. Hinds.2005. Identification of pathogen-specific genes through
mi-croarray analysis of pathogenic and commensalNeisseriaspecies. Microbi-ology151:2907–2922.
32.Tettelin, H., N. J. Saunders, J. Heidelberg, A. C. Jeffries, K. E. Nelson, J. A.
Eisen, K. A. Ketchum, D. W. Hood, J. F. Peden, R. J. Dodson, W. C. Nelson, M. L. Gwinn, R. DeBoy, J. D. Peterson, E. K. Hickey, D. H. Haft, S. L. Salzberg, O. White, R. D. Fleischmann, B. A. Dougherty, T. Mason, A. Ciecko, D. S. Parksey, E. Blair, H. Cittone, E. B. Clark, M. D. Cotton, T. R. Utterback, H. Khouri, H. Qin, J. Vamathevan, J. Gill, V. Scarlato, V. Masig-nani, M. Pizza, G. Grandi, L. Sun, H. O. Smith, C. M. Fraser, E. R. Moxon,
R. Rappuoli, and J. C. Venter.2000. Complete genome sequence ofNeisseria
meningitidisserogroup B strain MC58. Science287:1809–1815.
33.Volokhov, D., V. Chizhikov, K. Chumakov, and A. Rasooly.2003.
Microar-ray-based identification of thermophilicCampylobacter jejuni,C. coli,C. lari, andC. upsaliensis. J. Clin. Microbiol.41:4071–4080.
34.Willse, A., T. M. Straub, S. C. Wunschel, J. A. Small, D. R. Call, D. S. Daly,
and D. P. Chandler.2004. Quantitative oligonucleotide microarray
finger-printing ofSalmonella entericaisolates. Nucleic Acids Res.32:1848–1856.
35.You, Y., C. Fu, X. Zeng, D. Fang, X. Yan, B. Sun, D. Xiao, and J. Zhang.
2008. A novel DNA microarray for rapid diagnosis of enteropathogenic bacteria in stool specimens of patients with diarrhea. J. Microbiol. Methods 75:566–571.