R E S E A R C H A R T I C L E
Open Access
Mitochondrial respiration and redox coupling in
articular chondrocytes
Rachel S Lane
1,2, Yao Fu
1,2, Satoshi Matsuzaki
1, Michael Kinter
1,3, Kenneth M Humphries
1,2,3and Timothy M Griffin
1,2,3*Abstract
Introduction:Chondrocytes rely primarily on glycolysis to meet cellular energy needs, but recent studies implicate impaired mitochondrial function in osteoarthritis (OA) pathogenesis. Our objectives were to investigate the ability of chondrocytes to upregulate mitochondrial respiration when challenged with a nutrient stress and determine the effect on mediators of chondrocyte oxidative homeostasis.
Methods:Primary bovine chondrocytes were isolated and cultured in alginate beads. Mitochondrial respiration was stimulated by culturing cells with galactose-supplemented media for a period of 1 or 5 days. Metabolic flexibility was assessed by measuring metabolite and enzymatic biomarkers of glycolytic and mitochondrial metabolism. Oxidative homeostasis was assessed by measuring (1) cellular glutathione content and redox homeostasis, (2) rates of nitric oxide and superoxide production, and (3) the abundance and activity of cellular anti-oxidant proteins, especially the mitochondrial isoform of superoxide dismutase (SOD2). The regulatory role of hypoxia-inducible factor 2α(HIF-2α) in mediating the metabolic and redox responses was evaluated by chemical stabilization with cobalt chloride (CoCl2).
Results:After 5 days of galactose culture, lactate production and lactate dehydrogenase activity were reduced by 92% (P<0.0001) and 28% (P= 0.051), respectively. Conversely, basal oxygen consumption increased 35% (P= 0.042) without increasing mitochondrial content. Glutathione redox homeostasis was unaffected by galactose culture. However, the production of nitric oxide and superoxide and the expression and activity of SOD2 were significantly reduced after 5 days in galactose culture. Nuclear protein expression and gene expression of HIF-2α, a transcription factor for SOD2, were significantly downregulated (more than twofold;P<0.05) with galactose culture. CoCl2-mediated stabilization of HIF-2αduring the initial galactose response phase attenuated the reduction in SOD2 (P= 0.028) and increased cell death (P= 0.003).
Conclusions:Chondrocyte metabolic flexibility promotes cell survival during a nutrient stress by upregulating mitochondrial respiration and reducing the rate of reactive nitrogen and oxygen species production. These changes are coupled to a substantial reduction in the expression and activity of the mitochondrial anti-oxidant SOD2 and its pro-catabolic transcription factor HIF-2α, suggesting that an improved understanding of physiologic triggers of chondrocyte metabolic flexibility may provide new insight into the etiology of OA.
* Correspondence:tim-griffin@omrf.org 1
Free Radical Biology and Aging Program, Oklahoma Medical Research Foundation, MS 21, 825 NE 13th Street, Oklahoma City, OK 73104, USA
2
Department of Biochemistry and Molecular Biology, University of Oklahoma Health Sciences Center, 940 Stanton L. Young Blvd., BMSB 853, Oklahoma City, OK 73104, USA
Full list of author information is available at the end of the article
Introduction
The avascular environment of articular cartilage is gen-erally thought to restrict chondrocyte metabolism to relatively low rates of anaerobic glycolysis due to limits in the rate of oxygen and nutrient diffusion from the synovial fluid, particularly in the middle and deep cartilage zones [1-3]. In addition, the relatively low mitochondrial content and slow rates of respiration in chondrocytes may be considered adaptive for minimizing oxidative damage in long-lived post-mitotic cells [4]. These metabolic char-acteristics, however, do not appear to be wholly derived from the unique avascular cartilage environment and slow turnover of cells as they are also shared by mesenchymal stem cells (MSCs) [5]. MSCs are resistant to exposure to hypoxia or inhibition of mitochondrial respiration due to the strong reliance on anaerobic glycolysis for ATP pro-duction [5]. Thus, unlike many cells derived from MSCs that upregulate mitochondrial respiration during differen-tiation, chondrocytes appear to maintain a more undiffer-entiated MSC-like metabolic state [6].
The strong reliance on anaerobic glycolysis as the pri-mary ATP-producing pathway of cartilage raises questions about the metabolic role of mitochondria in chondrocytes [7,8]. Mitochondrial respiration is not limited by oxygen availability, because even at normoxic oxygen concentra-tions chondrocytes continue to primarily use glycolysis for ATP production [8-10]. However, under anoxic condi-tions, chondrocytes reduce the rate of anaerobic glycolysis, demonstrating a negative Pasteur effect [10]. Recent stud-ies suggest that the rate of glycolysis is dependent on at least a minimal flux of oxygen through the mitochondrial respiratory chain (MRC) to activate or stabilize glycolytic enzymes through MRC-derived reactive oxygen species (ROS) [11]. A better understanding of the relationship be-tween chondrocyte metabolism and ROS production will help elucidate the functional role of mitochondria in chondrocyte metabolism and may provide insight into how mitochondrial dysfunction contributes to osteoarth-ritis (OA) disease pathology.
OA cartilage is characterized by multiple forms of oxi-dative modifications to lipids, proteins, and nucleic acids [12,13]. Impaired MRC activity is implicated as a source of pathologic ROS production leading to oxidative stress in OA [8,14,15]. In healthy cartilage, pro-inflammatory cytokines and nitric oxide inhibit the activity of com-plexes I and IV of the MRC, respectively, suggesting that increased mitochondrial-ROS production is a downstream consequence of cellular inflammation [16-18]. In addition to increased ROS production, mitochondria may be more susceptible to ROS damage with OA due to an impaired anti-oxidant system. In particular, SOD2, the mitochon-drial isoform of superoxide dismutase, is downregulated in OA cartilage [8,19-21]. When SOD2 is silenced in healthy chondrocytes, cells accumulate malondialdehyde, a lipid
peroxidation product [8]. In addition, mitochondria respire closer to their maximal capacity and increase mitochon-drial proton leak [8]. This suggests that changes in the mitochondrial redox balance regulate mitochondrial respir-ation and perhaps overall cellular metabolism. Therefore, a better understanding of the relationship between cellular redox and metabolic flexibility in healthy chondrocytes may generate new insight into the role of altered metabol-ism in the pathogenesis of OA.
There were two goals of this study. First, we wanted to determine the capacity and mechanisms by which chon-drocytes upregulate mitochondrial respiration in response to a nutrient stress. Mitochondrial metabolism is an effi-cient means of producing ATP when metabolic substrates are limiting, and under growth or repair conditions, insuf-ficient MRC activity may lead to a depletion of cellular ATP levels [22]. Second, we wanted to determine the ef-fect of upregulating MRC activity on chondrocyte redox balance. Chondrocyte metabolism undergoes dynamic changes in response to inflammatory and mechanical stressors [23-27]. Understanding how chondrocyte redox homeostasis is affected during changes in cellular metab-olism independent of these additional stressors is import-ant for identifying potential metabolic origins of oxidative stress in OA.
We stimulated chondrocyte MRC activity by replacing glucose with galactose in the cell culture media of healthy primary bovine chondrocytes. Galactose creates a nutrient stress by requiring additional energy to convert to glucose. In mammalian cells, replacing glucose with galactose as the sole sugar source in the culture media is an effective strategy for stimulating mitochondrial oxidative phosphor-ylation and evaluating mitochondrial disorders and drug toxicity [28-30]. Here, we show how a galactose-induced metabolic stress stimulates chondrocyte MRC activity and impacts mitochondrial redox regulation.
Methods
Cell culture
Corporation, Lakewood, NJ, USA), in low-glucose DMEM culture media containing non-essential amino acids, HEPES (10 mM), 5% fetal bovine serum, and 100 U/mL penicillin-streptomycin and incubated overnight. Cells were strained through a 70-μm filter, counted, and assessed for viability by using trypan blue exclusion and a Cellometer AutoT4 cell counter (Nexcelom Bioscience, Lawrence, MA, USA). Finally, cells were re-suspeneded in 2.0% alginate 150 mM sodium chloride solution (pH 7.4) at 4 × 10⁶cells/mL. The cell solution was carefully pipet-ted into a 102 mM calcium chloride solution (pH 7.4) to encapsulate the cells in alginate beads. Beads were cul-tured in 6 mM glucose culture media or no-glucose, no pyruvate culture media enriched with 6 mM galactose for a period of up to 5 days. For 1-day galactose experiments, cells were maintained in glucose-supplemented media for 4 to 5 days prior to replacing with fresh glucose or galact-ose media, thereby minimizing differences in total culture duration. To compare the difference between galactose treatment and glycolysis inhibition on cell viability, we also cultured cells in 6 mM 2-deoxy-D-glucose (Sigma-Aldrich, St. Louis, MO, USA), a glucose analog that in-hibits glycolysis. To quantify HIF-2αnuclear expression, 200μM cobalt chloride (CoCl2) (ACROS Organics from
Thermo Fisher Scientific, Waltham, MA, USA) was added to the media 1 day prior to harvest [31]. Cells were digested out of alginate with 55 mM sodium citrate (pH 6) and tested for viability as previously described.
Cells were re-suspended in the following concentra-tions and buffers according to the following analyses: (1) cell respiration: 2 × 10⁶ cells/mL phosphate-buffered sa-line (PBS) (pH 7.4); (2) enzyme activity: 106 cells/mL 1.0 mM MOPS/10 mM EDTA (pH 7.4); (3) mRNA quantification: 107 cells/mL TRIzol; and (4) Western blot: 107cells/mL RIPA with 0.1% NP40 (pH 7.4). Pro-tein concentration for cell lysates was quantified by using the Pierce BCA protein assay (Thermo Fisher Scientific).
Cell respiration and mitochondrial staining
Chondrocyte respiration was measured by using a Clark-style oxygen electrode (Instech, Plymouth Meeting, PA, USA) in a temperature-regulated chamber set to 37°C (Hansatech Instruments Ltd, Norfolk, UK). The starting amount of molecular oxygen in the 0.6-mL electrode chamber was based on the assumption that 213 nmol/mL of molecular oxygen is dissolved at atmospheric pressure and 37°C. Basal respiration was measured as the average rate of unstimulated oxygen consumption. Maximal respir-ation was determined after stimulrespir-ation with 0.8μM FCCP, an electron transport chain uncoupler. Mitochondrial-specific oxygen consumption was determined by addition of cyanide. To evaluate mitochondrial content, cells were stained with Mitotracker Green FM (Molecular Probes
from Life Technologies) and fluorescent intensity was measured by using a FACSCalibur flow cytometer (BD Biosciences, San Jose, CA, USA). Data were analyzed by comparing the mean fluorescent intensity of glucose versus galactose-cultured cells by using FlowJo software. We also assessed mitochondrial content by using se-lected reaction monitoring (SRM) mass spectrometry to quantify the abundance of two mitochondrial reference proteins, ATP5B and VDAC1, as described in detail fur-ther below.
Metabolic and redox biomarkers and enzymatic activities Lactate dehydrogenase activity
Lactate dehydrogenase (LDH) activity was measured spec-trophotometrically as the rotenone-independent oxidation of 205 μM NADH to NAD+ (Agilent 8452A; Agilent Technologies, Santa Clara, CA, USA) by monitoring the decrease in A340nmin the presence of 10μg protein and
1.5 mM pyruvate (Sigma-Aldrich) in 25 mM MOPS buf-fer (pH 7.4). Activity was determined to be LDH specific by using 25 mM of the competitive inhibitor, oxamate (Sigma-Aldrich).
Superoxide dismutase activity
Total (tSOD) and manganese-specific (SOD2) SOD ac-tivity was determined spectrophotometrically (Sunrise™; Tecan US, Morrisville, NC, USA) in accordance with the instructions of the manufacturer (Cayman Chemicals Company, Ann Arbor, MI, USA).
Glucose and lactate measurement
Conditioned media was collected for measurement of glucose and lactate concentration by using a YSI 2300 STAT Plus Glucose and Lactate Analyzer (Yellow Springs Instruments, Yellow Springs, OH, USA). Conditioned media samples were standardized to plate-matched non-conditioned media blanks.
Nitric oxide measurement
Total nitrate and nitrite (NOx) secretion into the media
was measured by using the Greiss reaction as previously described [32].
Glutathione assessment
NAD+/NADH
The intracellular ratio of NAD+to NADH in cell lysates was measured by using an enzyme recycling reaction to quantitate NADH absorbance in accordance with the in-structions of the manufacturer (BioVision, Inc., Milpitas, CA, USA).
Energy charge
High-performance liquid chromatography (Shimadzu LC-20A High Precision Binary Gradient HPLC system; Shimadzu, Kyoto, Japan) and a UV/VIS diode array spectrometer were used to resolve and detect AMP, ADP, and ATP. The mobile phase consisted of 100 mM KH2PO4and 1.0 mM tetrabutylammonium sulfate (TBAS)
at pH 6.0 (buffer A) and CH3CN (buffer B) with a flow
rate of 1.0 mL/minute over an Eclipse Plus C18 column with 5μM diameter beads, 4.6 × 150 mM in length (Agi-lent Technologies). Adenylate nucleotides were separated by using the following step-wise gradients of buffer A/B: 96%/4% for 5 minutes, 85%/15% for 10 minutes, and 96%/ 4% for 5 minutes. Concentrations of ATP, ADP, and AMP were detected by absorption at 254 nm and quantified on the basis of the integrated area of standards. Energy charge was calculated by using the equation: ([ATP] + 0.5[ADP])/ ([ATP] + [ADP] + [AMP]).
Cellular free radical production
Superoxide production was assessed by electron para-magnetic resonance (EPR) spin-trapping using a cyclic hydroxylamine, CMH (1-hydroxy-3-methoxycarbonyl-2,2,5,5-tetramethylpyrrolidine) [33]. Chondrocytes were isolated as previously described and cultured in mono-layer for 3 days in glucose-supplemented culture media at 4.0 × 10⁴cells per well in a 48-well plate. Culture media were then replaced with either glucose- or galactose-supplemented DMEM culture media for 24 hours. After washing with PBS, adherent cells were incubated with 500μM CMH in the presence of 1 mM EDTA and 50μM DTPA in PBS at 37°C for 15 minutes. Reacted spin-traps were immediately snap-frozen in LN2after the incubation
period until the EPR measurement. High-density mono-layer culture was required in place of alginate bead culture to improve the rapid intra- and extra-cellular equilibration of the spin-trap and thereby maximize the signal to noise ratio.
The EPR spectra were obtained by using a Bruker EMX spectrometer (Bruker Corporation, Billerica, MA, USA) operating at X-band (approximately 9.78 GHz) with a 100 kHz modulation frequency and ER 41225SHQ high-sensitivity cavity. Typical settings for the spectrometer are microwave power, 6.325 mW; modulation amplitude, 1.5 G; scan range, 50 G; time constant, 82 ms. Thawed sample mixtures were transferred immediately to a quartz
flat-cell for the EPR determination. All of the EPR experi-ments were performed at room temperature.
RNA extraction, reverse transcription, and quantitative real-time polymerase chain reaction
Immediately after chondrocyte digestion from alginate beads, RNA was stabilized by using TRIzol in accord-ance with the instructions of the manufacturer (Life Technologies). A Qiagen First Strand cDNA kit (Qiagen, Hilden, Germany) was used to convert mRNA to cDNA in accordance with the instructions of the manufacturer. Primers for EPAS1, SOD2, SOD1, CAT, COL2, NOS2,
ACAN, PTGS2, MMP13, ADAMTS4, HIF1, TFAM,
PGC1A, RLPLO, GAPDH, B-Actin, and B2M were pur-chased from Qiagen’s validated RT2qPCR Primer Assays to quantify gene expression. A Bio-Rad CFX96 Real-Time Detection system (Bio-Rad Laboratories, Hercules, CA, USA) was used for amplification and quantification of amplicons. Target genes were standardized to the geometric mean of four housekeeping genes (RLPLO,
GAPDH, B-Actin, and B2M). Results were expressed as standardized gene expression (2−ΔCt) or gene expression of the galactose-treated sample normalized to the animal-matched glucose control.
Protein extraction and Western blot analysis
Quantitative mass spectrometry analysis
SRM mass spectrometry was used to quantify anti-oxidant protein expression as previously described [34]. Briefly, 3 pmol of equine serum albumin (ESA) was added to each 20-μg sample of chondrocyte protein as an internal stand-ard. The mixture was precipitated by acetone and sus-pended in Laemmli loading buffer. Samples were run in an SDS-PAGE gel to a distance of 1.5 cm. The entire lane was cut for each sample and divided into 1-mm3pieces, reduced with DTT, alkylated with iodoacetamide, and digested with trypsin. The peptides produced were ex-tracted from the gel by 50% methanol with 10% formic acid. The extract was evaporated to dryness and dissolved in 150 μL of 1% acetic acid for analysis. Samples were analyzed by using a TSQ Vantage triple quadrupole mass spectrometer (Thermo Fisher Scientific), operated in the SRM mode with a splitless nanoflow HPLC sys-tem (Eksigent, Dublin, CA, USA). Samples (10μL) were injected onto a 10 cm × 75 μm C18 capillary column. Data were processed by using Pinpoint to find and inte-grate the correct peptide chromatographic peaks. To quantify protein expression, the relative abundance of each protein was first normalized to the ESA internal standard and then normalized to the geometric mean of four stable cellular reference proteins: glyceraldehyde-3-phosphate dehydrogenase (GAPDH), peptidyl-prolyl isomerase A (PPIA), ribosomal protein S27a (RPS27A), and vimentin (VIM).
Statistical analyses
Statistical significance of galactose or CoCl2 treatment
was determined by paired two- or one-tailed Student’st tests, as appropriate. The effect of culture duration in addition to galactose treatment was determined by using a two-way analysis of variance with repeated measures for animal matching and Holm-Sidak’s multiple compar-isonspost hocanalysis. Significance was determined as a
P value of less than 0.05. Analyses were carried out by using Prism 6 (GraphPad Software Inc., San Diego, CA, USA). Results are reported as the mean ± standard error of the mean for at least three individual animals as spe-cified in the figure legends.
Results
Effect of galactose culture on chondrocyte metabolism
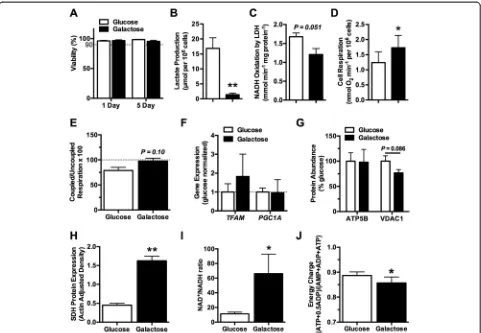
Culturing chondrocytes in either glucose- or galactose-supplemented media for 1 or 5 days did not alter cell viability (Figure 1A). However, galactose culture did sig-nificantly alter chondrocyte metabolism. After 1 day in galactose culture, lactate production decreased 54%, from 17.3 to 8.0 μmol per 106 cells (P <0.0001). After 5 days of galactose culture, both lactate production and maximal LDH activity were substantially reduced. Lactate production decreased by 92% (P<0.0001; Figure 1B), and
LDH activity was reduced by 28% (P= 0.051; Figure 1C). These results are consistent with a substantial reduction in glycolytic flux and a reduced reliance on glycolysis for cellular ATP production. Galactose treatment, however, was not equivalent to complete glycolytic inhibition. Cul-turing chondrocytes for 1 day in 2-deoxy-D-glucose, a glu-cose analog that inhibits glycolysis, caused a modest 8% increase in cell death compared with galactose culture.
Chondrocytes responded to the galactose-induced re-duction in glycolytic flux by increasing mitochondrial respiration. After 1 day in galactose culture, basal oxy-gen consumption increased 16% (P= 0.24), and by 5 days, basal oxygen consumption increased 40% (P= 0.042; Figure 1D). The increase in oxygen consumption with galactose culture was associated with a trend for cells re-spiring at a higher percentage of their maximal capacity compared with glucose-cultured cells (P= 0.10; Figure 1E). Five days in galactose culture did not increase the uncoupled (that is, maximal) rate of oxygen consumption (3.35 versus 3.51 μmol O2consumption mL−1min−1per
106cells in glucose versus galactose media, respectively;
P= 0.40), suggesting that galactose culture did not in-crease mitochondrial content. Consistent with this, we found that 1 day of galactose culture did not increase the expression of mitochondrial biogenesis transcription factors TFAM and PGC1A (Figure 1 F). Furthermore, after 5 days in galactose culture, the abundance of two mitochondrial-associated proteins, ATP5B and VDAC1, was not significantly altered (Figure 1G). However, the average intensity of Mitotracker staining showed a trend for an increase of approximately 50% between 1 and 5 days of galactose culture (P= 0.052). In addition, protein levels of succinate dehydrogenase (SDH), a Krebs cycle enzyme and component of complex II of the MRC, increased after 5 days in galactose culture (P= 0.003; Figure 1H). Thus, the increase in basal oxygen consumption after galactose culture appears to be driven primarily by increased mitochondrial oxygen consumption and electron trans-port flux rather than increased mitochondrial content, although specific mitochondrial proteins, such as SDH, are increased.
relative to the glucose culture condition (0.89 ± 0.01 versus 0.86 ± 0.02, glucose versus galactose; P= 0.048; Figure 1 J). Thus, replacing glucose with galactose as a carbohydrate source for 5 days induced a modest cellu-lar energetic stress. Overall, these findings indicate that, in response to a nutritional energetic stress, chondro-cytes upregulate mitochondrial metabolic pathways in an attempt to maintain energetic balance.
Effect of galactose culture on redox balance and anti-oxidant function
We next investigated the effect of a shift toward increased mitochondrial respiration on pro- and anti-oxidant path-ways affecting chondrocyte redox balance. One of the pri-mary ways that cells maintain redox balance is through
the synthesis of glutathione. Reduced glutathione (GSH) is a multi-faceted cellular anti-oxidant that directly reacts with free radicals, serves as a cofactor for glutathione per-oxidase, and reverses oxidative modifications by reducing disulfide bonds [37]. Total glutathione levels remained consistent between glucose and galactose culture condi-tions (Figure 2A). In addition, the ratio of reduced to oxi-dized glutathione (GSH/GSSG), an indicator of cellular redox balance, was also consistent between day 5 glucose and galactose conditions (Figure 2B). We next investigated the basal production of nitric oxide by measuring the levels of nitrite and nitrate (NOx) released into the media.
One day of galactose culture reduced NOx levels by 25%
(P= 0.053), and 5 days of galactose culture reduced NOx
[image:6.595.58.539.88.421.2]release by 80% (P <0.001) compared with paired glucose
controls (Figure 2C). Thus, although overall glutathione redox balance was unaffected by galactose, galactose-stimulated mitochondrial respiration significantly reduced the production of nitric oxide.
To further understand the effect of increased mito-chondrial respiration on chondrocyte redox regulation, we quantified the abundance of 12 cellular anti-oxidant proteins by using SRM mass spectrometry after 5 days of glucose or galactose culture (Figure 2D). This analysis showed that stimulating mitochondrial respiration re-duced the abundance of the mitochondrial isoform of superoxide dismutase, SOD2, by 83% (P<0.0001). Galact-ose treatment did not alter the abundance of any of the other anti-oxidant proteins. We further verified the reduc-tion in SOD2 protein levels by Western blot (Figure 2E) and gene expression (Figure 2 F). We then examined the effect of galactose culture on the total activity of
superoxide dismutase (tSOD) enzymes after 1 and 5 days of galactose culture. One day in galactose culture did not alter tSOD activity, and 5 days in galactose culture showed a trend for a reduction in tSOD activity (P= 0.07; Figure 2G). When the activity of SOD2 was specif-ically tested, we observed a 59% reduction in enzymatic activity after 5 days in galactose culture (P= 0.026; Figure 2H). Given that glutathione redox homeostasis was retained in galactose culture despite the significant reduction in SOD2 protein and activity, these findings suggest that reduced SOD2 capacity is coupled to a re-duction in superoxide (O2●−) production. We tested this
[image:7.595.56.539.89.398.2]prediction by using a cell-permeable chemical spin-trap to quantify the rate of superoxide production by EPR after 1 day of glucose or galactose culture (Figure 3A). These results showed that 1 day of galactose culture reduced the rate of superoxide production by 15%
Figure 2Galactose treatment downregulates nitric oxide production and the mitochondrial anti-oxidant SOD2 without altering oxidative homeostasis. (A)Cell glutathione content was not altered by 1 or 5 days of galactose culture (n = 4).(B)glutathione redox homeostasis was maintained after 5 days of galactose treatment (n = 4).(C)Five days of galactose culture significantly reduced nitrate and nitrite (NOx) release
(Figure 3B;P= 0.031). Thus, galactose-stimulated mito-chondrial respiration reduced the rate of cellular super-oxide production as well as the expression of the mitochondrial anti-oxidant enzyme SOD2.
Galactose-induced mitochondrial respiration downregulates hypoxia-inducible factor 2αand its target genes
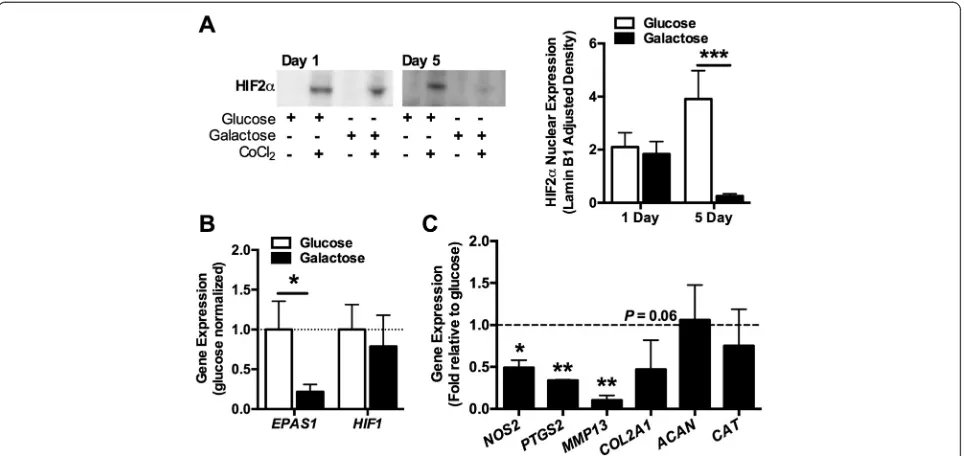
To better understand how a nutrient-induced shift toward mitochondrial respiration downregulates SOD2 expres-sion, we investigated the expression of the transcription factor HIF-2α. HIF-2αregulates the transcription of genes that coordinate cellular metabolic and anti-oxidant re-sponses during development and in response to metabolic and oxidative stresses, includingSOD2[38]. After 1 day in culture with CoCl2, which stabilizes HIF-2α[31], we
de-tected the nuclear expression of HIF-2αin both glucose-and galactose-fed cells (Figure 4A). However, after 5 days in galactose culture, HIF-2αnuclear expression was sig-nificantly reduced (Figure 4A). Gene expression of
EPAS1, the gene that encodes HIF-2α, was also signifi-cantly downregulated after 5 days of galactose culture (Figure 4B). HIF-1α gene expression, however, was un-changed after 5 days of galactose culture (P= 0.64; Figure 4B).
HIF-2αtranscriptionally regulates the expression of a number of pro-inflammatory and catabolic genes in chondrocytes, including NOS2, PTGS2, MMP13, and
ADAMTS4 [39,40]. After 5 days of galactose culture, the expression of NOS2,PTGS2, and MMP13was sig-nificantly reduced (Figure 4C), consistent with the downregulation in HIF-2α. ADAMTS4was detected in only two samples, although the fold reduction in ex-pression relative to glucose was substantial in both samples (0.15 and 0.07). The expression of cartilage extracellular matrix proteins COL2A1 and ACAN was
not significantly altered with galactose culture; how-ever, similar to the catabolic genes, COL2A1 mRNA expression trended lower (Figure 4C). We also exam-ined the expression of the anti-oxidant enzyme catalase (CAT), whose activity is significantly reduced in chon-drocytes after HIF-2α small interfering RNA (siRNA) treatment [41]. In the current study, galactose-induced downregulation of HIF-2αwas not associated with a re-duction inCATexpression.
We subsequently investigated how stabilizing HIF-2α affected the galactose-induced changes in redox and meta-bolic coupling. CoCl2 was added to the culture media
24 hours prior to harvesting cells cultured for 1 or 5 days in galactose- or glucose-supplemented media. After 1 day in galactose media, SOD2 expression decreased by 43% compared with the glucose controls (Figure 5A). CoCl2
treatment blocked this reduction in SOD2 levels in galactose-cultured cells (P= 0.028) without altering those in glucose-supplemented media (P= 0.55). After 5 days in galactose media, SOD2 expression was not altered by CoCl2 treatment (Figure 5A). These data suggest that
HIF-2α stabilization is sufficient to regulate the acute (1 day), but not the sustained (5 day), downregulation in SOD2 expression that occurs in response to upregulated mitochondrial respiration. We examined the effect of CoCl2treatment on SDH expression to evaluate how
sta-bilizing HIF-2α alters metabolic coupling. Unlike the ef-fects on SOD2 expression, CoCl2 treatment primarily
reduced the expression of SDH after 1 day of glucose cul-ture, with a trend for reduced expression with galactose culture as well (Figure 4B). These findings suggest that HIF-2α is a negative regulator of SDH expression inde-pendent of galactose treatment. Interestingly, we observed that the effect of CoCl2treatment on cell viability was
[image:8.595.58.540.89.216.2]reduced in chondrocytes cultured with galactose for 1 day but not 5 days (1-day viability: 93.7% ± 1.8% versus
87.3% ± 2.2%, − CoCl2 versus + CoCl2, P= 0.017; 5-day
viability: 97.3% ± 0.4% versus 95.6% ± 1.1%;−CoCl2
ver-sus + CoCl2; P= 0.053; Figure 5C). CoCl2treatment did
not alter cell viability in glucose culture at day 1 but caused a slight, albeit significant, reduction at day 5 (97.9% ± 0.7% versus 96.1% ± 1.0%; − CoCl2 versus + CoCl2; P= 0.025;
Figure 5C). Thus, stabilizing HIF-2α expression reduces cell viability, and the greatest effect is observed during an acute increase in mitochondrial respiration.
Discussion
Chondrocytes rely primarily on non-oxidative glycolysis to generate ATP for cellular energy [8,10,11]. Yet under conditions of glucose deprivation or glycolysis inhibition, chondrocytes increase oxygen consumption as a com-pensatory response to maintain ATP production via the MRC (that is,‘the Crabtree effect’) [9,42]. The ability of chondrocytes to respond to changes in substrate avail-ability by altering their reliance on glycolysis versus oxi-dative phosphorylation for ATP production is critical for cell survival and for maintaining extracellular matrix production [43,44]. However, the effect of this metabolic flexibility on other cellular functions, such as cellular oxidation and anti-oxidant defense pathways, is not well understood in chondrocytes.
In this study, we tested the ability of primary bovine chondrocytes to use oxidative phosphorylation to generate
ATP and maintain cell viability using a nutrient trigger to upregulate mitochondrial respiration in mammalian cells. This trigger—galactose—induced a metabolic stress in chondrocytes, as indicated by a modest reduction in the cellular energy charge and an increase in the ratio of NAD+ to NADH. In response to this stress, chondro-cytes increased their rate of oxygen consumption and upregulated the mitochondrial respiratory chain and Krebs cycle enzyme SDH. The increase in mitochondrial respiration did not alter the cellular redox balance, as indicated by a stable ratio of reduced to oxidized gluta-thione. However, galactose treatment did substantially reduce the production of nitric oxide, consistent with a negative relationship between mitochondrial respiration and nitric oxide production in chondrocytes [16,18,45]. Galactose treatment also significantly reduced the gen-eration of superoxide (O2●−), a reactive molecule rapidly
converted to hydrogen peroxide by the anti-oxidant en-zyme superoxide dismutase (SOD). We found that the mitochondrial isoform of SOD, SOD2, was selectively reduced after galactose treatment. These findings show that stimulating chondrocyte mitochondrial respiration has a profound impact on the production and consump-tion of cellular ROS, which results in the maintenance of redox homeostasis.
[image:9.595.58.540.89.317.2]The ability of a mitochondrial metabolic stimulus to induce substantial changes in SOD2 expression has
Figure 4Galactose-induced mitochondrial respiration reduces hypoxia-inducible factor 2α(HIF-2α) expression and signaling. (A)Nuclear expression of HIF-2αexpression was evaluated after 1 or 5 days of glucose versus galactose treatment. Twenty-four hours of cobalt chloride (CoCl2)
treatment stabilized HIF-2α. Five days of galactose treatment dramatically reduced the nuclear expression of HIF-2αin CoCl2-stabilized samples
important implications for understanding the origins of cartilage oxidative stress that occurs with aging and the development of OA. Several laboratories have reported that SOD2 expression is reduced in OA cartilage [8,19-21]. Gavriilidis and colleagues recently evaluated the association between a reduction in SOD2 expression and an in-crease in cartilage oxidation by depleting SOD2 in
[image:10.595.64.537.89.530.2]human articular chondrocytes using RNA interference [8]. They found that a loss of SOD2 induced lipid perox-idation and mitochondrial DNA strand breaks, verifying an inverse link between SOD2 levels and chondrocyte oxidation. Intriguingly, they also found that SOD2 de-pletion reduced the spare respiratory capacity and in-creased mitochondrial ATP turnover. Thus, the findings
Figure 5Stabilization of hypoxia-inducible factor 2α(HIF-2α) impairs acute galactose-induced redox coupling and cell viability. Chondrocytes were cultured in glucose- or galactose-supplemented media for 1 or 5 days and were treated with cobalt chloride (CoCl2) for the
final 24 hours to evaluate the effect of acute stabilization of HIF-2α.(A)CoCl2-mediated HIF-2αstabilization after 1 day of culture prevented the
galactose-induced reduction in superoxide dismutase 2 (SOD2) expression but had no effect on expression at 5 days or in any glucose culture condition (n = 3).(B)CoCl2treatment reduced succinate dehydrogenase (SDH) expression in 1-day glucose cultured cells and showed a trend for
reduced expression in galactose-treated samples at 1 and 5 days. Notably, CoCl2treatment prevented the upregulation in SDH expression after
of this and our current study show an inverse relation-ship between mitochondrial respiration and SOD2 ex-pression in chondrocytes.
This raises important questions about the extent to which metabolic stress signals contribute to OA risk by coupling the downregulation of SOD2 with increased mitochondrial respiration. OA cartilage is characterized by a reduction in the expression of several glycolytic enzymes and increased mitochondrial respiration under basal conditions [8,46]. Our finding that a nutrient-induced increase in mitochondrial respiration is coupled to a significant reduction in SOD2 expression may make chondrocytes more susceptible to oxidative damage. For example, well-established risk factors for OA, such as biomechanical trauma and increased levels of pro-inflammatory cytokines, damage chondrocytes in part by increasing the production of mitochondrial ROS [47-50]. Under acute stress, chondrocytes upregulate SOD2 expression to counteract increased ROS production via nuclear factor-kappa-B (NF-κB) signaling, which is the primary stress-responsive transcription factor regulating SOD2 expression [51,52]. Metabolic stress sensors, such as AMP-activated protein kinase (AMPK) [53] and sir-tuins [54], are potent anti-inflammatory mediators, in part through inhibition of NF-κB signaling. Thus, it is not clear whether the downregulation of SOD2 resulting from a nutrient stress makes chondrocytes more susceptible to oxidative damage, because NF-κB activation can also promote ROS production in a feed-forward manner.
Liu-Bryan and Terkeltaub recently reviewed the dual roles of AMPK and SIRT1 in linking cellular bioener-getic sensing to the regulation of transcriptional ‘go signals’ (for example, NF-κB, HIF-2α, and MTF1) that initiate pro-inflammatory chondrocyte reprogramming [55]. In chondrocytes, activation of AMPK and SIRT1 attenuates the catabolic response to pro-inflammatory and biomechanical stressors [56-59]. In our study, sus-tained galactose feeding for 5 days would be expected to activate AMPK because of the reduction in cellular en-ergy charge. Similarly, the increased ratio of NAD+ to NADH would be expected to drive the expression and activation of SIRT1. Consistent with an expected reduc-tion in pro-inflammatory mediators, the expression of
NOS2andPTGS2was significantly reduced after galactose culture. Our results suggest that a key pro-inflammatory
‘go signal’that is downregulated in response to a nutrient stress is HIF-2α.
HIF-2αis a redox-sensitive and stress-responsive tran-scription factor. It transactivates multiple gene targets involved in cellular anti-oxidant defense, including SOD2 [38], and is also a central regulator of endochondral ossifi-cation and articular cartilage matrix homeostasis [39,40,60]. HIF-2αpositively regulates the expression of genes that mediate chondrocyte hypertrophy, such as COL10A1,
MMP13, andVEGFA. These actions of HIF-2αare reca-pitulated during the pathogenesis of OA, where HIF-2α promotes cartilage catabolism by upregulating the expres-sion of pro-inflammatory and pro-hypertrophic genes in articular cartilage [39,40]. Although the stability of HIF-2α protein expression is regulated by oxygen-dependent hydroxylases, the activity of HIF-2α is regulated by post-translational reversible protein acetylation [61]. This sug-gests that HIF-2αis well suited to coordinate changes in cellular metabolic and redox status. Indeed, Bohensky and colleagues previously reported that silencing HIF-2α stim-ulated ROS production and activated a robust autophagic response [41]. Our findings show that stabilizing HIF-2α during an acute nutrient stress causes cell death, possibly by disrupting a pro-survival autophagic response. How-ever, after 5 days of galactose-stimulated mitochondrial respiration, CoCl2treatment did not reduce cell
viabil-ity. This may be due to the downregulation in EPAS1 expression, which could diminish the effectiveness of CoCl2to activate HIF-2α-mediated signaling.
Our study provides the first observation that HIF-2α expression is negatively associated with increased mito-chondrial metabolism in chondrocytes. This observation is important because it suggests that changes in cellular metabolism may directly mediate HIF-2α signaling. Ele-vated succinate levels promote HIFα stabilization by impairing oxygen-dependent prolyl hydroxylase activity, which targets HIFα for degradation [62,63]. In our study, galactose treatment significantly increased SDH expression in chondrocytes. An increase in the utilization of succinate to generate reducing equivalents for mitochondrial respir-ation would be expected to decrease succinate-mediated inhibition of prolyl hydroxylase activity, thereby promoting HIF-2α degradation. We also observed a decrease in
EPAS1 gene expression with galactose culture, indicat-ing that stimulatindicat-ing mitochondrial respiration downre-gulates HIF-2αthrough additional genetic mechanisms.
will likely require a more comprehensive understanding of the dynamic in vivo changes that occur in chondrocyte metabolic signaling and energetic flux during normal and pathologic conditions. Such knowledge may also lead to a better understanding of OA risk factors, such as with obesity-associated metabolic disease clustering and mito-chondrial DNA haplogroup variants [67,68].
Conclusions
Our findings show that chondrocyte metabolic flexibility promotes cell survival during periods of limited nutrient availability by upregulating mitochondrial respiration. The increase in mitochondrial metabolism is coupled to a substantial reduction in the expression and activity of the mitochondrial anti-oxidant SOD2 and its pro-catabolic transcription factor HIF-2α. Both SOD2 and HIF-2α undergo differential expression during the development of OA, initially being upregulated after acute inflammation and subsequently downregulated with disease progression [21,39-41,51]. Thus, an improved understanding of chon-drocyte metabolism during OA pathogenesis may lead to new insight into the etiology of OA and the development of metabolic-based therapeutic targets.
Abbreviations
AMPK:5′adenosine monophosphate-activated protein kinase; CAT: catalase; CMH: 1-hydroxy-3-methoxycarbonyl-2,2,5,5-tetramethylpyrrolidine; CoCl2: cobalt chloride; DMEM: Dulbecco’s modified Eagle’s medium;
EPR: electron paramagnetic resonance; ESA: equine serum albumin; GSH: reduced glutathione; HIF-2α: hypoxia-inducible factor 2α; LDH: lactate dehydrogenase; MRC: mitochondrial respiratory chain; MSC: mesenchymal stem cell; NF-κB: nuclear factor-kappa-B; NOx: nitrate + nitrite;
O2●−: superoxide; OA: osteoarthritis; PBS: phosphate-buffered saline;
ROS: reactive oxygen species; SDH: succinate dehydrogenase;
SOD: superoxide dismutase; SRM: selected reaction monitoring; tSOD: total activity of superoxide dismutase.
Competing interests
The authors declare that they have no competing interests.
Authors’contributions
RL shared responsibility for the conception and design of the study, the acquisition of the data, the analysis and interpretation of the data, and the drafting of the manuscript and helped to critically revise the manuscript for important intellectual content. KH shared responsibility for the conception and design of the study and for the analysis and interpretation of the data and helped to critically revise the manuscript for important intellectual content. TG shared responsibility for the conception and design of the study, the analysis and interpretation of the data, and the drafting of the manuscript and helped to critically revise the manuscript for important intellectual content. YF, SM, and MK shared responsibility for the acquisition of the data and for the analysis and interpretation of the data and helped to critically revise the manuscript for important intellectual content. All authors shared responsibility for final approval of the manuscript.
Acknowledgments
This work was supported by grants from the National Institutes of Health (RR018758 and GM103441) to TG, an Arthritis Foundation Arthritis
Investigator Award to TG, and a pre-doctoral scholarship from the Oklahoma Medical Research Foundation to RL. The authors thank the members of the Griffin Lab and the Free Radical Biology and Aging program for their assistance in the conducting this study, especially Michael Boeving for helping to modify the selective reaction monitoring mass spectrometry
protocol for use with bovine tissue. The authors thank Hui-Ying Lim, Ann Louise Olson, Scott Plafker, and Luke Szweda for many insightful discussions.
Author details
1Free Radical Biology and Aging Program, Oklahoma Medical Research
Foundation, MS 21, 825 NE 13th Street, Oklahoma City, OK 73104, USA.
2Department of Biochemistry and Molecular Biology, University of Oklahoma
Health Sciences Center, 940 Stanton L. Young Blvd., BMSB 853, Oklahoma City, OK 73104, USA.3Department of Geriatric Medicine, Reynolds Oklahoma
Center on Aging, University of Oklahoma Health Sciences Center, 975 NE 10th Street, BRC-1303, Oklahoma City, OK 73104, USA.
Received: 1 September 2014 Accepted: 19 February 2015
References
1. Stockwell RA. Biology of cartilage cells. Cambridge, UK: Cambridge University Press; 1979.
2. Zhou S, Cui Z, Urban JP. Factors influencing the oxygen concentration gradient from the synovial surface of articular cartilage to the cartilage-bone interface: a modeling study. Arthritis Rheum. 2004;50:3915–24.
3. Blanco FJ, Rego I, Ruiz-Romero C. The role of mitochondria in osteoarthritis. Nat Rev Rheumatol. 2011;7:161–9.
4. Finkel T, Holbrook NJ. Oxidants, oxidative stress and the biology of ageing. Nature. 2000;408:239–47.
5. Mylotte LA, Duffy AM, Murphy M, O’Brien T, Samali A, Barry F, et al. Metabolic flexibility permits mesenchymal stem cell survival in an ischemic environment. Stem Cells. 2008;26:1325–36.
6. Folmes CD, Dzeja PP, Nelson TJ, Terzic A. Metabolic plasticity in stem cell homeostasis and differentiation. Cell Stem Cell. 2012;11:596–606. 7. Lee RB, Urban JP. Functional replacement of oxygen by other oxidants in
articular cartilage. Arthritis Rheum. 2002;46:3190–200.
8. Gavriilidis C, Miwa S, von Zglinicki T, Taylor RW, Young DA. Mitochondrial dysfunction in osteoarthritis is associated with down-regulation of superoxide dismutase 2. Arthritis Rheum. 2013;65:378–87.
9. Otte P. Basic cell metabolism of articular cartilage. Manometric studies. Z Rheumatol. 1991;50:304–12.
10. Lee RB, Urban JP. Evidence for a negative Pasteur effect in articular cartilage. Biochem J. 1997;321:95–102.
11. Martin JA, Martini A, Molinari A, Morgan W, Ramalingam W, Buckwalter JA, et al. Mitochondrial electron transport and glycolysis are coupled in articular cartilage. Osteoarthritis Cartilage. 2012;20:323–9.
12. Henrotin Y, Blanco F, Aigner T, Kurz B. The significance of oxidative stress in articular cartilage ageing and degradation. Current Rheumatol Rev. 2007;3:261–74.
13. Gkretsi V, Simopoulou T, Tsezou A. Lipid metabolism and osteoarthritis: lessons from atherosclerosis. Prog Lipid Res. 2011;50:133–40.
14. Ding L, Heying E, Nicholson N, Stroud NJ, Homandberg GA, Buckwalter JA, et al. Mechanical impact induces cartilage degradation via mitogen activated protein kinases. Osteoarthritis Cartilage. 2010;18:1509–17. 15. Maneiro E, Martín MA, de Andres MC, López-Armada MJ, Fernández-Sueiro
JL, del Hoyo P, et al. Mitochondrial respiratory activity is altered in osteoarthritic human articular chondrocytes. Arthritis Rheum. 2003;48:700–8. 16. Maneiro E, López-Armada MJ, de Andres MC, Caramés B, Martín MA, Bonilla A, et al. Effect of nitric oxide on mitochondrial respiratory activity of human articular chondrocytes. Ann Rheum Dis. 2004;64:388–95.
17. López-Armada MJ, Caramés B, Martín MA, Cillero-Pastor B, Lires-Dean M, Fuentes-Boquete I, et al. Mitochondrial activity is modulated by TNFαand IL-1βin normal human chondrocyte cells. Osteoarthritis Cartilage. 2006;14:1011–22.
18. Johnson K, Jung A, Murphy A, Andreyev A, Dykens J, Terkeltaub R. Mitochondrial oxidative phosphorylation is a downstream regulator of nitric oxide effects on chondrocyte matrix synthesis and mineralization. Arthritis Rheum. 2000;43:1560–70.
19. Aigner T, Fundel K, Saas J, Gebhard PM, Haag J, Weiss T, et al. Large-scale gene expression profiling reveals major pathogenetic pathways of cartilage degeneration in osteoarthritis. Arthritis Rheum. 2006;54:3533–44. 20. Ruiz-Romero C, Calamia V, Mateos J, Carreira V, Martinez-Gomariz M,
superoxide dismutase points to a redox imbalance. Mol Cell Proteomics. 2009;8:172–89.
21. Scott JL, Gabrielides C, Davidson RK, Swingler TE, Clark IM, Wallis GA, et al. Superoxide dismutase downregulation in osteoarthritis progression and end-stage disease. Ann Rheum Dis. 2010;69:1502–10.
22. Johnson K, Svensson CI, Etten DV, Ghosh SS, Murphy AN, Powell HC, et al. Mediation of spontaneous knee osteoarthritis by progressive chondrocyte ATP depletion in Hartley guinea pigs. Arthritis Rheum. 2004;50:1216–25. 23. Shikhman AR, Brinson DC, Valbracht J, Lotz MK. Cytokine regulation of
facilitated glucose transport in human articular chondrocytes. J Immunol. 2001;167:7001–8.
24. Shikhman AR, Brinson DC, Lotz MK. Distinct pathways regulate facilitated glucose transport in human articular chondrocytes during anabolic and catabolic responses. Am J Physiol Endocrinol Metab. 2004;286:E980–5. 25. Phillips T, Ferraz I, Bell S, Clegg PD, Carter SD, Mobasheri A. Differential regulation of
the GLUT1 and GLUT3 glucose transporters by growth factors and pro-inflammatory cytokines in equine articular chondrocytes. Vet J. 2005;169:216–22. 26. Rosa SC, Gonçalves J, Judas F, Mobasheri A, Lopes C, Mendes AF. Impaired
glucose transporter-1 degradation and increased glucose transport and oxidative stress in response to high glucose in chondrocytes from osteoarthritic versus normal human cartilage. Arthritis Res Ther. 2009;11:R80. 27. Lee RB, Wilkins RJ, Razaq S, Urban JP. The effect of mechanical stress on
cartilage energy metabolism. Biorheology. 2002;39:133–43. 28. Le Goffe C, Vallette G, Jarry A, Bou-Hanna C, Laboisse CL. The in vitro
manipulation of carbohydrate metabolism: a new strategy for deciphering the cellular defence mechanisms against nitric oxide attack. Biochem J. 1999;344:643–8. 29. Rossignol R, Gilkerson R, Aggeler R, Yamagata K, Remington SJ, Capaldi RA.
Energy substrate modulates mitochondrial structure and oxidative capacity in cancer cells. Cancer Res. 2004;64:985–93.
30. Gohil VM, Sheth SA, Nilsson R, Wojtovich AP, Lee JH, Perocchi F, et al. Nutrient-sensitized screening for drugs that shift energy metabolism from mitochondrial respiration to glycolysis. Nat Biotechnol. 2010;28:249–55. 31. Mobasheri A, Platt N, Thorpe C, Shakibaei M. Regulation of 2-deoxy-D-glucose
transport, lactate metabolism, and MMP-2 secretion by the hypoxia mimetic cobalt chloride in articular chondrocytes. Ann N Y Acad Sci. 2006;1091:83–93.
32. Fermor B, Weinberg JB, Pisetsky DS, Misukonis MA, Banes AJ, Guilak F. The effects of static and intermittent compression on nitric oxide production in articular cartilage explants. J Orthop Res. 2001;19:729–37.
33. Dikalov SI, Kirilyuk IA, Voinov M, Grigor’ev IA. EPR detection of cellular and mitochondrial superoxide using cyclic hydroxylamines. Free Radic Res. 2011;45:417–30.
34. Rindler PM, Plafker SM, Szweda LI, Kinter M. High dietary fat selectively increases catalase expression within cardiac mitochondria. J Biol Chem. 2013;288:1979–90.
35. Bishop PD, Atkinson DE. Adenine nucleotide control of the rate of oxygen uptake by rat heart mitochondria over a 15- to 20-fold range. Arch Biochem Biophys. 1984;230:335–44.
36. Oakhill JS, Steel R, Chen ZP, Scott JW, Ling N, Tam S, et al. AMPK is a direct adenylate charge-regulated protein kinase. Science. 2011;332:1433–5. 37. Sies H. Glutathione and its role in cellular functions. Free Radic Biol Med.
1999;27:916–21.
38. Scortegagna M, Ding K, Oktay Y, Gaur A, Thurmond F, Yan L-J, et al. Multiple organ pathology, metabolic abnormalities and impaired homeostasis of reactive oxygen species in Epas1-/- mice. Nat Genet. 2003;35:331–40. 39. Yang S, Kim J, Ryu J-H, Oh H, Chun C-H, Kim BJ, et al. Hypoxia-inducible
factor-2alpha is a catabolic regulator of osteoarthritic cartilage destruction. Nat Med. 2010;16:687–93.
40. Saito T, Fukai A, Mabuchi A, Ikeda T, Yano F, Ohba S, et al. Transcriptional regulation of endochondral ossification by HIF-2αduring skeletal growth and osteoarthritis development. Nat Med. 2010;16:678–86.
41. Bohensky J, Terkhorn SP, Freeman TA, Adams CS, Garcia JA, Shapiro IM, et al. Regulation of autophagy in human and murine cartilage: hypoxia-inducible factor 2 suppresses chondrocyte autophagy. Arthritis Rheum. 2009;60:1406–15.
42. Heywood HK, Knight MM, Lee DA. Both superficial and deep zone articular chondrocyte subpopulations exhibit the Crabtree effect but have different basal oxygen consumption rates. J Cell Physiol. 2010;223:630–9. 43. Heywood HK, Bader DL, Lee DA. Rate of oxygen consumption by isolated
articular chondrocytes is sensitive to medium glucose concentration. J Cell Physiol. 2005;206:402–10.
44. Heywood HK, Nalesso G, Lee DA, Dell’Accio F. Culture expansion in low-glucose conditions preserves chondrocyte differentiation and enhances their subsequent capacity to form cartilage tissue in three-dimensional culture. Biores Open Access. 2014;3:9–18.
45. Tomita M, Sato EF, Nishikawa M, Yamano Y, Inoue M. Nitric oxide regulates mitochondrial respiration and functions of articular chondrocytes. Arthritis Rheum. 2001;44:96–104.
46. Ruiz-Romero C, Carreira V, Rego I, Remeseiro S, López-Armada MJ, Blanco FJ. Proteomic analysis of human osteoarthritic chondrocytes reveals protein changes in stress and glycolysis. Proteomics. 2008;8:495–507.
47. DelCarlo M, Loeser RF. Chondrocyte cell death mediated by reactive oxygen species-dependent activation of PKC-betaI. Am J Physiol Cell Physiol. 2006;290:C802–11.
48. Goodwin W, McCabe D, Sauter E, Reese E, Walter M, Buckwalter JA, et al. Rotenone prevents impact-induced chondrocyte death. J Orthop Res. 2010;28:1057–63.
49. Cao Y, Zhang X, Shang W, Xu J, Wang X, Hu X, et al. Proinflammatory cytokines stimulate mitochondrial superoxide flashes in articular chondrocytes in vitro and in situ. PLoS One. 2013;8:e66444.
50. Brouillette MJ, Ramakrishnan PS, Wagner VM, Sauter EE, Journot BJ, McKinley TO, et al. Strain-dependent oxidant release in articular cartilage originates from mitochondria. Biomech Model Mechanobiol. 2014;13:565–72. 51. Mathy-Hartert M, Hogge L, Sanchez C, Deby-Dupont G, Crielaard JM,
Henrotin Y. Interleukin-1βand interleukin-6 disturb the antioxidant enzyme system in bovine chondrocytes: a possible explanation for oxidative stress generation. Osteoarthritis Cartilage. 2008;16:756–63.
52. Miao L, Clair DKS. Regulation of superoxide dismutase genes: implications in disease. Free Radic Biol Med. 2009;47:344–56.
53. O’Neill LA, Hardie DG. Metabolism of inflammation limited by AMPK and pseudo-starvation. Nature. 2013;493:346–55.
54. Chalkiadaki A, Guarente L. Sirtuins mediate mammalian metabolic responses to nutrient availability. Nat Rev Endocrinol. 2012;8:287–96.
55. Liu-Bryan R, Terkeltaub R. Emerging regulators of the inflammatory process in osteoarthritis. Nat Rev Rheumatol. 2015;11:35–44.
56. Terkeltaub R, Yang B, Lotz M, Liu-Bryan R. Chondrocyte AMP-activated protein kinase activity suppresses matrix degradation responses to proinflammatory cytokines interleukin-1βand tumor necrosis factorα. Arthritis Rheum. 2011;63:1928–37.
57. Petursson F, Husa M, June R, Lotz M, Terkeltaub R, Liu-Bryan R. Linked decreases in liver kinase B1 and AMP-activated protein kinase activity modulate matrix catabolic responses to biomechanical injury in chondrocytes. Arthritis Res Ther. 2013;15:R77.
58. Moon M-H, Jeong J-K, Lee Y-J, Seol J-W, Jackson CJ, Park S-Y. SIRT1, a class III histone deacetylase, regulates TNF-α-induced inflammation in human chondrocytes. Osteoarthritis Cartilage. 2013;21:470–80.
59. Matsuzaki T, Matsushita T, Takayama K, Matsumoto T, Nishida K, Kuroda R, et al. Disruption of Sirt1 in chondrocytes causes accelerated progression of osteoarthritis under mechanical stress and during ageing in mice. Ann Rheum Dis. 2014;73:1397–404.
60. Thoms BL, Murphy CL. Inhibition of hypoxia-inducible factor-targeting prolyl hydroxylase domain-containing protein 2 (PHD2) enhances matrix synthesis by human chondrocytes. J Biol Chem. 2010;285:20472–80.
61. Dioum EM, Chen R, Alexander MS, Zhang Q, Hogg RT, Gerard RD, et al. Regulation of hypoxia-inducible factor 2 signaling by the stress-responsive deacetylase sirtuin 1. Science. 2009;324:1289–93.
62. Selak MA, Armour SM, MacKenzie ED, Boulahbel H, Watson DG, Mansfield KD, et al. Succinate links TCA cycle dysfunction to oncogenesis by inhibiting HIF-αprolyl hydroxylase. Cancer Cell. 2005;7:77–85.
63. Koivunen P, Hirsila M, Remes AM, Hassinen IE, Kivirikko KI, Myllyharju J. Inhibition of Hypoxia-Inducible Factor (HIF) hydroxylases by citric acid cycle intermediates: possible links between cell metabolism and stabilization of HIF. J Biol Chem. 2007;282:4524–32.
64. McNeill JN, Wu C-L, Rabey KN, Schmitt D, Guilak F. Life-long caloric restriction does not alter the severity of age-related osteoarthritis. Age (Dordr). 2014;36:9669.
65. Smith GK, Paster ER, Powers MY, Lawler DF, Biery DN, Shofer FS, et al. Lifelong diet restriction and radiographic evidence of osteoarthritis of the hip joint in dogs. J Am Vet Med Assoc. 2006;229:690–3.
67. Sowers M, Karvonen-Gutierrez CA, Palmieri-Smith R, Jacobson JA, Jiang Y, Ashton-Miller JA. Knee osteoarthritis in obese women with cardiometabolic clustering. Arthritis Rheum. 2009;61:1328–36.
68. Rego-Pérez I, Fernández-Moreno M, Fernández-López C, Arenas J, Blanco FJ. Mitochondrial DNA haplogroups: role in the prevalence and severity of knee osteoarthritis. Arthritis Rheum. 2008;58:2387–96.
Submit your next manuscript to BioMed Central and take full advantage of:
• Convenient online submission
• Thorough peer review
• No space constraints or color figure charges
• Immediate publication on acceptance
• Inclusion in PubMed, CAS, Scopus and Google Scholar
• Research which is freely available for redistribution