1
Citation:
O'Kelly, B.C. and Sivakumar, V. (2014) Water content determinations for peat
and other organic soils using the oven-drying method.
Drying Technology: An
International Journal
, Vol. 32, 13 pp.
http://dx.doi.org/10.1080/07373937.2013.849728
Water Content Determinations for Peat and Other Organic Soils Using the
Oven-drying Method
Brendan C. O’Kelly (corresponding author) PhD, FTCD
Associate Professor,
Department of Civil, Structural and Environmental Engineering, Museum Building, Trinity College Dublin, Dublin 2, Ireland.
E-mail: [email protected] Tel. +353 1896 2387 Fax. +353 1677 3072
Vinayagamoothy Sivakumar PhD, DSc
Reader in Geotechnical Engineering,
School of Planning, Architecture and Civil Engineering, David Keir Building, Queen’s University Belfast, Belfast, UK.
E-mail: [email protected]
Submitted for possible publication in Drying Technology
First submission: 24th June 2013 Resubmitted: 23rd September 2013 Accepted in full: 25th September 2013
Published in Drying Technology: An International Journal, 2013, Vol. 32, 13 pp. http://dx.doi.org/10.1080/07373937.2013.849728
2 Abstract
There has been much debate in literature over the past 60 years regarding an appropriate oven-drying temperature for water content determinations on peat and other organic soils. For inorganic soils, the water content is usual based on the equilibrium dry mass corresponding to drying temperatures in the range 100–110oC. However, for peat and other organic soils, several researchers have recommended lower drying temperatures in the range 60−90oC in an attempt to prevent possible charring, oxidation and (or) vaporization of substances other than pore water. However, all of the relevant water is not fully evaporated at too low a temperature, and since specimen dry mass is a function of drying temperature, resulting water content values are lower than those determined for the temperature range 100−110oC. Experimental data reported in this paper show that oven drying of peat and other organic soils at 100–110oC using either gravity–convection or forced-draft ovens is acceptable for routine water content determinations. Since a standardized oven temperature is desirable when correlating water content with other material properties, it is recommended that oven drying of peat and other organic soils be performed over temperature ranges of either 105–110°C or 105±5°C, in line with standardized ranges for inorganic soils.
Key words: moisture content; oxidation; soil; standards; thermal characterization
Notation
a water content (as %) for sur = 1 kPa
b gradient of log w–log sur correlation
LL liquid limit
LOI loss on ignition
ref m and
C
mto equilibrium dry masses for a reference temperature and lower drying
temperature of t oC respectively
PL plastic limit
ur
s saturated remolded undrained shear strength
w gravimetric water content (as %)
C 80o
w ,
C 105o
w water content values for drying temperatures of 80oC and 105oC respectively
C
o
t
w dimensionless water content value for drying temperature of t oC
water content parameter
C 105o
and 110oC water content parameter values for reference temperatures of 105oC and 110oC respectively
gradient of parameter against drying temperature trend line C
105o
and
C 110o
3 INTRODUCTION
Peat (mire) deposits cover large areas of the world’s landmass and are formed by the gradual accumulation of the remains of dead plant vegetation at various stages of decomposition, under waterlogged conditions.[1,2] By their very nature, peat and other organic soils usually have extremely high water (moisture) content, which is a most significant physical characteristic since its value can be determined by a routine test and related to the likely engineering performance.[2,3] In geotechnical literature, and also adopted in this paper, the water content (w) is defined as the mass ratio of the pore water phase to solids phase, expressed as a percentage. The oven-drying method is the definitive procedure used in standard laboratory practice for water content determinations on soils. The oven-drying temperature and period adopted for the removal of water are of great importance, influencing the measurement result since different physical states are produced. The same is also true for other biological materials, as reported, for example, in studies on foods[4–6], pharmaceuticals,[7] fibers,[4] fuels[4,8] and animal manure,[9] although pertinent drying temperature ranges may be different.
For geotechnical engineering applications, industry-standard water content determinations require the removal of all pore water (i.e. excluding adsorbed water on the surface of the solids and any water of crystallization). For inorganic soils, this is achieved by oven drying representative specimens at 105±5°C according to ASTM D2974,[10] or 105–110°C according to British Standard BS1377–2,[11] since complete evaporation of the pore water occurs at 100oC. The standard requires that the drying process is continued for at least 16 h, or longer periods as necessary, until the difference in successive weighing of the specimen over a 4-h interval does not exceeding 0.1% of the initial wet specimen mass.[11] Above 100°C, further reductions in the equilibrium dry mass of an organic test-specimen may occur due to charring and oxidation of susceptible organic matter and (or) vaporization of substances other than pore water.[3] These substances should not be removed from the specimen during the course of water content tests. In the case of fibrous peats, McFarlane and Allen[3] and Hosang and Locker[12] reported that some charring of organic matter occurs at these elevated temperatures, with the commencement of charring occurring over the temperature range 80– 90oC. By contrast, at too low a temperature, full evaporation of the pore water is not complete. The material’s drying characteristics are dependent on the physical and chemical manner in which the pore water is held by the peat substance.[3]
4
pore water may remain within the test specimen.[20] This residual pore water remaining within the dried test-specimen may introduce a larger error in the measured value of water content, compared with that potentially caused by some charring, oxidation and (or) vaporization of substances other than water at higher oven temperatures.[20] For instance, O’Kelly[20] reported that in the case of a municipal sewage sludge material studied, water contents determined on the basis of a drying temperature of 60oC introduced a larger error, compared with 105±5°C. Hence what is potentially compromised by this disparity of approach is the ability to meaningfully compare the results obtained from different studies, especially for temperature-sensitive materials.
On the other hand, Hobbs[1] and Skempton and Petley[21] and have reported that oven drying of peat and other organic soils at 105°C or, more generally, at a temperature between 100°C and 110°C is acceptable for routine water content determinations. The ASTM standard test method for water content determinations on peat and other organic soils (ASTM D2974)[10] also specifies an oven-drying temperature of 105±5°C.
Another consideration is that the drying period necessary to achieve the equilibrium dry mass condition increases for lower drying temperatures, with large volume and (or) very wet test-specimens of soil requiring substantially longer periods for the specimen dry mass to achieve equilibrium. The same is true for drying of other materials; e.g., Kardum et al.[7] reported slower rates and longer drying periods were achieved at lower temperatures for convective drying of a pharmaceutical product over the range 40–60°C. In the case of peat, for example, one day is usually required to achieve an equilibrium state at 105°C[21], two days at 80– 85°C[3] and at least three days for 60oC.[22]
Given the conflicting viewpoints summarized above, the aims of the present study are:
1. For a wide range of peats and other organic soils, investigate the drying rate and period required to achieve equilibrium mass for different oven temperatures;
2. Determine a suitable drying temperature for water content determinations on peat and other organic soils;
3. Study the significance of oven-drying temperature on experimental correlations between water content and some mechanical properties.
5
For the three pseudo-fibrous peats, the significance of adopting different oven-drying temperatures is considered in terms of their impact on interpolated geotechnical index values and also on water content–undrained strength correlations. To our knowledge, this is one of the first studies investigating such effects. Water content profiles (determined for different oven-drying temperatures) against depth below ground surface level are also reported for an intact peat deposit and the significance of oven temperature for routine water content determinations discussed in the context of the natural heterogeneity and very or extremely high values of natural water content, ranging from a few hundred per cent to greater than 2000%.[1, 23]
MATERIAL AND METHODS
Materials
Oven-drying tests were performed on pseudo-fibrous peat materials obtained from below the groundwater table at Ballydermot raised bog (County Kildare), Clara raised bog (County Offaly) and Derrybrien blanket bog (County Galway), Ireland. In this paper, these materials are denoted by B, Cn and D respectively. Using ASTM D4427,[24] the Ballydermot peat material was categorized as fibric to hemic, low to medium ash, moderately acidic,
Sphagnum–Carex–Cladium–Alnus–Betula–Phragmites peat. The Clara peat material was comprised of slightly decomposed Sphagnum, and included some Sedge interspersed with plant and shrub (Calluna) remnants, along with a small amount of woody fibers provided by the shrub rootlets. The Derrybrien peat material was comprised of slightly-to-moderately decomposed Carex–Eriophorum–Phragmites peat, with mainly Carex and Phragmites coarse fibers, Eriophorum fine fibers and a small amount of wood (shrub) remnants. According to the modified von Post peat classification system,[25] the Ballydermot peat deposit was classified as SCWPh–H4–7–B3–4–F2–R2–W1, the Clara peat material as SCN–H4–B3–F3(S)– R1(N)–W1(N), and the Derrybrien peat material as CErPh–H3–4–B4–F(Er)2–R(CPh)3–W1. Full descriptions of these peat deposits and their geotechnical properties have been reported for the Ballydermot site by Pichan and O'Kelly[26,27] and O’Kelly and Pichan,[23] for the Clara site by O’Kelly and Zhang[28] and Zhang and O’Kelly,[29,30] and for the Derrybrien site by AGEC.[31]
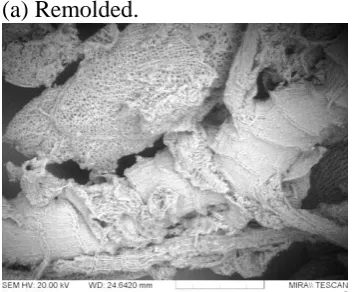
Refined Clara peat material (denoted by Cr) was also prepared for oven-drying tests by blending some of the remolded peat material using an electric handheld blender. Comparing the drying characteristics of the remolded and blended materials would allow investigation of the effect of the coarse fiber inclusions on the drying response. Scanning electron micrographs of these materials taken at the same magnification (Fig. 1) show the coarse fibers in the remolded material compared with the short serrated fibers and cellular-spongy matrix in the refined material.
INSERT Figure 1.
6
limit (LL) values were determined using the 80g–30o fall-cone LL apparatus,[11] the plastic limit (PL) using the Casagrande thread-rolling method and the specific gravity of solids using the small picnometer method. The LL and PL values correspond to the water contents at the state transitions between the liquid and plastic states and the plastic and semi-solid states respectively. The plasticity index is calculated as the numeric difference between measured
LL and PL values and gives the range of water contents over which the material behaves plastically. The loss on ignition (LOI) values were determined by igniting specimens of the powdered test materials (previously oven-dried at 105oC to achieve equilibrium dry mass) in a muffle furnace at 440oC over an 18-h period. The pH was determined using an electric pH meter. All of these tests were performed in accordance with British Standard BS1377–2.[11,32] Coarse peat fibers were separated from the bulk material by washing representative specimens on the 150-μm sieve (as specified by ASTM D1997[33]), with the fiber content value determined by expressing the oven-dried mass of the retained material as a percentage of the specimen total dry mass at 105°C. Note the PL condition could not be achieved for the Ballydermot and Clara peats, in that uniform soil threads could not be rolled out to 3-mm in diameter without crumbling/breaking on account of scale effects related to the fibrous particles.[27–29] Hence these materials were reported as non-plastic. In practice, however, the wet peats are readily remolded and therefore plastic.
INSERT Table 1.
Methods
Materials for the oven-drying tests was prepared by thorough remolding the peat samples, removing any woody chunks, and sub-dividing remaining material to obtain homogeneous test-specimens, each nominally 50 g in wet mass. These specimens were then placed in tarred aluminum cups, 53 mm in diameter by 34 mm high; similar to those used in performing standard fall-cone LL tests in accordance with British Standard BS1377–2.[11]
The equilibrium dry mass of each test-specimen was determined for set oven temperatures, commencing with 80oC, and increasing in six steps up to a maximum drying temperature of 110oC. In this manner, the effects of increasing temperature on the specimen dry mass could be investigated along with drying period for discrete temperatures within this oven temperature range. During the course of the drying tests, the specimens were periodically removed from the oven chamber and cooled in a desiccator to ambient laboratory temperature before recording the specimen masses to 0.01 g. The drying process was then continued by placing the specimens back in the same locations within the oven chamber. A similar methodology was employed by O’Kelly[20,34]
in earlier work performed to investigate the oven-drying characteristic of soils.
7
one specimen from each material set was put aside and examined under a Leica DM1000 microscope camera (supplied by Leica Microsystems GmbH, Wetzlar, Germany) at 46 magnifications for evidence of charring of the peat fibers having occurred at that particular temperature value. These images, taken at a resolution of 0.01 mm per pixel, were compared against control specimens that had been allowed to air dry over an extended period to achieve equilibrium dry mass at ambient laboratory temperature. For the first and second series of tests described above, a gravity– convection oven (Memmert Universal oven model UNB 100 supplied by Memmert GmbH, Schwabach, Germany) with a 14-litre chamber capacity and providing thermostatic control of the chamber temperature within ±1.5oC was used.
In a third series of drying tests, a forced-draft oven was used in parallel with the gravity– convection oven to investigate whether the method of air circulation within the oven chamber produced a significant difference in the specimen equilibrium dry mass as well as the drying period required to achieve an equilibrium condition for an oven temperature of 105oC. A 133-litre chamber forced-draft oven (model N150CF, with rated power of 1500 W, supplied by ELE International, Bedfordshire, England) provided thermostatic control of the oven temperature within ±1oC, which was calibrated using an alcohol thermometer.
Correlations between water content and remolded strength were also determined to investigate the significance of differences in oven-drying temperature. Strength data covering the full plastic range were determined using the British Standard 80g–30o fall cone LL
apparatus[11] and also undrained triaxial compression tests. In the fall-cone tests, the undrained strength of very soft peat material was assessed in terms of the measured cone penetration depth (see O’Kelly[35]). This also allowed determination of the liquid limit (LL) values for the different materials and the significance of oven temperature. In the triaxial tests, 38-mm diameter by 76-mm high test-specimens of very soft to stiff consistency peat material were sheared at an axial strain rate of 2.0%/min under an applied cell pressure of 100 kPa. These specimens all failed by general ductile bulging, with the undrained shear strength determined as half of the peak deviatoric stress (generally mobilized between 20% and 30% axial strain), with a correction applied for the restraining effect of the rubber membrane enclosing the test-specimen.[36] The water content values of the test-specimens were measured for an oven-drying temperature of 105oC.
RESULTS AND DISCUSSION
Sensitivity of Specimen Dry Mass to Drying Period and Temperature
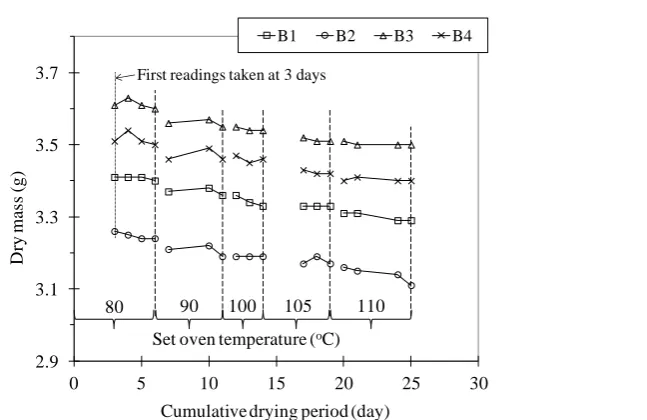
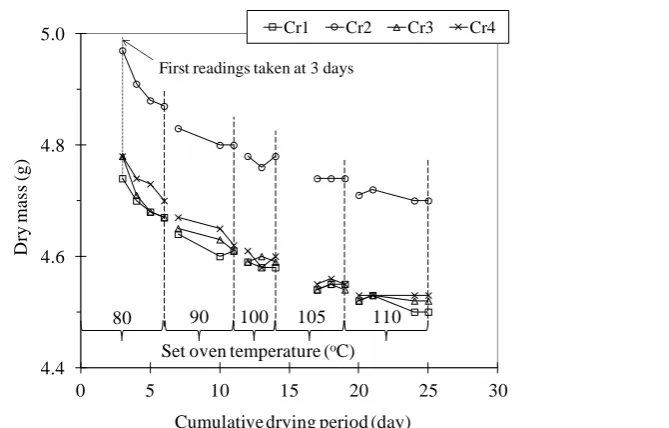
Figure 2 shows recorded dry masses for four specimens of each test material, plotted against cumulative drying period for set temperatures, increasing in steps over the range 80–110oC. As expected, these data show a trend of decreasing specimen dry mass with both increasing drying period and oven temperature.
8
The sensitivity of the specimen dry mass to increasing oven temperature and drying period is considered for the test-materials in Fig. 3. The data are also expressed in terms of the dimensionless parameter , and plotted against oven temperature in Fig. 4: where is the water content parameter,[20] defined as:
C
m m
o
t ref
(1)
with mref and mtoC denoting the specimen equilibrium dry masses corresponding to a
reference oven temperature and lower drying temperature of t oC respectively.
Note C 105o
and C 110o
refer to reference temperatures of 105oC and 110oC respectively. For drying temperatures below the reference temperature, ≤ 1, with a value of unity indicating a temperature-insensitive material for the range considered.
INSERT Figure 3. INSERT Figure 4.
From a full literature review, oven drying data were identified for another 18 organic soils which are included in this study to provide a sufficiently large database for further analysis, with aim of determining a suitable drying temperature range for routine water content determinations on peat and other organic soils. The soils considered were fibrous, pseudo-fibrous and amorphous peats; organic silts, clays and muds, and municipal sewage sludge material (see Table 2). These had wide botanical diversity and large ranges in fiber and organic content values (LOI = 5.5–99%), although reported geotechnical information in these studies was sometimes incomplete.
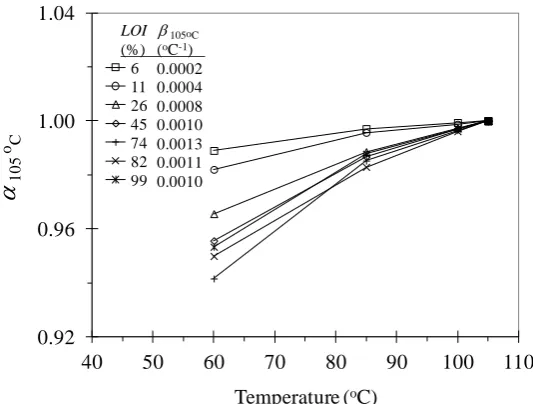
Figure 5 presents values computed from experimental data reported by MacFarlane and Allen,[3] Skempton and Petley,[21] Gilbert[22] and O’Kelly,[34] plotted against drying temperature. The two peat materials investigated by MacFarlane and Allen[3] were very fibrous Ottawa peat and amorphous peat from Rockland, Ontario. These were described as Category 3 and 10 materials, respectively, on the Canadian peat-classification system after Radforth.[37] These peat materials were dried using a forced-draft oven for set periods and temperatures in the range 75–150oC, with the chamber temperature increased in 5oC steps. The data presented in Fig. 5(b) are for seven peat and organic clay soils sampled from the coastal flats near Avonmouth, the Fens near King’s Lynn and from Cranberry Moss raised bog (Durham), UK. Descriptions of these deposits and their geotechnical properties have been reported by Skempton and Petley.[21] The materials investigated by Gilbert[22] included Davis Pond Black peat (―slightly fibrous vegetable remains and wood fragments with traces of clay and pockets of black amorphous decayed vegetable matter‖) and Davis Pond Brown peat (―moderately fibrous vegetable matter with some plant remains‖). Gilbert[22]
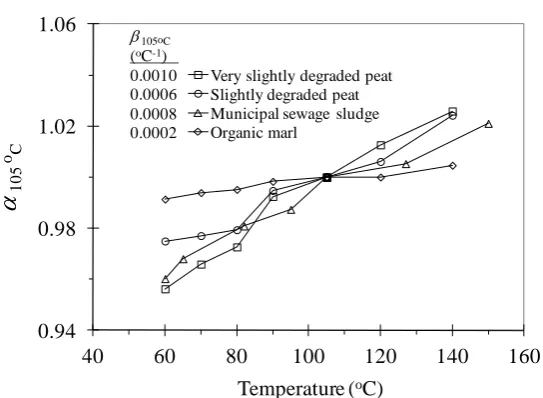
9 The study by O’Kelly[34]
employed the same gravity–convection oven as that used in the present investigation.
INSERT Table 2.
INSERT Figure 5.
The combined data for the 22 organic soils (i.e. four pseudo-fibrous peats tested in the present study and 18 soils from the literature) are considered in Fig. 6. This figure shows values of parameter plotted against LOI: where 105oC and
C 110o
denote the gradients of the against drying temperature trend lines for t ≤ 105oC and 110oC respectively.
INSERT Figure 6.
Calculated values were less than 0.0015oC-1 for all but one of the 22 soils considered; namely 105oC = 0.0037oC-1 for the very fibrous Ottawa peat investigated by MacFarlane and Allen.[3] It is notable that compared with the other 20 soils considered, the second material investigated by MacFarlane and Allen,[3] an amorphous peat, was also at the high end of the 105oC range. Apart from the Ottawa peat, the values determined for the other 21 soils are relatively small and not considered significant, particularly for low-to-moderately organic soils (LOI ≤ 30%). This will be demonstrated later in this paper using correlations between water content, determined for different oven-drying temperatures, and remolded strength for the peat materials investigated in this study.
When experimental data on the thermal sensitivity of a particular organic soil are not available, values of 105oC and hence
C 105o
can be approximated using the trend curves for 105oC and 110oC show in Fig. 6, once its organic content (LOI) value is known. Direct comparisons of water content values determined for the same material but on the basis of lower oven-drying temperatures can then be made using the method presented by O’Kelly:[20]
105C 105C 1
1C o o
o w
wt (2)
where C 105o
w and
C
o
t
w are dimensionless values of water content (i.e. not %), measured for an oven temperature of 105oC, and deduced for a lower drying temperature of t oC, respectively;
C 105o
is the measured specimen equilibrium dry mass for an oven temperature of 105oC divided by the corresponding mass for the lower drying temperature of t oC. Similarly, calculations can be performed for
C 110o
w using interpolated values of 110oC and C
110o
10
Drying Response of Peat in Gravity–convection and Forced-draft Ovens at 105oC
Figure 7 presents a comparison of the drying response of the three pseudo-fibrous peats at 105oC in gravity–convection and forced-draft ovens. Each test-specimen was nominally either 50 or 100 g in initial wet mass (plotted on first and second y-axes, respectively, in Fig. 7). As expected, evaporation rates achieved using the forced-draft oven were initially significantly greater (Fig. 7(a)). However, for drying periods of between one day and the maximum of 11 days considered, rates of mass loss produced by the gravity–convection and forced-draft ovens were very similar for the same initial wet mass (Fig. 7(b)). This was true for test-specimens of both 50 and 100 g initial wet mass investigated. Hence, with presumably similar levels of charring and oxidation occurring, the method of air circulation within the oven chamber, either by gravity–convection or forced-draft, only appears to significantly affect the evaporation rate. This would tend to suggest that the significantly higher level of charring/oxidation reported for the Ottawa peat (with 105oC = 0.0037oC-1) investigated by MacFarlane and Allen[3] was unlikely to be related to the fact that they had used a forced-draft oven, as opposed to a gravity–convection oven, in performing their drying tests. Note that, as set out in British Standard BS1377–2,[11] for the purpose of water content determinations, the dry masses of all test-specimens were deemed to have reached a dry state by the end of the initial 24-h drying period at 105oC; i.e. meeting the requirement of a maximum difference in successive weighing over a 4-h interval not exceeding 0.1% of the initial wet specimen mass.
INSERT Figure 7.
Optical Examination of Peat Fibers for Evidence of Charring
When compared against control specimens air-dried at ambient laboratory temperature, optical examination of individual peat fibers in specimens oven-dried at set temperatures in the range 80–110oC did not produce definitive evidence of charring for either the gravity– convection or forced-draft ovens. For very fibrous Ottawa peat (Category 10 on the Canadian peat-classification system after Radforth[37]), MacFarlane and Allen[3] had reported some evidence of charring for drying temperatures above ~85°C. The three pseudo-fibrous peats under investigation in the present study were in a slightly-to-moderately decomposed state in-situ, having a characteristic dark brown/black color. Hence one possibility is that for these three materials, (portions of) peat fibers that may have been susceptible to some charring during oven drying had already been lost from these materials by natural decomposition processes in-situ.
Significance of Oven-drying Temperature on Strength–Water Content Correlations
11
and 9 presented correlations between water content, determined for different oven-drying temperatures, and remolded strength for the peat materials investigated in the present study. The water content values of the test-specimens were measured for an oven-drying temperature of 105oC. Included in Figs. 8 and 9 are correlations derived for water content values corresponding to drying temperatures of 80oC and 110oC, using Eq. (2) and appropriate
C 105o
values for the peat materials taken from Fig. 4.
INSERT Figure 8.
For the British Standard fall-cone apparatus used, the LL value is determined as the water content corresponding to a 20-mm cone penetration depth according to BS1377–2.[11] From Fig. 8, an absolute difference of 40 percentage occurred between deduced LL values for oven-drying temperatures of 80oC and 110oC in the case of pseudo-fibrous peat materials B, Cn and D. Overall, this resulted in the LL value for 80oC being at most 4.1% below that for 110oC, which is considered acceptable given that the LL values were extremely high. For all four peat materials tested in the present study, an absolute difference of only up to 12 percentage occurred between measured and deduced LL values for oven-drying temperatures of 105oC and 110oC respectively (i.e. the LL value for 110oC was at most 1.8% greater than for 105oC).
Figure 9 presents data of saturated remolded undrained shear strength (sur) from triaxial compression testing of Clara refined peat material. Although, in practice, one is usually more interested in the dependency of strength on water content (as shown in Fig. 9(a)), their relationship is also presented in the form given by Eq. (3) for further consideration. Koumoto and Houlsby[38] have shown that the values of coefficients a and b in Eq. (3) are closely related to geoengineering properties. For example, in the case of inorganic soil, coefficient b
relates to the soil compressibility.[38,39] Laboratory studies by O’Kelly[35] and Zentar et al.[40]
have shown that for organic clays (LOI of 57% and 6.7–9.7% respectively), the log w–log
ur
s relationship is also strongly linear, extending well beyond the measured plastic range. Figure 9 includes correlations for values of water content corresponding to oven-drying temperatures of 80oC, 105oC and 110oC. The water contents for the 80oC and 110oC correlations were deduced from measured water content values for 105oC using Eq. (2) and appropriate experimental
C 105o
values reported in Fig. 4. The values of coefficients a and b
reported for the different oven temperatures in Fig. 9(b) were determined from regression analysis of the log w–log sur data. Overall, the correlations for these three oven temperatures were found to be quite close in agreement.
b ur
s a
w (3)
where coefficient a is the water content (as %) corresponding to sur = 1 kPa and coefficient b
12 INSERT Figure 9.
Significance of Oven-drying Temperature in the Context of the Heterogeneity of Peat Deposits
The significance of differences in specimen equilibrium dry mass and hence in calculated values of water content arising from the use of different oven-drying temperatures is considered in the context of the natural heterogeneity of peat deposits. For instance, for the Ballydermot raised bog site, recovered peat cores from two cable-percussive boreholes (BH1 and BH2), spaced at 27 m apart, indicated 3.8–4.0 m depth of pseudo-fibrous peat overlying glacial till deposits.[41] Within the peat layer, the water content generally reduced approximately linearly from 1340% to ~600% with increasing depth from 1.5 to ~4.0 m below ground surface level (Fig. 10). For shallower depths, the water content in the peat layer was found to reduce to ~560%. However it has been well documented[1,42] that the water content of peat deposits can also vary sharply over very small distances. Plant vegetation of different character live in communities (e.g. the Ballydermot peat was comprised of
Sphagnum, Carex, Cladium, Alnus, Betula, and Phragmites) and their decomposition rates are not uniform, either locally or through the deposit, particularly during the early stages of the decomposition process.[1,42] For instance, Landva[43] reported that measured values of water content for a given depth within a 75 m by 15 m test area at the Escuminac bog (NB, Canada) varied by at least 600 percentage.
INSERT Figure 10.
This natural heterogeneity is also evident for the Ballydermot site, with significant differences between measured water contents for a given depth in BH1 and BH2 (Fig. 10). Specimen pairs corresponding to the same depth and borehole were sampled from recovered peat cores. For each pair, one specimen was oven dried at 80oC and the other at 105oC, with the corresponding values of water content (i.e.
C 80o
w and C 105o
w ) determined from the respective equilibrium dry masses. Also included in Fig. 10 are profiles of
C 80o
w against depth, which were deduced from the measured
C 105o
w values using Eq. (2) and the pertinent C
105o
value of 0.977 taken from Fig. 4(a). Considering full evaporation of the pore water had occurred for 105oC, and also possibly some charring/oxidation of susceptible organic solids, it would be expected that measured values of water content for 105oC should be consistently greater than for 80oC, had the specimen pairs been physically identical. However closer examination of measured water content values for the 15 specimen pairs sampled from different depths indicates that in 7 instances,
C 80o
w > C 105o
13 Recommendations
The use of a standardized oven-drying temperature is desirable when correlating water content with other material properties. From our experimental findings, we recommend that routine water content determinations on peat and other organic soils should be performed at either 105±5°C or105–110°C; i.e. in line with standardized temperature ranges specified for water content determinations on inorganic soils by ASTM D2974[10] and British Standard BS1377–2[11] respectively. This avoids the requirement for having separate ovens, set at different temperatures, for oven drying of inorganic and organic soils. At these temperatures, all of the pore water is evaporated from the test-specimen, usually within a 24-h period. Hence it is also more expedient to perform water content tests at these temperatures, rather than at lower drying temperatures in the range 60–95°C recommended in some literature, given that the drying period required to achieve an equilibrium dry mass can increase significantly with reducing temperature. Considering the very/extremely high water content (low unit weight) of most peats and organic soils, we also suggest using a minimum wet specimen mass of 50 g in performing water content determinations. With water contents of approximately 500–1500% (Fig. 10), a peat specimen of 50 g wet mass would have a dry mass of between 3.1 and 8.3 g, which is considered acceptable for water content determinations.
These recommendations are consistent with the oven-drying temperature of 105°C or, more generally, between 100°C and 110°C concluded by Hobbs[1] and Skempton and Petley[21] for water content determinations on peats and other organic soils and by O’Kelly[44] for organic sludges and residues. These recommendations are also consistent with 105±5°C and the initial wet specimen mass of at least 50 g specified by the ASTM standard test method for water content determinations on peat and other organic soils (ASTM D2974[10]) and also with 103–105°C specified by the U.S. EPA Method 1684[45] for the determination of total, fixed, and volatile solids in water, solids, and biosolids.
Although not performed in the present investigation, similar drying studies should be conducted along with monitoring of the gas phase to identify loss of moisture/organics and how the calorific value changes with temperature of drying. For instance, Huang et al. (2012) have reported on the use of headspace solid-phase microextraction followed by gas chromatography–mass spectrometry to investigate the effects of oven drying on the degree of dehydration and volatile components of ginger, another thermally sensitive biological material.
CONCLUSIONS
14
content and also similar values for selected geotechnical index properties. Since a standardized drying temperature is desirable when correlating water content with other material properties, and given that large water content variations naturally occur within peat deposits due to material heterogeneity, it is concluded that oven drying of peat specimens to an equilibrium mass at 105–110°C or 105±5°C using either gravity–convection or forced-draft ovens is acceptable for routine water content determinations. Microscope examination of the pseudo-fibrous peats did not produce definitive evidence of charring of the peat fibers for oven-drying temperatures of up to 110oC. Although some (very) minor charring/oxidation of organic matter may occur, these temperature ranges ensure full evaporation of the pore water, invariably within a 24-h period. Hence, it is more expedient to achieve an equilibrium dry mass condition for these temperature ranges, when compared against lower oven-drying temperatures of 60–90°C adopted in some literature, and also consistent with standard practice for water content determinations on inorganic soils.
ACKNOWLEDGMENTS
The writers thank Eoin Dunne and Martin Carney (Department of Civil, Structural and Environmental Engineering, Trinity College Dublin) for performing the original geotechnical-laboratory tests reported in this paper. The writers also thank Dr. Osario-Salas for permission to reproduce some data presented in Fig. 10.
REFERENCES
1. Hobbs, N.B. Mire morphology and the properties and behaviour of some British and foreign peats. Quarterly Journal of Engineering Geology1986, 19(1), 7–80.
2. Farrell, E.R.; Chapter 35 — Organics/Peat Soils. In ICE Manual of Geotechnical Engineering: Volume 1,Geotechnical Engineering Principles, Problematic Soils and Site Investigation; Burland, J., Chapman, T., Skinner, H., Brown, M. Eds.; ICE Publishing: London, 2012; 463–479.
3. MacFarlane, I.C.; Allen, C.M. An examination of some index test procedures for peat, Internal Report No. 314; Division of Building Research, National Research Council Canada, 1965.
4. Dev, S.R.S.; Raghavan, V.G.S. Advancements in drying techniques for food, fiber, and fuel. Drying Technology2012, 30(11–12), 1147–1159
5. Huang, B.; Wang, G.; Chu, Z.; Qin, L. Effect of oven drying, microwave drying, and silica gel drying methods on the volatile components of ginger (Zingiber officinale
Roscoe) by HS-SPME-GC-MS. Drying Technology2012, 30(3), 248–255.
6. Kabganian, R.; Carrier, D.J.; Sokhansanj,S. Physical characteristics and drying rate of
Echinacea root. Drying Technology2002, 20(3), 637–649.
7. Kardum, J.P.; Sander, A.; Skansi, D. Comparison of convective, vacuum, and microwave drying chlorpropamide. Drying Technology2001, 19(1), 167–183.
8. Karthikeyan, M.; Kuma, J.V.M.; Hoe, C.S.; Ngo, D.L.Y. Factors affecting quality of dried low-rank coals. Drying Technology2007, 25(10), 1601–1611.
9. Benali, M.; Kudra, T. Thermal dewatering of diluted organic suspensions: process mechanism and drying kinetics. Drying Technology2002, 20(4–5), 935–951.
15
11. BSI (British Standards Institution). Methods of Test for Soils for Civil Engineering Purposes (Classification Tests), BS1377: Part 2; British Standards Institution: Milton Keynes, UK, 1990.
12. Hosang, J.R.; Locker, J.G. Discussion on ―Ignition loss and other properties of peats and clays from Avonmouth, King’s Lynn and Cranberry Moss‖. Géotechnique 1971, 21(4), 416–418.
13. Miyakawa, I. Soil Engineering Research on Peaty Alluvia, Bulletin 20, Reports 1–3: Civil Engineering Research Institute, Hokkaido Development Bureau; Sapporo, Japan, 1959. 14. Marachi, N.D.; Dayton, D.J.; Dare, C.T.; Geotechnical properties of peat in San Joaquin
Delta. In Testing of Peats and Organic Soils, ASTM STP 820; Jarrett, P.M., Ed.; American Society for Testing and Materials: West Conshohocken, Pa., USA, 1983; 207– 217.
15. Ng, S.Y.; Eischens, G.R.; Repeated short-term consolidation of peats. In Testing of Peats and Organic Soils, ASTM STP 820; Jarrett, P.M., Ed.; American Society for Testing and Materials: West Conshohocken, Pa., USA, 1983; 192–206.
16. Boylan, N.; Long, M.M. An investigation of two peat slope failures in the Wicklow mountains. Proceedings of the Royal Irish Academy, Biology and Environment 2010,
110B(3), 173–184.
17. Goodman, L.J.; Lee, C.N. Laboratory and field data on engineering characteristics of some peat soils. In Proceedings of the Eighth Muskeg Research Conference, Saskatchewan, Canada; MacFarlane, I. C., Ed.; National Research Council of Canada, Ottawa; ACSSM Technical Memorandum 74, 1962; 107–129.
18. Landva, A.O.; Korpijaakko, E.O.; Pheeney, P.E.; Geotechnical classification of peats and organic soils. In Testing of Peats and Organic Soils, ASTM STP 820; Jarrett, P.M., Ed.; American Society for Testing and Materials: West Conshohocken, Pa., USA, 1983; 37– 51.
19. Riley, J.L. Laboratory Methods for Testing Peat — Ontario Peatland Inventory Project, Miscellaneous Paper No. 145; Ontario Geological Survey: Ministry of Northern Development and Mines, Ontario, 1989.
20. O’Kelly, B.C. Accurate determination of moisture content of organic soils using the oven drying method. Drying Technology2004, 22(7), 1767–1776.
21. Skempton, A.W.; Petley, D.J. Ignition loss and other properties of peats and clays from Avonmouth, King’s Lynn and Cranberry Moss. Géotechnique1970, 20(4), 343–356. 22. Gilbert, P.A. Computer-controlled Microwave Drying of Potentially Difficult Organic
and Inorganic Soils, Technical report GL–90–26; U.S. Army Corps of Engineers: U.S. Army Engineer Waterways Experiment Station, Vicksburg, Mississippi, 1990.
23. O’Kelly, B.C.; Pichan, S.P. Effect of decomposition on physical properties of fibrous peat. Proceedings of the Institution of Civil Engineers, Environmental Geotechnics 2014,
1(1): 22–32.
24. ASTM. Standard Classification of Peat Samples by Laboratory Testing, D4427–07; ASTM International: West Conshohocken, PA, USA, 2007.
25. Landva, A.O.; Pheeney, P.E. Peat fabric and structure. Canadian Geotechnical Journal
1980, 17(3), 416–435.
16
27. Pichan, S.P.; O’Kelly, B.C. Stimulated decomposition in peat for engineering applications. Proceedings of the Institution of Civil Engineers, Ground Improvement
2013, 166(3), 168–176.
28. O'Kelly, B.C.; Zhang, L. Consolidated-drained triaxial compression testing of peat. ASTM Geotechnical Testing Journal2013, 36(3), 310–321.
29. Zhang, L.; O’Kelly, B.C. The principle of effective stress and triaxial compression testing of peat. Proceedings of the Institution of Civil Engineers, Geotechnical Engineering
2014, 167(1): 40–50.
30. Zhang, L.; O’Kelly, B.C. Effect of salt grain additions on fibrous peat consolidation.
Proceedings of the Institution of Civil Engineers, Ground Improvement 2014, Vol. 167. http://dx.doi.org/10.1680/grim.12.00034. E-publication ahead of print.
31. AGEC (Applied Ground Engineering Consultants). Final Report on Derrybrien Wind Farm Post-Landslide Site Appraisal; Applied Ground Engineering Consultants Ltd.: Bagenalstown, Carlow, Ireland, 2004.
32. BSI (British Standards Institution). Methods of Test for Soils for Civil Engineering Purposes (Chemical and Electro-chemical Tests), BS1377: Part 3; British Standards Institution: Milton Keynes, UK, 1990.
33. ASTM. Standard Test Method for Laboratory Determination of the Fiber Content of Peat Samples by Dry Mass, D1997–91; ASTM International: West Conshohocken, PA, USA,
2008.
34. O’Kelly, B.C. Oven-drying characteristics of soils of different origins. Drying Technology2005, 23(5), 1141–1149.
35. O'Kelly, B.C. Characterisation and undrained strength of amorphous clay. Proceedings of the Institution of Civil Engineers, Geotechnical Engineering 2014, Vol. 167. http://dx.doi.org/10.1680/geng.11.00025. E-publication ahead of print.
36. BSI (British Standards Institution). Methods of Test for Soils for Civil Engineering Purposes (Shear Strength Tests: Total Stress), BS1377: Part 7; British Standards Institution: Milton Keynes, UK, 1990.
37. Radforth, N.W.; Classification of muskeg. In Muskeg Engineering Handbook. MacFarlane, I.C., Ed., University of Toronto Press: Toronto, 1969; 31–39.
38. Koumoto, T.; Houlsby, G.T. Theory and practice of the fall cone test. Géotechnique2001,
51(8), 701–712.
39. O’Kelly, B.C. Atterberg limits and remolded shear strength–water content relationships.
ASTM Geotechnical Testing Journal2013, 36(6): 939–947.
40. Zentar, R.; Abriak, N.-E.; Dubois, V. Fall cone test to characterize shear strength of organic sediments. ASCE Geotechnical and Geoenvironmental Engineering2009, 135(1): 153–157.
41. Osorio-Salas, J.P. Vacuum Consolidation Field Test on a Pseudo-Fibrous Peat; Ph.D. Thesis: University of Dublin, Trinity College Dublin, 2012.
42. O’Kelly, B.C.; Pichan, S.P. Effects of decomposition on the compressibility of fibrous peat — A review. Geomechanics and Geoengineering: An International Journal 2013,
8(4): 286–296.
43. Landva, A.O. Geotechnical Behaviour and Testing of Peat: PhD Thesis; Laval University, Québec, Canada,1980.
44. O'Kelly, B.C. Drying temperature and water content–strength correlations. Proceedings of the Institution of Civil Engineers, Environmental Geotechnics 2014, Vol. 1. http://dx.doi.org/10.1680/envgeo.13.00016. E-publication ahead of print.
17
TABLES 1 AND 2
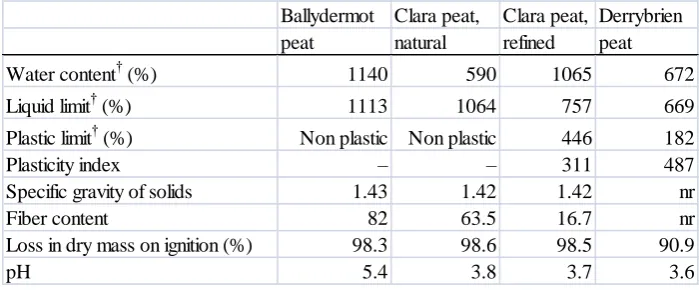
TABLE 1. Selected properties of test materials. Notes: † based on 48-h drying period at 105oC; nr, not recorded.
Ballydermot Clara peat, Clara peat, Derrybrien peat natural refined peat Water content† (%) 1140 590 1065 672 Liquid limit† (%) 1113 1064 757 669 Plastic limit† (%) Non plastic Non plastic 446 182
Plasticity index – – 311 487
Specific gravity of solids 1.43 1.42 1.42 nr
Fiber content 82 63.5 16.7 nr
Loss in dry mass on ignition (%) 98.3 98.6 98.5 90.9
[image:17.595.71.421.173.318.2]pH 5.4 3.8 3.7 3.6
TABLE 2. Oven-drying studies reported in literature. Note: nr, not reported. Soil description Water Liquid Plastic Plasticity Specific LOI Reference
content limit limit index gravity
(%) (%) (%) (%)
Very fibrous Ottawa peat nr nr nr nr 1.38 96.6
Amorphous peat (Rockland, Ontario) nr nr nr nr 1.60 75.0 Davis Pond Brown peat 771 810 Non plastic nr nr 82.7
Davis Pond Black peat 425 450 310 140 nr 67.6
West Bank Hurricane clay 125 228 63 165 nr 14.6
San Francisco Bay mud 90 88 43 45 nr 5.5
Very slightly degraded peat (H3) nr 900 310 590 1.19 87.7
Slightly degraded peat (H4) nr 735 485 250 1.47 92.9
Municipal sewage sludge 700 315 53 262 1.55 70.0
Organic marl nr 180 130 50 2.06 29.7
MacFarlane and Allen[3]
Gilbert[22]
[image:17.595.72.526.412.576.2]18
FIGURES 1 TO 10
FIG. 1. Scanning electron micrographs for Clara peat material.[28,29] (a) Remolded.
[image:18.595.71.248.162.308.2]19
FIG. 2. Drying in gravity–convection oven for step increases in chamber temperature.
(a) Ballydermot specimens B1–B4.
2.9 3.1 3.3 3.5 3.7
0 5 10 15 20 25 30
D
ry
mas
s
(g
)
Cumulative drying period (day)
B1 B2 B3 B4
80 90
Set oven temperature (oC)
110 105
100
First readings taken at 3 days
(b) Clara (natural) specimens Cn1–Cn4.
4.2 4.4 4.6 4.8 5.0
0 5 10 15 20 25 30
D
ry
mas
s
(g
)
Cumulative drying period (day)
Cn1 Cn2 Cn3 Cn4
80 90
Set oven temperature (oC)
110 105
100
First readings taken at 3 days
20
Figure 2 continued from previous page
FIG. 2. Drying in gravity–convection oven for step increases in chamber temperature.
(c) Clara (refined) specimens Cr1–Cr4.
4.4 4.6 4.8 5.0
0 5 10 15 20 25 30
D
ry
mas
s
(g
)
Cumulative drying period (day)
Cr1 Cr2 Cr3 Cr4
80 90
Set oven temperature (oC)
110 105
100
First readings taken at 3 days
(d) Derrybrien specimens Cr1–Cr4.
4.9 5.3 5.7 6.1
0 5 10 15 20 25 30
D
ry
mas
s
(g
)
Cumulative drying period (day)
D1 D2 D3 D4
90
Set oven temperature (oC)
110 105
100
First readings taken at 3 days
[image:20.595.64.320.505.716.2]21
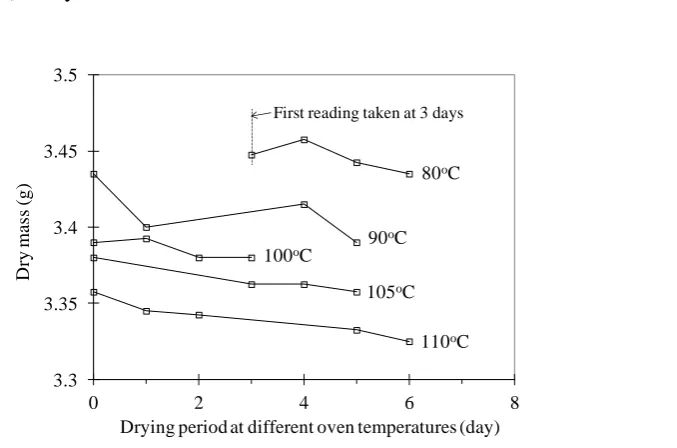
FIG. 3. Reduction in specimen dry mass against drying period for different oven temperatures.
(a) Ballydermot.
3.3 3.35 3.4 3.45 3.5
0 2 4 6 8
D
ry
mas
s
(g
)
Drying period at different oven temperatures (day)
80oC
110oC
105oC
100oC 90
oC
First reading taken at 3 days
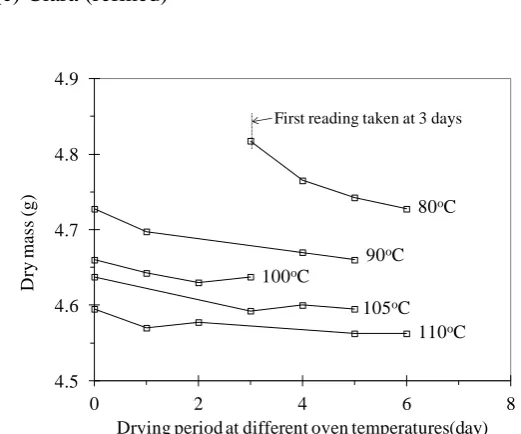
(b) Clara (natural).
4.5 4.6 4.7 4.8
0 2 4 6 8
D
ry
mas
s
(g
)
Drying period at different oven temperatures (day)
80oC
110oC
105oC
100oC
90oC
First reading taken at 3 days
[image:21.595.76.415.140.364.2]22
Figure 3 continued from previous page
FIG. 3. Reduction in specimen dry mass against drying period for different oven temperatures.
(c) Clara (refined)
4.5 4.6 4.7 4.8 4.9
0 2 4 6 8
D
ry
mas
s
(g
)
Drying period at different oven temperatures(day)
80oC
110oC
105oC
100oC
90oC
First reading taken at 3 days
(d) Derrybrien.
5.2 5.3 5.4 5.5 5.6
0 2 4 6 8
D
ry
mas
s
(g
)
Drying period at different oven temperatures (day)
80oC
110oC
105oC
100oC
90oC
[image:22.595.78.336.524.717.2]23
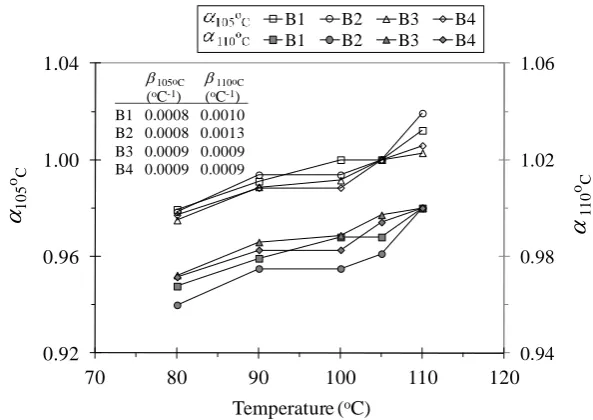
FIG. 4. Water content parameter plotted against drying temperature. Note reported values of 105oC and
C 110o
are gradients of the parameter against temperature plots determined using data for temperature t ≤ 105oC and 110oC respectively.
(a) Ballydermot.
0.94 0.98 1.02 1.06
0.92 0.96 1.00 1.04
70 80 90 100 110 120
11
0
o C 105
o C
Temperature (oC)
B1 B2 B3 B4
B1 B2 B3 B4
105oC 110oC
(oC-1) (oC-1) B1 0.0008 0.0010 B2 0.0008 0.0013 B3 0.0009 0.0009 B4 0.0009 0.0009
(b) Clara (natural).
0.97 0.99 1.01 1.03
0.96 0.98 1.00 1.02
70 80 90 100 110 120
11
0
o C 105
o C
Temperature (oC)
Cn1 Cn2 Cn3 Cn4 Cn1 Cn2 Cn3 Cn4
105oC 110oC
(oC-1) (oC-1) Cn1 0.0006 0.0008 Cn2 0.0006 0.0009 Cn3 0.0008 0.0009 Cn4 0.0008 0.0010
[image:23.595.82.379.167.377.2]24
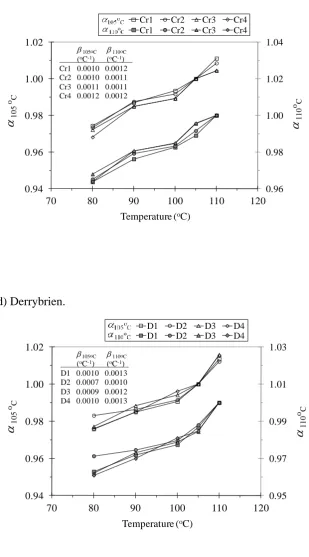
[image:24.595.86.384.222.430.2]Figure 4 continued from previous page
FIG. 4. Water content parameter plotted against drying temperature. Note reported values of 105oC and
C 110o
are gradients of the against drying temperature plots determined using data for t ≤ 105oC and 110oC respectively.
(c) Clara (refined)
0.96 0.98 1.00 1.02 1.04
0.94 0.96 0.98 1.00 1.02
70 80 90 100 110 120
11
0
o C
105
o C
Temperature (oC)
Cr1 Cr2 Cr3 Cr4 Cr1 Cr2 Cr3 Cr4
105oC 110oC
(oC-1) (oC-1) Cr1 0.0010 0.0012 Cr2 0.0010 0.0011 Cr3 0.0011 0.0011 Cr4 0.0012 0.0012
(d) Derrybrien.
0.95 0.97 0.99 1.01 1.03
0.94 0.96 0.98 1.00 1.02
70 80 90 100 110 120
11
0
o C
105
o C
Temperature (oC)
D1 D2 D3 D4
D1 D2 D3 D4
25
FIG. 5. Parameter against drying temperature correlations deduced from experimental data reported in literature. Note
C 105o
and
C 110o
correspond to reference drying temperatures of 105oC and 110oC respectively.
(a) Peats (MacFarlane and Allen[3]).
0.80 0.90 1.00 1.10
70 90 110 130
105 oC
,
11
0
oC
Temperature, t (oC)
(oC-1) Fibrous (t= 105oC) 0.0037 Fibrous (t= 110oC) 0.0039 Amorphous (t = 105oC) 0.0016 Amorphous (t = 110oC) 0.0015
(b) Skempton and Petley.[21]
0.92 0.96 1.00 1.04
40 50 60 70 80 90 100 110
105
o C
Temperature (oC) 6
11 26 45 74 82 99 LOI 105oC (%) (oC-1)
0.0002 0.0004 0.0008 0.0010 0.0013 0.0011 0.0010
26
Figure 5 continued from previous page
FIG. 5. Parameter against drying temperature correlations deduced from experimental data reported in literature. Note
C 105o
and
C 110o
correspond to reference drying temperatures of 105oC and 110oC respectively.
(c) Gilbert.[22]
0.85 0.90 0.95 1.00 1.05 1.10
0 20 40 60 80 100 120
11
0
o C
Temperature (oC)
Davis Pond Brown peat Davis Pond Black peat West Bank Hurricane clay San Francisco Bay mud
110oC
(oC-1) 0.0013 0.0011 0.0004 0.0001
(d) O’Kelly.[34]
0.94 0.98 1.02 1.06
40 60 80 100 120 140 160
105
o C
Temperature (oC) Very slightly degraded peat Slightly degraded peat Municipal sewage sludge Organic marl
[image:26.595.72.344.532.731.2]27
FIG. 6. Parameter plotted against loss on ignition. Note: hollow and solid symbols indicate C
105o
and 110oCvalues respectively.
Very fibrous Ottawa peat
0.000 0.001 0.002 0.003 0.004 0.005
0 20 40 60 80 100
(
oC −1)
LOI (%)
Present study, 105oC McFarlane & Allen [3], 105oC Present study, 110oC McFarlane & Allen [3], 110oC Gilbert [22], 110oC Skempton & Petley [21], 105oC O'Kelly [34], 105oC
Trend curves, 110oC
28
FIG. 7. Drying response at 105oC for gravity–convection (c) and forced-draft (f) ovens. Note: solid and dashed lines indicate c and f ovens respectively. Nomenclature: B, Ballydermot; Cn, Clara (natural); D, Derrybrien; 50 and 100 indicate initial wet specimen mass (g), with these data plotted on primary and secondary y-axes respectively.
(a) Initial 48-h period.
0 20 40 60 80 100 0 10 20 30 40 50
0 12 24 36 48
Sp ecim en m ass fo r 1 00 g wet m ass (g ) Sp ecim en m ass fo r 5 0g wet m ass (g )
Drying period (h) B–c–50 B–f–50 Cn–c–50 Cn–f–50 D–c–50 D–f–50 B–c–100 B–f–100 Cn–c–100 Cn–f–100 D–c–100 D–f–100 First measurements
taken after 2 h
(b) Response after initial 24-h period.
7.5 8.0 8.5 9.0 9.5 10.0 3.5 4.0 4.5 5.0
1 3 5 7 9 11
S p ec im en m as s fo r 1 0 0 g we t m as s (g ) S p ec im en m as s fo r 5 0 g we t m as s (g )
29
FIG. 8. Cone penetration depth plotted against measured (105oC) and calculated (80oC and 110oC) values of water content.
(a) Ballydermot (B) and Clara natural (Cn).
15 20 25 30 35
1000 1050 1100 1150 1200 1250
Co
n
e
p
en
et
rat
io
n
(mm)
Water content (%)
B 80oC B 105oC B 110oC Cn 80oC Cn 105oC Cn 110oC Liquid limit values determined
for different oven temperatures Temp (oC) 80 105 110
Peat B (%) 1085 1113 1125 Peat Cn (%) 1044 1064 1074
(b) Clara refined (Cr), Derrybrien (D).
10 15 20 25 30 35
500 750 1000
Co
n
e
p
en
et
rat
io
n
(mm)
Water content (%)
Cr 80oC Cr 105oC Cr 110oC D 80oC D 105oC D 110oC Liquid limit values determined
for different oven temperatures Temp (oC) 80 105 110
[image:29.595.82.457.132.391.2]30
FIG. 9. Water content against undrained strength for Clara refined peat.
(a) Normal plot.
0 40 80 120
200 300 400 500 600
U
n
dr
ai
n
ed
sh
ea
r
st
re
n
g
th
(
kP
a)
Water content (%)
80 deg C 105 deg C 110 deg C
(b) Bi-logarithmic plot.
200
1 10 100 1000
W
ater
c
on
ten
t
(%
)
Undrained shear strength (kPa)
80 deg C 105 deg C 110 deg C
600
400
31
FIG. 10. Water content profiles against depth for Ballydermot raised bog.
0
1
2
3
4
5
0
500
1000
1500
D
ep
th
b
el
o
w
g
ro
u
n
d
s
u
rface
(m)
Water content (%)
BH1, 80oC (measured) [41] BH2, 80oC (measured) [41] BH1, 105oC [41] BH2, 105oC [41]
BH1, 80oC (calculated) BH2, 80oC (calculated)