Journal of Criminal Law and Criminology
Volume 48 | Issue 3
Article 2
1957
Delinquent and Non-Delinquent Attitudes Toward
the Prevalence of Stealing
John C. Ball
Follow this and additional works at:
https://scholarlycommons.law.northwestern.edu/jclc
Part of the
Criminal Law Commons
,
Criminology Commons
, and the
Criminology and Criminal
Justice Commons
This Article is brought to you for free and open access by Northwestern University School of Law Scholarly Commons. It has been accepted for inclusion in Journal of Criminal Law and Criminology by an authorized editor of Northwestern University School of Law Scholarly Commons.
Recommended Citation
DELINQUENT AND NON-DELINQUENT ATTITUDES TOWARD THE PREVALENCE OF STEALING
JOHN C. BALL
The author is Assistant Professor of Sociology at the University of Kentucky. His research has been focussed upon aetiological factors associated with juvenile delinquency, especially upon attitudinal differences between delinquents and non-delinquents.
Dr. Ball has already published in this JoupNAL, "The Deterrence Concept in Criminology and Law", 46, 3, September-October, 1955, pages 347-354. He is nov preparing a book pertaining to attitudes of delinquents.-EDiToR.
In this research, a comparison between a group of delinquent boys and three non-delinquent groups is undertaken with respect to attitudes toward stealing. The spe-cific attitudinal variable which provides the basis for the comparison between the delinquents and nondelinquents has been empirically identified by means of scalo-gram analysis and is termed "attitude toward the prevalence of stealing." Thus the study is designed to provide a measurement of attitudinal difference in a single content area-stealing.
It is not suggested that the attitude scale herein formulated includes or subsumes all possible attitudes toward stealing. Quite the contrary, it is held that the attitude scale herein derived refers to a single attitudinal variable and, therefore, offers a means whereby a statistical comparison of delinquent and nondelinquent attitudes which meets the criteria of scientific measurement can be undertaken.
The purpose of the study is to determine whether delinquents differ from various nondelinquent groups in their conception of how prevalent stealing is in contemporary American society. Do delinquents, for example, have a different notion of the inci-dence of criminal behavior-in this case, theft-than nondelinquents? This question is part of the broader problem of whether the criminal, from his frame of reference, sees society as something quite different from that which others perceive it to be.
A second or corollary purpose of the study is to determine' the relationship of
demographic factors to the attitudinal variable. For example, are juvenile delinquents from broken homes more positive in their attitudes toward stealing than those who are not from broken homes? The analysis of demographic factors includes data con-cerning the relationship of seven separate factors (age, intelligence, education, place of residence, occupation, marital status, and size of family) to the stealing variable among both the delinquent and nondelinquent groups. Thus, the research provides data concerning the association of personal and family characteristics with positive attitudes toward stealing.
THEORETICAL CONSIDERATIONS
under-standing of criminal behavior since one of the principal differences between male juvenile delinquents and nondelinquent boys of comparable age is that the former group has engaged in repeated acts of theft. Thus, a measurement of attitudinal differ-ences pertaining to stealing offers a means whereby overt criminality can be compared with the more covert manifestation of personality structure-in this instance, atti-tudes. If, therefore, it should be demonstrated that delinquents possess markedly different attitudes toward stealing, and at the same time the primary manifestation of their illegal activities has centered about stealing, a convergence of some signi-ficance for both psychological and sociological theory may be indicated.
Another though related aspect of this problem concerns identification of what have been termed "antisocial attitudes." Literature pertaining to criminalty is replete with references to the antisocial attitudes of apprehended offenders. Indeed, these nefarious factors are frequently regarded as being of cardinal importance in the development of criminal behavior.' Yet the fact remains that, for the most part, the concept of antisocial attitudes has not been supported by empirical demonstration. So that, precisely what are and what are not antisocial attitudes has not been ade-quately established. The term has become an omnibus phrase without explicit refer-ence in fact.2
What seems necessary in order to dispel the ambiguity is (1) identifica-tion of single attitudinal variables by procedures which permit verificaidentifica-tion of findings, (2) measurement of the distribution of variables among delinquent and nondelinquent populations, and (3) analysis of similarities and differences between and within groups with a view to delineating the variables which constitute antisocial attitudes.3
The present study is confined to a single attitudinal area. Within this area, the research procedure is focused upon two points. The first point is to test the universe of content for unidimensionality in order to determine if measurement is feasible. The second step in the research procedure is (supposing the first condition is met) measurement of differences between delinquent and nondelinquent samples with
' For example, see PAUL W. TAPPAN, JUvENn.E DELINQUENCY, New York: McGraw-Hill Book Company, 1949 pp. 428-436; WALTR C. REczss, THE CRimE PROBLEM, New York: Appleton-Century-Crofts, 1950, chap. 19; and GORDON W. ALLPORT, ThE NATRa OF PERSONALITrr: SELECTED
PAPERs, Cambridge: Addison-Wesley Press, 1950, p. 27.
2Descriptions of antisocial attitudes usually reflect the theoretical or therapeutic viewpoint of the author. As a result of this an almost unlimited conglomeration of factors have been advanced, by one person or another, to delineate antisocial attitudes held by delinquents. Among the items frequently listed as constituting antisocial attitudes are: (1) hostility toward authority and discipline, (2) dis-like of school, (3) blaming others for present misfortune, (4) belief in using illegitimate means to secure desired ends, (5) disbelief that others hold basic social values, (6) dislike of work, (7) desire for money and excitement, (8) feeling of insecurity or dependency, (9) strong peer group loyalty, and (10) dis-respect for the property rights of others.
3 The necessity of identifying relevant variables as a prerequisite to attitudinal research has been
expressly emphasized by leading scholars in the field for some time. (For example, by Cartwright and Stouffer. DoRwIN P. CARTwRiGmr, "Analysis of Qualitative Material," RESEARCH METHODS IN ran BEHAVORIAL SCIENCES, ed. Leon Festinger and Daniel Katz, New York: The Dryden Press,
1953; SAMUEL A. STOUFFER ET AL., THE AMERICAN SOLDIRi: ADJUSTMENT DURING ARMYr LmFE,
Princeton: Princeton University Press, 1949, chap. 1). Yet, the fact remains that criminological research pertaining to delinquent attitudes which meet even these minimum requirements of science
ATTITUDES TOWARD STEALING
respect to their attitudes toward stealing. Admittedly, identification of a single attitudinal variable does not indicate the configuration of factors which may in time be shown to constitute the complex termed antisocial attitudes. Still, delineation of the particular complex of attitudes held by delinquents must proceed step by step as data becomes available. Further research alone can establish whether or not the prevalence of stealing content-area is an integral part of the delinquent attitude structure.4
METHODOLOGY
Attitudinal data was obtained from four populations, three of which consisted of nondelinquent subjects. These three included a control group of nondelinquent public school boys, a group of public school girls,- and an older group of college students.6
Three nondelinquent groups were used in order to broaden the theoretical implications of the study. In the analysis of the relationship of demographic factors to the attitude variable, however, the control group of nondelinquent boys was alone contrasted with the delinquent boys.
The delinquent sample employed in this research consisted of 108 incarcerated boys at a Southern state reformatory. A sample of 99 public school boys was selected as a control group. Both groups were composed of boys 14 through 17 years of age. The two samples were closely matched for age and, to a lesser extent, for intelligence and socioeconomic status. In all, data for control or comparison of demographic factors were secured pertaining to the following seven characteristics: (1) age, (2) intelligence quotient, (3) educational retardation, (4) rural-urban differentiation, (5) father's occupation, (6) marital status of parents, and (7) number of children in family.
An attitude scale in the content-area of stealing was constructed and administered to the four populations. Guttman's theory and methodology of attitude measurement were employed in the formulation of the scale as well as in the subsequent comparison and analysis of attitudinal differences.7
The original scale contained 12 items. Two of these items were formed to be non-scale questions according to scalogram criteria and were, therefore, eliminated. From the remaining ten items, five were selected which provided the most satisfactory range in marginal frequencies between the 20-80 per cent limits. This five-item scale provided the means whereby a scalogram comparison of delinquent and
nondelin-4 For an investigation of additional attitudinal variables pertaining to delinquency see JOHN C. BALL, "A Scale and Factorial Analysis of Delinquent Attitudes, " unpublished Ph.D. dissertation, Vanderbilt University, 1955.
5 These girls were 84 public school students in grades 8 through 11. They were the classmates of
the nondelinquent boys, whose characteristics are described below.
6 The college sample consisted of 82 students enrolled in introductory sociology classes at a
South-ern University. Of this number, 60 were male and 22 female.
7 The Cornell Technique was used in the scaling procedure. Criteria of scalability and computation
of the coefficients of reproducibility followed the Guttman methodology of attitude measurement presented in MEASUREMENT AND PREDICTION; SAIIUEL A. STOrr'ER ET AL., MEASUREMENT AND
JOHN C. BALL
quent attitudes toward stealing was effected.8 The attitude schedule was administered to the four groups by the author in classroom situations. Subjects were instructed not to sign the schedule. A standard procedure of administration was followed in each case.9
Attitude Toward the Prevalence of Stealing Content-Area 1. Do you think many people are honest?
1. Almost all of them
2. Most of them (Circle one answer)
3. Some of them 4. Only a few of them
5. None of them
*2. How many people would steal something if they had a good chance? 1. All of them
2. Most of them (Circle one answer)
3. About half of them 4. Few of them
S. None of them
8 The 12 items tested for unidimensionality in the stealing content-area are listed below. The
two non-scale items were I and 5. (Question I seemed to refer to another content-area in that it asked about honesty rather than stealing; the former term was, apparently, too vague. In question 5 another variable-parents-was introduced which seemed to confuse the answers.) The remain-ing 10 items scaled satisfactorily. From these 10 items, five were selected on the basis of range of marginal frequencies. This five-item scale was used in the subsequent four-group comparison of de-linquent and nondede-linquent attitudes toward stealing.
The procedure employed in the administration of the schedule requires careful consideration because the replies of deviant groups, and especially delinquent groups, are frequently suspected of falsification. Perhaps this tendency to attribute dishonesty to out-groups is justified; perhaps it it not. But in any case, it is a question which must be considered in this study.
A standard procedure of administration was adhered to in each case. The purpose of the study was briefly explained to each group ("to determine what students think about various topics"), no time limit was established with regard to completion of the schedule, and questions concerning pro-cedure were answered.
It may be said that there is external and internal evidence pertaining to this topic. By external evidence is meant the circumstances of administration which afford indications of truthful responses. Thus, if a boy wants to know whether his answers will be placed on the reformatory record, it seems reasonable to infer that he is not determined to give false replies. Or again, if a boy asks whether a particular item refers to his attitude or that of someone else, it seems reasonable to suppose that he is giving the question careful consideration. These two examples, as well as many others which oc-curred during the administration of the schedule, appear to indicate that the questions were answered without conscious falsification.
By internal evidence pertaining to the truthfulness of responses is meant information contained within the completed questionnaire itself. On this point, the primary evidence is found in the nature of scalogram analysis itself. Since the scalogram comparison is not based upon replies to a single question, falsification would necessitate systematic or consistent fabrication. Statistically, with reference to the Guttman technique of analysis, this would be most difficult to accomplish. It is maintained, therefore, that there is little or no evidence to indicate conscious and systematic falsifi-cation of responses by any of the respondent groups.
* The five starred items were those employed in the scalogram comparison of the four groups. In each of these items the same response categories were used, and the dichotomization of these responses proved to be similar with categories 1-3 positive, 4-5 negative. Marginal frequencies of these five items ranged from 26 per cent to 73 per cent positive responses: item 6, 26%; No. 9, 37%; No. 8, 47%; No. 2, 50%; and No. 3, 73%.
ATTITUDES TOWARD STEALING
*3. Do you think many people have taken things at some time?
1. All of them
2. Most of them (Circle one answer)
3. About half of them 4. Few of them
5. None of them
4. Do you think many people would steal money if they had a good chance?
1. All or almost all of them
2. Most of them (Circle one answer)
3. Some of them 4. Only a few of them 5. Very few or none of them
5. Do you think many people would steal from their parents? 1. All of them
2. Most of them (Circle one answer)
3. About half of them 4. Few of them 5. None of them
*6. Do you think many people would steal from their friends? 1. All of them
2. Most of them (Circle one answer)
3. About half of them 4. Few of them 5. None of them
7. Do you think many people would steal from their best friend? 1. Almost all of them
2. Most of them (Circle one answer)
3. About half of them
4. Only a few of them 5. None of them
*8. How many people would steal from a store if they had a good chance? 1. All of them
2. Most of them (Circle one answer)
3. About half of them 4. Few of them 5. None of them
*9. How many people would steal from a school if they had a good chance? 1. All of them
2. Most of them (Circle one answer)
3. About half of them 4. Few of them
S_ None of them
10. Do you think many people would steal from the place where they work? 1. All of them
2. Most of them (Circle one an
3. About half of them 4. Few of them S. None of them
11. Do you think many people would steal money from a hospital if they had a good chance?
1. Almost all of them
2. Most of them (Circle one an!
3. Some of them 4. Only a few of them
5. None of them
swer)
JOHN C. BALL
12. Do you think many people would steal money from a church?
1. Almost all of them
2. Most of them (Circle one answer)
3. Some of them 4. Only a few of them 5. None of them
FNDL- Gs: ATTITUDES TOWARD STE.LING
The stealing content-area was found to meet the criteria for unidimensionality.I0 A coefficient of reproducibility of .94 was established for the combined groups, while the scale responses of each group taken separately were found to have a reproduci-bility of .93 or above. Thus, the attitude area was found to be scalable among four diverse populations. The scalogram findings, then, offer support for maintaining that the prevalence of stealing content-area is a single attitudinal variable which is susceptible of measurement.
TABLE I
DISTRIBUTION OF SCALE TYPES FOR DELINQUENT, NoN-DELINQUENT MALE, NoN-DELINQUENT
FEmALE, AND COLLEGE POPULATIONS IN THE ATTITUDE TOWARD
THE PREVALENCE OF STEALING CONTENT AREA
Group ... .. I (2) (3) (4)
N Stealing Scale D ND, M ND. F Colege
NO.
I
Percent No. Percent No. Percent No. Percent- 0 14 13.1 1 32 33.0 45 53.6 23 28.0
-- 1 17 15.9 28 28.9 17 20.2 34 41.4
+ 2 15 14.0 i 13 13.4 4 4.8, 9j 11.0 + "I 15 14.0 1 4 4.1 6 7.1 3
1
3.7+ 4 15 14.0 ! 10 10.3 2 2.4 10 12.2
+ 5 31 29.0 10 10.3 10 11.9 3 3.7
P Total 107 100.0 97 100.0 84 100.0 82 100.0
Coefficient of reproducibility for four groups = .94. N = 370. C.R. =501 + 460 + 392 + 391
5(107 +97 +84 +82)
1744
14 = 94.27% 1850
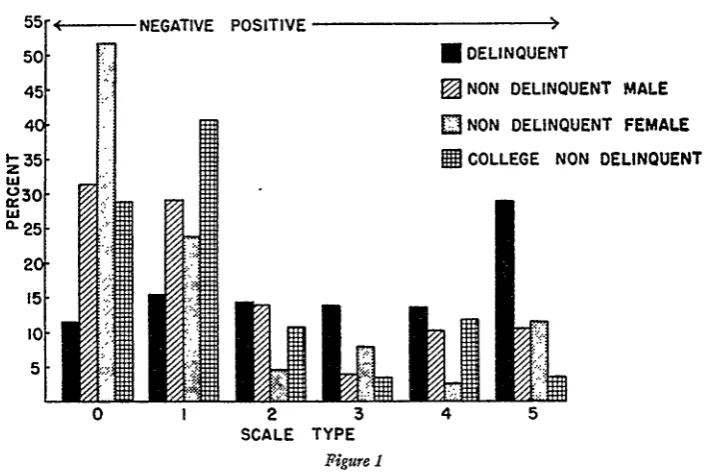
With the empirical identification of the attitude toward stealing variable estab-lished, a comparison between the delinquent and nondelinquent populations was undertaken. Marked differences among the four groups were observed. Table I and Figure 1 show the extent of these attitudinal differences.
In Table I, the attitudinal differences among the four groups are presented. It may be observed that a larger percentage of delinquents than of nondelinquents is found
10 Reproducibility was over 90 per cent, errors were randomly distributed, a wide range of marginal frequencies was obtained, and the number of items and response categories appeared adequate. Concerning the number of items it should be noted that scalability was established for the ten item scale, but subsequent comparison between the four populations was undertaken with the five item scale since further differentiation resulting from use of additional items was unnecessary.
ATTITUDES TOWARD STEALING
50 DELINQUENT
45 - NON DELINQUENT MALE
4C NON DELINQUENT FEMALE
1-35 COLLEGE NON DELINQUENT
M30-
0-25-
20-15
0 1 2 3 4 5
[image:8.454.46.400.59.296.2]SCALE TYPE Figure 1
Attitude toward stealing: four group comparison of scale types (Source, Table 1).
in each of the positive (or "delinquent") scale types, that is, in scale types 2, 3, 4 and 5. Conversely, a larger percentage of the nondelinquents-within each of the three nondelinquent groups-is contained ir. scale types 0 and 1, at the negative end end of the continuum." Group 3, the adolescent girls, had the most negative attitudes toward stealing, 54 per cent were in scale type 0 and only 26 per cent were contained in the four positive scale categories. Although Group 4 was only slightly less negative in their attitudes (69 versus 74 per cent negative) than Group 3, it is worth noting that the model category for the college students was scale type 1 rather than 0, as is the case for the other two nondelinquent groups.12 Attitudinal differences between the delinquent and nondelinquent groups were most marked at the respective ends of of the scale continuum. Thus, within scale type 5-the most positive attitude toward stealing-are found from two to eight times as large a percentage of delinquents as nondelinquents (delinquents 29 per cent versus 10, 12, and 4 per cent respectively for the three nondelinquent groups). Meanwhile, in scale type 0-which indicates the most negative attitude toward stealing-the percentage of the respective nondelin-quent populations exceeds the percentage of delinnondelin-quents by two, three, and four times (13 per cent of the delinquents versus 33, 54, and 28 per cent of the nondelinquents). A further indication of the extent of attitudinal differences between delinquentsand nondelinquents is provided by Table II. In this two-class division of the six scale types the delinquent boys are compared with the nondelinquent control group. It
n Use of the terms positive and negative is not meant to imply that an invarient-cutline point--or zero point-has been established in the scale continuum; rather, the two terms are used as a means of designating opposite ends of the attitude continuum.
12 The percentage corresponding to the model scale type for each group is underlined in Table X.
JOHN C. BALL
TA.BLE II
TwO-CLASS DIVISION OF DELINQUENT AND NoN-DELINQUENT JUVENILE MALE POPULATIONS BY SCALE TYPES
Scale Type Delinquents Non-delinquents
S T Percent Pecent
Negative ... . . 0-1 I 29.0 61.9 Positive ... 2-5 71.0 38.1
100.0% 100.0%
Source: Table 1.
may be seen that 71 per cent of the delinquents are within the four positive scale types, while 62 per cent of the nondelinquents are within the two negative scale types. The data, then, tend to support the thesis that the delinquents consider stealing to be a much more prevalent phenomenon than do the nondelinquents.3
It is significant to note in the comparison of the delinquent and three nondelinquent groups that the attitudinal differences evidence certain consistencies. Thus, the percentage of the delinquent group in each of the positive scale types exceeds the percentage of each of the three nondelinquent groups. The obverse is true with reference to the negative scale types: in each scale type the percentage of nondelinquents ex-ceeds the percentage of delinquents, this is the case for each of the three nondelinquent
groups. Further, as previously mentioned, the attitudinal differences between the
delinquent and nondelinquent groups are most marked at the ends of the scale con-tinuum.
In addition, the four group comparison presents data pertaining to age, sex and educational differences as these may be related to attitudes toward stealing. It is noteworthy that the adolescent girls have less positive attitudes toward stealing than the adolescent boys (nondelinquent boys). Indeed, these teen-age girls have the most negative attitudes of the four groups. This fact may well reflect a differential internalization of a cultural pattern-girls are less often involved in associations which condone and undertake stealing, and largely as a consequence of this have less positive attitudes toward stealing. Further, the fact that adolescent girls have more negative attitudes than older females suggests that there is a certain disposition to accept and uphold extreme viewpoints, the familiar "black-and-white" world of youth, at this stage in the socialization process. On this point, it should be noted that a larger percentage of the nondelinquent boys are found in scale type 0 than among the other two groups-college students and delinquents. Concerning the college students, it seems likely that advancing age and education results in a more realistic and less extreme conception of life and hence, more moderate attitudes toward stealing.
Quite clearly the delinquents have moved in the other direction insofar as socializa-tion is concerned. The data indicate a sharp division between the delinquent boys on
13 From an inspection of Table II, it may be noted that the Stealing Scale differentiates delinquent from nondelinquent boys to a considerable extent. It is suggested that this scale may afford a means of predicting delinquency. The validity of this scale with reference to predicting delinquency, of
course, would have to be empirically established by further research.
A TTITUDES TOWARD STEA LING
the one hand and the three nondelinquent groups on the other. The delinquents consistently hold the most positive attitudes toward stealing and, at the same time, have repeatedly associated with persons who engage in theft. They have internalized positive attitudes toward stealing.
RELATIONSHIP TO DEMOGRAPHIC FACTORs
In Tables 3 through 9 the delinquent group is contrasted with the nondelinquent control group with respect to demographic factors and the relationship of these factors to attitudes toward stealing. These tables permit an analysis of the relationship between the attitude toward stealing variable and such factors as age and intelligence. In addition, the tables provide data pertaining to the general demographic similarities and differences between the two groups of boys-delinquent and nondelinquent.
From Table III it may be seen that there is no consistent relationship for either
TABLE III
ATTITUDE ToW. nD STEALING FOR DELINQUENT AND -TON-DELINQUENT POPULATIONS BY AGE OF SUBJECT
Negative Attitude (0, 1) Positive Attitude (2-5)
Age D ND D, ND
No. ]Percent No. I Percent No. Percent No. Percent
14 6 42.9 1 13 61.9 8 57.1 8 38.1
15 8 20.5 20 69.0 31 79.5 9 31.0
16 1 12
I36.4
i 16 53.3 21 63.6 14 46.717 i 5 23.8 11 64.7 16 76.2 6 35.3
Delinquents: mean age = 16.1 yrs.; non-delinquents: mean age - 16.0 yrs. N = 204.* P < .95.
* (3 cases omitted (1 15 yr. old delinquent and 2 non-delinquents aged 16 and 17) because of incomplete scale data; in computing the mean ages these 3 cases were included.)
TABLE IV
ATTITUDE TOWARD STEALING FOR DELINQUENT AND NoN-DELINQUENT POPULATIONS BY INTELLIGENCE QUOTIENT OF SUBJECT
Negative Attitude (0, 1) Positive Attitude (2-5)
L Q. I D ND D
I
NDNo. Percent No. Percent No. Percent No. Percent
60-69 2 40.0 0 - 3 60.0 0
-70-79 7 43.8 2 100.0 9 56.2
-80-89 6 ;28.6 8 53.3 15 71.4 7 46.7
90-99 4 r23.5 17 63.0 13 76.5 10 1 37.0 100-109 4 28.6 12 60.0 10 71.4 81 40.0 110-119 1 '20.0 10 66.7 4 80.0 5 j33.3
120-129 0 0
0
- 0 - 2 100.0Delinquents: mean I. Q. = 89.3; non-delinquents: mean I. Q. = 99.9; P < .001. N = 159.*
* 3 cases not herein tabulated because of incomplete attitude data were included in computing
the mean I. Q.'s; these 3 consisted of one delinquent (I. Q. 80-89) and two non-delinquents (I. Q.'s 100-109 and 120-129).
[image:10.454.51.403.238.361.2] [image:10.454.55.399.418.568.2]JOHN C. BALL
TABLE V
ATTITUDE TOWARD STEALING FOR DELINQUENT AND NoN-DELINQUENT
POPULATIONS BY EDUCATIONAL RETARDATION oF SUBJECT
Negative Attitude (0, 1) Positive Attitude (2-5)
-No. ofyear
I
RetardedDN RtrdD ND D )
i
. NDNO. Percent No. Percen No. - Percent No. Percent
0 2 .25.0 36! 66.7 6 750' 18 33.3
1 13 1 55.9 11 68,7 151 44.1
233 1 9 50.0 16 '84.2 4 50.0
3 81. 16 66.7 0
4ormore 13 32.5 0 - 27 67.5 0
= 107.2. P < .001. N = 204.*
* In Tables V-VIII, three additional cases were included in the computation of the chi square. They were not included in tables I-IV, inc.
group between age and the attitude variable. It cannot be said, then, that the data indicate a relation between chronological maturation and developing negative (or positive) attitudes toward stealing for either population. The mean age of both samples is quite similar-16.1 versus 16.0 years-and there is not any statistically
significant difference between the two age distributions.
In Table IV the intelligence quotients of the two groups of boys are presented in
relation to positive and negative scale types. Among the delinquents those subjects with below normal I. Q.'s-60 to 79-appear to have a more negative attitude
to-ward stealing than those with more normal intelligence test scores. Among the
non-delinquents, no relationship is indicated between intelligence and attitude toward
stealing.
The ten point below normal I. Q. reported for the delinquent sample is comparable with results obtained from other studies of incarcerated offenders.4 In this regard, however, it is pertinent to mention that the 108 delinquents selected from the larger reformatory population were the more intelligent and educationally advanced boys since only boys in the fifth grade or above were included in the sample.15
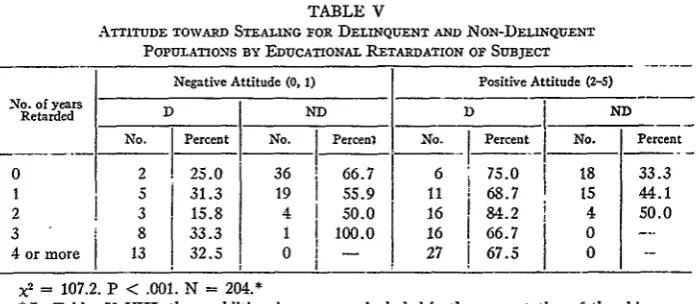
A rather pronounced contrast between the two groups with respect to educational
achievement-or the lack thereof-is presented in Table V. Among the delinquents,
11
Commenting on five such studies, Kvaraceus states that, "There is approximately a ten-point difference between the delinquents and controls on the I. Q. scale." WILLIAM C. KVARACEUS, ThE COMMUNITY AND THE DELINQUENT, New York: World Book Company, 1954, p. 94.15 This fact undoubtedly accounts for the lower percentage of the delinquent population with . Q.'s below 70, 6.3 percent, than reported by Carr, 24.6 percent, on the basis of several earlier
studies; LOWELL JULLIARD CARR, DELINQUENCY CONTROL, New York: Harper and Brothers, 1940, p. 84. Reinemann reports that 44 percent of the children in his sample of 220 truants had an I. Q. of 85 or below; JOHN OTTO REINEMANN, The Truant Before the Court, FEDERAL PROBATION, Vol. 12 (Sept., 1948), p. 11. In the present case, some 41 percent of the delinquent boys for whom data was obtainable had 1. Q.'s of 85 or below.
Delinquents below the fifth grade were not included in the present study because it was found the:,, were incapable of answering the required questions-in the lower grades: many of the boys were virtually illiterate.
ATTITUDES TOWARD STEALING
TABLE VI
ATTITUDE TOWARD STEALING FOR DELINQUENT AND NoN-DELINQUENT POPULATIONS BY PLACE OF RESIDENCE
Negative Attitude (0, 1) Positive Attitude (2-5)
Place of
Residence D
j
ND D NDNo. IPercent I No. IPercent No. Percent No. Percent
Rural 3 18.7 6 42.9 13 81.3 8 57.1
Urban 27 30.3 54 65.1 62 69.7 29 34.9
= .000137. P > .99. N = 202.
TABLE VII
ATTITUDE TOWARD STEALING FOR DELINQUENT AND NoN-DELNQUENT POPULATIONS By
OCCUPATION OF SUBJECT'S FATHER OR STEP-FATHER
Negative Attitude (0, 1) Positive Attitude (2-5)
Occupatior D I ND D ND
i-- -_
No. Percent No. Percent No. Percent No. Percent
Proprietary, Managerial and I
Professional 0 - 4 66.7 5 100.0 2 33.3
Skilled labor.. 4 57.1 8 50.0 3 42.9 8 50.0
Semi-skilled. i 8 27.6 28 65.1 21 72.4 15 34.9 Unskilled ... 2 28.6 4 80.0 5 71.4 1 20.0 Official, Clerical, Sales... 2 50.0 6 66.7 2 50.0 3 33.3 Farmer ... . 1 14.3 4 57.1 6 85.7 3 42.9
= 3.96. P < .70. N = 145.
83 per cent were retarded in educational placement one or more years, while among the nondelinquents the comparable figure was 43 per cent.1"
Within the delinquent population there is no evident relationship between amount of educational retardation and the attitude variable. In the case of the nondelinquent population, however, those boys who are retarded in grade pjacement have more positive attitudes toward stealing; so that, educational failure and belief in the pre-valence of stealing are positively related.
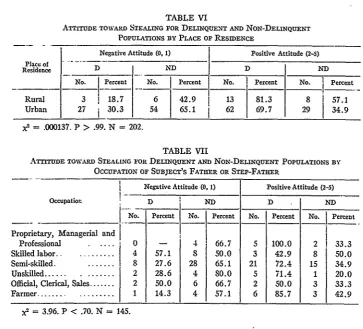
From Table VI it may be noted that boys who are classified as rural have more positive attitudes toward stealing than those whose place of residence is urban. This is the case among both the delinquent and nondelinquent populations. Some 15 per cent of each sample is rural by place of residence.
The relationship of the stealing variable to the occupation of the subject's father (or step-father) is presented in Table VII. Within the delinquent population, a
16 The percentage of delinquents retarded in grade placement reported here is somewhat higher
than previously noted in other studies. For example, the Gluecks reported 84.5 percent of their de-linquent sample of 935 cases retarded one or more years; SHELDON and ELEANOR GLUECK, ONE
THOUSAND JuvENiLE DELINQUENTS, Cambridge: Harvard University Press, 1934, p. 87. In their
more recent study, the Gluecks report 68.6 percent of the delinquents retarded one or more years in school; UNRAvELING JuvENI:F. DELINQUENTS, New York: The Commonwealth Fund, 1950, p. 137.
[image:12.454.39.403.51.380.2]JOHN C. BALL
TABLE VIII
ATTITUDE TOWARD STEALING FOR DELINQUENT AND NON-DELINQUENT POPULATIONS BY PARENTAL MAKE-UP OF HomE
Negative Attitude 0(0. 1) Positive Attitude (2-5)
Where Boy Lives D ND D ND
No. Percent No. Percent No. 1 Percent No. Percent
With hisparents ... 19 38.0 50 61.0 31 62.0 1 32 39.0
Mother ... 3 16.7 5 71.4 15 83.3 2 28.6
Mother remarried ... 4 I 22.2 5 83.3 14 77.8 1 16.7
Father ... 1 20.0 0 4 80.0 0
-Father remarried ... 3 37.5 0 - 5 62.5 1 100.0 Away fromhomet ... 1 14.3 0 - 6 85.7 1 100.0
x2 = 30.90. P < .001. N -203.
t Living with relatives, or elsewhere.
positive attitude toward stealing is inversely related to occupational status. Hence, if the proprietary category is excluded, the occupations may be ranked from most to least positive as follows: farmer, semi-skilled, unskilled, clerk and sales, and skilled labor. Within the nondelinquent population, the variation in the percentage of posi-tive scale types for the several categories is noticeably less than in the delinquent sample, so that no relationship seems to be indicated.
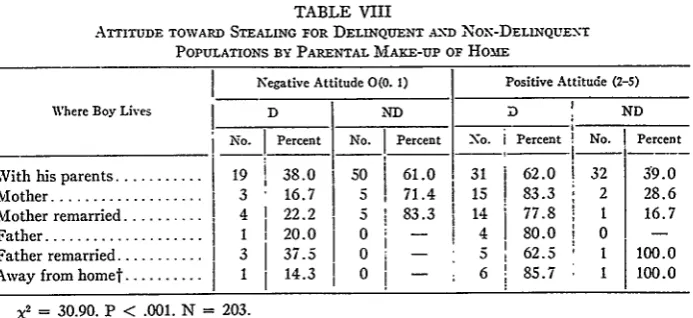
In Table VIII the relationship of the attitude variable to the marital status of the boy's parents is presented. Among the delinquents, a larger percentage of the boys from broken homes have, in each of the five categories, more positive attitudes to-ward stealing. Further, it is pertinent to note that those who live in a home where only one parent is present (that is, with mother or father who has not remarried) have more positive attitudes than those who live in a home which has been reestab-lished by marriage (in which one parent has remarried). The delinquents who possess the most positive attitudes toward stealing are those who live away from home; i.e., with neither parent. Thus, it may be said that attitudes toward stealing among the delinquents are least positive if the boys come from homes in which both parents are present. The percentage of positive attitudes increases consistently as the home becomes less stable. Finally, those boys who live away from home have the most positive attitudes toward stealing.
Among the nondelinquents, the relationship of marital status to the attitude variable is less evident, partly-it may be supposed-because the number of cases in several of the categories is quite small. Still, it must be observed that the data, limited though they may be, indicate a slightly less positive attitude toward stealing among the boys from broken homes, 39 compared with 33 per cent. In view of this, it seems reasonable to conclude that little relationship between marital status and attitude twoard stealing among the nondelinquents is evident from the data.Y7
17 It seems likely-and the data support such a viewpoint-that broken homes are not directly
ATTITUDES TOWARD STEALING
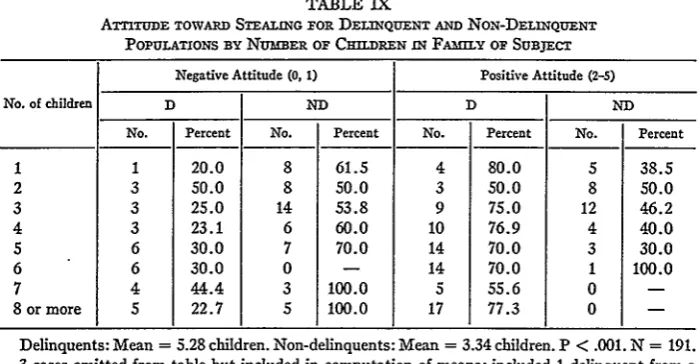
TABLE IX
ATTITUDE TOWARD STEALING FOR DELINQUENT AND NON-DELINQUENT
POPULATIONS BY NUMBER OF CHILDREN IN FAMY op SUBJECT
Negative Attitude (0, 1) Positive Attitude (2-5)
No. of children D ND D ND
No. Percent No. Percent No. Percent No. Percent
1 1 20.0 8 61.5 4 80.0 5 38.5
2 3 50.0 8 50.0 3 50.0 8 50.0
3 3 25.0 14 53.8 9 75.0 12 46.2
4 3 23.1 6 60.0 10 76.9 4 40.0
5 6 30.0 7 70.0 14 70.0 3 30.0
6 6 30.0 0 - 14 70.0 1 100.0
7 4 44.4 3 100.0 5 55.6 0
-8 or more 5 22.7 5 100.0 17 77.3 0
-Delinquents: Mean = 5.28 children. Non-delinquents: Mean = 3.34 children. P < .001. N = 191.
3 cases omitted from table but included in computation of means: included 1 delinquent from a family of 6 children and 2 non-delinquents-one from a family of 6 children, the other an only child.
From Table VIII it may also be seen that a significantly larger number of delin-quents than nondelindelin-quents came from bioken homes. The percentage of eachpopula-tion, delinquent and nondelinquent respectively, which came from broken homes was 53 and 15. This finding is consistent with results obtained from comparable studies.'s
Another factor related to family life which has been frequently investigated in delinquency studies is the number of children in the subject's family of orientation. In Table IX the attitude variable is related to this factor. In neither group is there a consistent relationship observable; it is concluded, therefore, that the size of the boy's family is not related to his attitude toward stealing."'
INTERPRETATION Op FLNDINGS
In reviewing the research findings, it seems pertinent to relate the statistical
analysis to the socialization process and, at the same time, offer by way of interpre-tation several hypotheses pertaining to delinquent behavior. There are several reasons
limited usefulness in calculating the degree of instability and absence of training within the home, although broken homes unquestionably indicate the presence of such disruptive forces. At the same time, the fact that a husband and wife are not separated does not preclude the existence of conditions within the family which are conducive to criminality of their children.
18 Research indicates that 30 to 60 percent of delinquents come from broken homes; EDWIN H.
Sun RLAND and DONALD R. CREssEY, PRUNCIPlMS OF CRIMNOLOGY (5th ed.), New York: J. B.
Lippincott Company, 1955, p. 175.
19 Most studies have reported that delinquents come from larger families than nondelinquents
(DoNAD R: TAPT, CRIMINOLOGY, New York: The Macmillan Company, 1950, p. 146). In the present instance, the mean number of children in the families from which the delinquents came was 5.3; the comparable figure for the nondelinquents was 3.3 children. The Gluecks report for families of de-linquents and nondede-linquents, respectively, means of 6.85 children and 5.90 children; UNRAVELING
[image:14.454.49.399.65.247.2]JOHN C. BALL
for relating the development of delinquency to the socialization process. The most compelling reason appears in that delinquent behavior is learned.20 Thus, criminality may be viewed as a failure of socialization; it is also a failure on the part of the indivi-dual to accept (internalize) recognized norms. In reviewing the findings of this study, then, attention will be directed toward a determination of those factors which do and those which do not seem to be related to delinquency, or, more precisely, to the internalization of positive attitudes toward stealing.
Analysis of the data supports the view that chronological maturation (within the age range included in this study) is less important in the socialization process than other factors. Thus, the mere passage of time apparently is less significant than what occurs during this passage of time, for example, what the boy learns. Capacity to learn, as this is measured by intelligence tests, also would seem to have little relation to those aspects of the internalization process under investigation here, with the exception that delinquent boys of below normal intelligence have progressed less readily in accepting antisocial attitudes than those of normal capacity.
Formal education apparently has little visible effect upon the delinquents, or at least there is an absence of differentiation within the group. It seems probable that the delinquents expect little from their schooling and are not disappointed with the actuality. The retarded public school students, however, have a more positive at-titude toward stealing than those who are not behind in their schooling. This differ-ence may reflect the fact that, for these boys, failure in school is an important failure in life. It concerns them because they have already accepted prevailing middle-class educational expectations.
It will be recalled that in both populations the rural boys held more positive atti-tudes toward stealing. The data offer little evidence which might account for this occurrence. Yet a hypothetical statement may be relevant. It may be that stealing is more of an urban pattern due to the fact that property rights are still more sacred and personal in the rural environment, hence the predominance of delinquency in urban areas. At the same time, those rural boys who are delinquent possess more hostile and antisocial attitudes because they have placed themselves outside of the approved behavior of the family group, and in the rural community such separation is of greater impact upon the boy than it would be in an urban environment since a much greater part of rural life is family centered. An additional consideration is that among rural parents there is a resentment against outside interference with domestic problems; hence, it is more likely that misdeeds of rural children will be dealt with at home. Consequently, it is only the more serious rural offenders who are removed from their homes and punished by incarceration.21
20 Criminal behavior is learned in the sense that Sutherland used the term in his theory of differ-ential association; SUTHERLAND AND CRESSEY, op. cit., pp. 77-79.
21 On this point, BLoMH and FLvNN state, "Delinquent children in rural areas, therefore, are fre-quently handled by the families, relatives, or friends, or by a minister or priest, or are treated by reprimand or quasi-official supervision by the local police. The result is that large numbers of children who would be officially identified as delinquents in urban areas and who thus would figure in our comparative statistics, find no place whatever in our comparative appraisals of rural and urban delinquent trends." (HERBERT A. BLOcH and FRANK T. FLYNN, DELINQUENcY, New York: Random House, 1956, pp. 47-48.) If this interpretation is correct, it might account for the more positive attitudes toward stealing among apprehended rural delinquents.
ATTITUDES TOWARD STEALING
In noting that positive attitudes toward stealing are more common among delin-quent from lower class homes, Table VII, it may be a manifestation of the hypothesis that stealing as a social phenomenon may be described as the differential acceptanc
and internalization of a cultural pattern.22 Thus, stealing-or the type of stealing boys
get sent to a reformatory for-is a more prevalent cultural pattern among the lower socioeconomic classes.2 3
Two comments are in order with respect to relationship of family life to the failure of socialization. First, it was observed within the delinquent population that boys from broken homes had more positive attitudes toward stealing than those who were from more stable families. Such a finding is in general agreement with current crimino-logical research. Yet it seems probable that broken homes per se have been over-emphasized in the search for factors of etiological significance. Second, it seems likely. and as Sutherland and Caldwell maintain, that broken homes are but an indication of other more far-reaching and dynamic family deficiencies which are in turn condu-cive to delinquency.4 In any event, the findings offer support for the contention that it is the personality building resources of the family rather than its legal status which has significance in the socialization process. Such an interpretation also provides an explanation for the absence of relationship between size of family and the stealing variable. Thus, mere number of children is less important in the socialization process than the conditions which determine what is learned in the family group, whatever the size.
22 This hypothesis may be considered as a corollary of Sutherland's theory of differential associa-tion. Thus, the existence of a cultural pattern which condones certain acts of theft varies with such factors as socioeconomic status and rural-urban differentiation; individuals are subjected to differ-ential associations which, to a greater or lesser extent, approve or disapprove of stealing as a form of behavior.
What the differential association theory fails to explain, and what must be explained if a compre-hensive theory of criminal behavior is to be realized, is the dynamics of the internalization process whereby some persons accept while others reject delinquent patterns of behavior. Associations alone do not explain this process of internalization, for there is a differential internalization of delinquent patterns (including attitudes) among persons whose associations are similar. Sutherland, in part. recognized this and emphasized the individual's definition of the situation as an'important deter-mining aspect of delinquent behavior. Yet, merely stating that individuals differ in their interpreta-tion of situainterpreta-tions does not tell us why they differ and how these differences came about. And this is precisely the crucial problem.
23 This statement is not meant, however, to imply that low socioeconomic status in itself is con-ducive to delinquency, rather it is maintained that patterns of delinquent behavior are more preva-lent among the lower classes. Thus, the fact that no statistically significant difference was observed between the occupations in which fathers of delinquent and nondelinquent boys were engaged (Table VII) suggests that the more crucial aspects of socialization, insofar as delinquency is concerned, arc noneconomic. The findings, then, would seem to substantiate Shulman's contention that family in-come is of less importance in the development of delinquency than personal relationships; HARR,, MANUEL Smnmrau, The Family and Delinquency, TIFE ANNALS or THE AMERIcAN ACADEM'y Or
PoLITAzICA AN SoCLAL SCIENCE, Vol. 261 (January, 1949), pp. 27-29.
With reference to attitudes toward stealing, Smigel has recently reported a greater approval of stealing among persons of lower socioeconomic status; ER.N 0. SMirGEL, Public Attitudes Toward Stealing as Reated to the Size of the Victim Organization, AMER. SOClOL. rEv., 21 (June, 1956), p. 3 2 1.
2 1
SurunEA.D A-,\D CRESSEY, op. cit., Chap. 10; ROBERT G. CALDWELL, CRMINOLOGY, Neu York: The Ronald Press Company, 1956, pp. 230-240. The latter author stresses the criminogenic effect of homes which are "functionally inadequate whether or not they be broken."
JOHN C. BALL
CONCLUSION
The findings of this study indicate a pronounced difference in attitudes toward stealing between the delinquent sample of 108 boys and the three nondelinquent groups. The delinquents were found to possess a more positive attitude toward the prevalence of stealing than the nondelinquents.
Measurement of attitudinal differences was undertaken within the framework of scalogram theory and methodology. The attitude toward stealing content-area was tested for unidimensionality; the results established scalability of this attitudinal variable in four separate populations.
Attitudinal comparison of four populations lent support to these propositions: (1) males have more positive attitudes toward stealing than females, (2) adolescents hold more extreme attitudes, either positive or negative, in this area than older, more educated persons, and (3) the delinquents hold markedly more positive attitudes toward stealing than any of the other groups.
Analysis of the relationship of the stealing attitude variable to seven demographic factors within and between the delinquent group and nondelinquent control group yielded the following information. Among the delinquents, those from rural places of residence, from broken homes, and from families of lower socioeconomic status had more positive attitudes toward stealing than those with converse attributes. Within the nondelinquent control group, those boys who were from rural areas as well as those who were retarded in grade placement held more positive attitudes toward stealing than non-retarded and urban boys. Little or no association between the attitude variable and age of subject, intelligence, or number of children in subject's family of orientation was reported with respect to either of the two populations.
From the standpoint of criminological theory, the findings have been focused upon two points. First, it is suggested that the data offer substantiation for considering stealing a result of differential assimilation of a cultural pattern. In part, this hypothe-sis may be regarded as a corollary of Sutherland's theory of differential association. Second, the empirical identification of an attitudinal variable which, there is reason to suppose, may constitute an important part of the configuration of delinquent attitudes is regarded as offering a contribution to the delineation of antisocial atti-tudes. Specifications of what are and what are not elements of the attitudinal configu-rations which delinquents possess (and how these parts are related one to another) is a problem which further scientific investigation alone can resolve. The present research was formulated with the intent of providing data which may prove useful in such an undertaking.