A translational systems biology approach in both animals
and humans identifies a functionally related module of
accumbal genes involved in the regulation of reward
processing and binge drinking in males
David Stacey,
PhD
*
; Anbarasu Lourdusamy,
PhD
*
; Barbara Ruggeri,
PhD; Matthieu Maroteaux,
PhD; Tianye Jia,
PhD; Anna Cattrell,
PhD; Charlotte Nymberg,
PhD; Tobias Banaschewski,
MD,
PhD; Sohinee Bhattacharyya,
PhD; Hamid Band,
MD, PhD; Gareth Barker, PhD; Arun Bokde,
PhD; Christian Buchel,
MD; Fabiana Carvalho,
PhD; Patricia Conrod,
PhD; Sylvane Desrivieres,
PhD; Alanna Easton,
PhD; Mira Fauth-Buehler,
PhD; Alberto Fernandez-Medarde,
PhD; Herta
Flor,
PhD; Vincent Frouin,
PhD; Jurgen Gallinat,
MD; Hugh Garavanh,
PhD; Andreas Heinz,
MD,
PhD; Bernd Ittermann,
PhD; Mark Lathrop,
PhD; Claire Lawrence,
PhD; Eva Loth,
PhD; Karl
Mann,
MD; Jean-Luc Martinot,
MD, PhD; Frauke Nees,
PhD; Tomas Paus,
MD, PhD; Zdenka
Pausova,
MD; Marcella Rietschel,
MD; Andrea Rotter,
PhD; Eugenio Santos,
PhD;
Michael Smolka,
MD; Wolfgang Sommer,
MD, PhD; Manuel Mameli,
PhD; Rainer Spanagel,
PhD;
Jean-Antoine Girault,
MD, PhD; Christian Mueller,
PhD; Gunter Schumann,
MD; on behalf of the
IMAGEN consortium†
Correspondence to: D. Stacey, Discipline of Psychiatry, Level 4, Eleanor Harrald Building, Frome Road, University of Adelaide, Adelaide, 5005, Australia; [email protected]
*These authors contributed equally to this work.
†Consortium members are listed at the end of this article.
Submitted Apr. 22, 2015; Revised July 23, 2015; Revised July 26, 2015; Accepted Aug. 1, 2015; Early-released Dec. 15, 2015
DOI: 10.1503/jpn.150138
Background: The mesolimbic dopamine system, composed primarily of dopaminergic neurons in the ventral tegmental area that project to stria-tal structures, is considered to be the key mediator of reinforcement-related mechanisms in the brain. Prompted by a genome-wide association meta-analysis implicating the Ras-specific guanine nucleotide-releasing factor 2 (RASGRF2) gene in the regulation of alcohol intake in men, we have recently shown that male Rasgrf2–/–mice exhibit reduced ethanol intake and preference accompanied by a perturbed mesolimbic
dopa-mine system. We therefore propose that these mice represent a valid model to further elucidate the precise genes and mechanisms regulating mesolimbic dopamine functioning. Methods: Transcriptomic data from the nucleus accumbens (NAcc) of male Rasgrf2–/– mice and wild-type
controls were analyzed by weighted gene coexpression network analysis (WGCNA). We performed follow-up genetic association tests in hu-mans using a sample of male adolescents from the IMAGEN study characterized for binge drinking (n = 905) and ventral striatal activation during an fMRI reward task (n = 608). Results: The WGCNA analyses using accumbal transcriptomic data revealed 37 distinct “modules,” or function-ally related groups of genes. Two of these modules were significantly associated with Rasgrf2 knockout status: M5 (p < 0.001) and M6 (p < 0.001). In follow-up translational analyses we found that human orthologues for the M5 module were significantly (p < 0.01) enriched with genetic association signals for binge drinking in male adolescents. Furthermore, the most significant locus, originating from the EH-domain containing 4 (EHD4) gene (p < 0.001), was also significantly associated with altered ventral striatal activity in male adolescents performing an fMRI reward task (pempirical < 0.001). Limitations: It was not possible to determine the extent to which the M5 module was dysregulated in Rasgrf2–/– mice by
perturbed mesolimbic dopamine signalling or by the loss of Rasgrf2 function in the NAcc. Conclusion: Taken together, our findings indicate that the accumbal M5 module, initially identified as being dysregulated in male Rasgrf2–/–mice, is also relevant for human alcohol-related phenotypes
Introduction
Binge drinking is a major public health problem that is par ticu larly prevalent during adolescence.1 It constitutes an in
creased risk of substance use in later life as well as mental health problems throughout the lifespan.2,3 Early onset of ex
cessive drinking is one of the strongest predictors of a life time prevalence of alcohol dependence.4,5 The mesolimbic
pathway, which consists primarily of dopaminergic neurons in the ventral tegmental area (VTA) that send projections to the nucleus accumbens (NAcc), is considered to be a central regulator of alcoholrelated phenotypes.6 However, despite
the apparent importance of the mesolimbic pathway within the context of alcohol, the specific genes and mechanisms in volved are not fully understood.
Largescale genomewide association studies (GWAS) have recently implicated several novel genes in the regulation of alcoholrelated phenotypes in multiple populations.7,8 The ex
ploratory nature of GWAS is proving to be instrumental in fur thering our understanding of the precise mechanisms in the brain that regulate alcoholrelated phenotypes, particularly when combined with extensive followup functional work. In a recent GWAS metaanalysis of alcohol consumption (n > 20 000) we identified a novel malespecific signal in the RASGRF2 gene,9 and in further support of this, a followup
candidatebased analysis in a sample of male adolescents re vealed a significant association between a RASGRF2 polymor phism and frequency of binge drinking episodes.10
RASGRF2 encodes a Rasspecific guanine nucleotide
releasing factor that is widely expressed across human tissues with particular enrichment in the brain, where expression ap pears to be neuronspecific.11 It is a Ca2+/calmodulinregulated
protein responsible for coupling Nmethyld aspartate receptor (NMDA)–type and calcium permeable αAmino3hydroxy5 methyl4isoxazolepropionic acid (AMPA)–type glutamate re ceptors to mitogen activated protein kinase (MAPK) signalling cascades, including the extracellular signal–regulated kinase (ERK) pathway.12,13 Moreover, via the ERK pathway Rasgrf2 has
been shown to activate the cAMPresponse element binding (CREB) protein while also promoting longterm potentiation (LTP) in the mouse hippocampus.14
We recently performed behavioural and neurobiological phenotyping of a Rasgrf2–/–mouse strain in order to validate
and extend upon our GWAS signal implicating RASGRF2 in alcohol consumption.9 We found a significant reduction in
both ethanol intake and preference in male (no significant dif ferences were found in female mice) Rasgrf2–/–mice relative to
wildtype controls,10 which is in accordance with the male
specific GWAS signal.9 Male Rasgrf2–/– mice also exhibited de
creased mesolimbic dopamine neuron activity relative to con trols, which was accompanied by reduced ethanolinduced dopamine release in the NAcc.10 This blunted mesolimbic do
pamine response to acute ethanol indicates that the mech anisms underlying ethanol reinforcement in the NAcc would either be absent or mitigated, thereby explaining the reduced ethanol intake and preference observed in mutant mice.
Male Rasgrf2–/– mice therefore represent a convincing model
to further explore the precise mechanisms within the mesolim
bic dopamine system responsible for mediating the reinforcing effects of alcohol. Considering these mechanisms are coordin ated by multiple (as opposed to single) genes, in the present study we applied a systems biology approach to transcriptome wide mRNA expression data from the NAcc of male Rasgrf2–/–
mice and wildtype controls to investigate the downstream consequences of an altered mesolimbic dopamine system. We first used these data to construct a weighted gene coexpression network, from which we identified a group (or module) of functionally related genes associated with Rasgrf2 gene knock out (KO) status. We then validated the relevance of this module for human binge drinking and ventral striatal activation using a sample of adolescent boys from the IMAGEN project.15
Methods
Animal experiments
All procedures were carried out according to the UK Animals (Scientific Procedures) Act 1986, and ethics approval was granted by the King’s College London research ethics com mittee. In accordance with our previous article reporting sig nificantly reduced ethanol intake and preference in male Rasgrf2–/– mice relative to wildtype controls, but not female
mice,10 we investigated male mice only. All mice were born
and weaned from multiple litters in the Santos laboratory at the University of Salamanca, Spain, where the Rasgrf2–/– strain
is being maintained,11 and were then shipped to the UK, re
maining in quarantine until they cleared a health screen. We used 8 to 10weekold wildtype and Rasgrf2–/– C57BL/6
mice (9 per group), exclusively male, singlehoused with free access to food and water.11 Artificial light was provided daily
from 7 am to 7 pm (12 h light/dark cycle), and the room tem perature and humidity were kept constant (temperature: 22 + 1° C; humidity: 55 + 5%).
Tissue preparation, RNA extraction and transcriptomic profiling
We dissected the NAcc from animals and extracted total RNA using the RNeasy Micro Kit (QIAGEN). Total RNA was biotinylated and amplified using the Illumina TotalPrep RNA Amplification kit (Applied Biosystems), and transcrip tome profiling was performed using the Illumina Mouse WG6 version 2.0 Expression BeadChip (Illumina) as per the manufacturer’s protocol.
Human genetic association studies
In accordance with our animal experiments, we used data ex clusively from male participants in our human genetic associa tion studies. All participants were from the IMAGEN study. A detailed description of recruitment and assessment proced ures, as well as inclusion and exclusion criteria, has previously been published.15 In brief, the IMAGEN study is a multi site
neuroimaging data throughout. Participants were collected across 8 IMAGEN assessment centres (London and Notting ham in England; Dublin, Ireland; Mannheim, Berlin, Ham burg and Dresden in Germany; and Paris, France). Local ethics research committees at each site approved the study. On the day of testing, written informed consent was obtained from the parent or guardian and verbal assent was obtained from the adolescent.
Genetic data were available for a total of 907 male adoles cents of European origin from the baseline assessment of the IMAGEN sample (mean age 14.42 ± 0.41 [range 12.88– 16.04] yr). Binge drinking data were not available for 2 of these participants, leaving a total sample of 905 boys for binge drinking analyses. The binge drinking phenotype was defined as a binary phenotype (i.e., 0 v. 1) using the 2007 European School Survey Project on Alcohol and Other Drugs (ESPAD) questionnaire,16 where 699 (77.24%) had no previ
ous binge drinking episodes (0) and 206 (22.76%) had 1 or more previous binge drinking episodes (1). Neuroimaging analyses were performed using a subsample of the above mentioned 905 male adolescents consisting of 608 boys (mean age 14.41 ± 0.42 [range 12.73–16.04] yr) for whom fMRI data were also available. Of this subsample of 608 boys, 2 were lacking binge drinking data, 473 (78.05%) had no previous binge drinking episodes and 133 (21.95%) had at least 1 pre vious episode of binge drinking. These proportions of binge drinkers (1) versus non–binge drinkers (0) are highly com par able to the full sample.
Monetary incentive delay fMRI task
Our adapted version of the monetary incentive delay (MID) task consisted of 66 10s trials. In each trial, participants were presented with 1 of 3 cue shapes (cue 250 ms) denoting whether a target (white square) would subsequently appear on the left or right side of the screen and whether 0, 2 or 10 points could be won in that particular trial. After a vari able delay (4000–4500 ms) of fixation on a white crosshair, participants were instructed to respond by pressing the left or right button as soon as the target appeared. Feedback on whether and how many points were won during the trial was presented for 1450 ms after the response. A tracking al gorithm adjusted task difficulty (i.e., target duration varied between 100 ms and 300 ms) such that each participant suc cessfully responded on approximately 66% of trials. For each 5 points won, the participant would receive 1 reward in the form of small chocolate candies. Only successfully trials were included in our analysis.
DNA extraction and genotyping
DNA purification and genotyping were performed at the Cen tre National de Génotypage in Paris. DNA was extracted from whole blood samples (approximately 10 mL) preserved in BD Vacutainer EDTA tubes (Becton, Dickinson and Company) using a Gentra Puregene Blood Kit (QIAGEN) according to the manufacturer’s instructions. Genotype information was col lected at 582 982 markers using the Illumina HumanHap610 Genotyping BeadChip (Illumina). Details on quality control of genotype data are provided in Appendix 1, available at jpn.ca.
RNA extraction and gene expression profiling
Total RNA was extracted from whole blood cells using the PAXgene Blood RNA Kit (QIAGEN). Following quality control, labelled complementary RNA (cRNA) was generated using the Illumina TotalPrep RNA Amplification kit (Applied Biosys tems). Gene expression profiling was performed using Illumina HumanHT12 version 4 Expression BeadChips (Illumina). Expression data were normalized using the mloess method.
Statistical and bioinformatics analysis
Gene expression data processing
Raw intensity values were normalized by variance stabilization and quantile normalization using the Lumi Biocondcutor pack age.17 To reduce noise, probes not expressed above the back
ground (p < 0.01) and low varying probes estimated with coeffi cient of variation (CV < 0.01) were removed from subsequent analysis. The probe with the highest mean expression value was selected from multiple probes representing the same gene.
Mouse gene coexpression network analysis and module characterization
To identify modules (or groups) of functionally related genes within our mouse transcriptomic data, we applied weighted gene coexpression network analysis (WGCNA) as previously described.18,19 For further information on these analyses and
the methods used to characterize and prioritize modules for followup studies, refer to Appendix 1.
Module-based GWAS signal enrichment analysis
We used the efficient mixedmodel association eXpedited (EMMAX) software program to run the genomewide associ ation analysis for binge drinking.20 Further details are pro
vided in Appendix 1.
Functional MRI data analysis
Functional MRI data were analyzed using SPM8 (www.fil .ion.ucl.ac.uk/spm). Slicetime correction was conducted to adjust for time differences due to multislice imaging acquisi tion; all volumes were aligned to the first volume, and non linear warping was performed to an echoplanar imaging template. Images were then smoothed with a 5 mm full width at halfmaximum Gaussian kernel.
regions of interest (ROI) were extracted using the MarsBaR toolbox (http://marsbar .sourceforge.net) from the anticipation high gain versus no gain contrast as well as from the feedback high gain versus no gain contrast. The extracted ROIs were based on the study by O’Doherty and colleagues21 (MNI co
ordinates: x, y, z = ±15, –9, 9; radius = 9 mm).
Establishment of linkage disequilibrium structures
We used Haploview 4.2 software to define the haplotype blocks of the EHD4 gene.22 We selected the haplotype block 3
for further analyses, where the candidate single nucleotide polymorphism (SNP) rs1648821 is located and the minimum pairwise linkage disequilibrium (LD), measured as D’, is higher than 0.99. We used Plink software to generate the hap lotype phases for each individual and performed the associa tion analyses.23
Kernel-based association measure
We used the kernel generalized variance24 to quantify the de
pendence between the EHD4 SNPs and both binge drinking behaviour and fMRI BOLD response in the IMAGEN sample. Statistical inference was based on a permutation procedure where both a parametric approximation of the p value and an empirical p value were calculated; we report the latter in this article. For more details on the kernelbased association meas ure, refer to Appendix 1 and the study by Bach and Jordan.25
Results
Construction of a gene coexpression network
We began by constructing a coexpression network based on NAcc transcriptomic data derived from 9 male Rasgrf2–/– mice
and 9 male wildtype controls (total n = 18) by applying WGCNA.18 This analysis revealed 37 groups, or modules, of
genes that exhibited highly significant coexpression patterns from a total of 12 043 unique genes (Appendix 1, Fig. S1). The number of genes in a module varied widely from 39 to 3706.
Identification and characterization of coexpression modules
associated with KO status
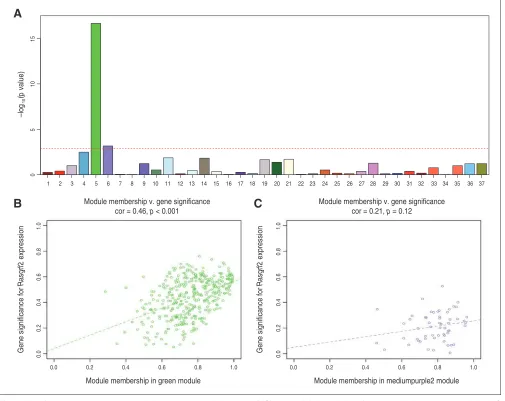
To determine whether any of the identified coexpression modules were associated with KO status (binomial trait), we correlated each module with KO status using Pearson r with module eigengenes (i.e., the first principal component of the standardized gene expression profile of each mod ule). After Bonferroni correction for 37 modules, we found that 2 modules, modules 5 (M5; puncorrected < 0.001, pcorrected <
0.001) and 6 (M6; puncorrected < 0.001, pcorrected = 0.025), were sig
nificantly correlated with KO status (Fig. 1A). In order to provide validation, we also correlated these 2 modules with
Rasgrf2 mRNA expression levels (quantitative trait). We
found a significant correlation with the M5 module (Fig. 1B), which comprises 367 highly interconnected genes, but not with the M6 module (Fig. 1C). Specifically, the M5 module eigengene in Rasgrf2-/- mice was reduced compared
with wildtype controls, indicating that the majority of the
genes in this module were downregulated in Rasgrf2-/- mice
(Appendix 1, Fig. S2). We therefore took the M5 module for ward for further characterization.
At the individual gene level, more than 96% of genes in M5 were differentially expressed significantly between Rasgrf2-/
-mice and wildtype controls, with positive correlations evi dent between numerous M5 genes and Rasgrf2 expression levels. The top 40 genes (ranked by module membership) and their correlation with Rasgrf2 expression levels (r > 0.50), differentially expressed genes significantly between Rasgrf2-/
-mice and wildtype controls (pFDR < 0.05), and the number of
connections (> 50) with other genes in the module are pre sented in Table 1. A complete list of genes comprising the M5 module can be found in Appendix 1, Table S1.
To begin to characterize the M5 module, we first per formed gene ontology (GO) term enrichment analysis. This revealed significant enrichment of M5 genes for protein phosphorylation and kinase activity, transferase and nucle ase activities and (cytoskeletal) protein binding in both the cytoplasm and nucleus (Appendix 1, Table S2). To determine whether the M5 module functions in a cellspecific manner, we tested whether M5 gene expression significantly overlaps with markers of the 4 major central nervous system (CNS) cell classes (astrocytes, microglia, neurons and oligodendro cytes). We found significant enrichment with neuronal marker genes (pcorr = 0.018; Appendix 1, Table S3), suggesting
that M5 module functioning is neuronspecific.
The M5 module is enriched with alcohol-related genes
in mice and humans
Because the M5 module was correlated with both KO status (binomial trait) and Rasgrf2 mRNA expression levels (quanti tative trait), we took this module forward to determine its rel evance for alcoholrelated phenotypes. We first set out to de termine to what extent M5 module genes overlap with previously identified quantitative trait loci (QTL) for alcohol preference in mice.26 We identified a total of 36 M5 genes lo
cated within these QTL, including Adamtsl2, Atm, Cryab,
Neo1, Pgm2 and Rasl12 (Appendix 1, Table S4), indicating that
the M5 module does contain genes already implicated in the regulation of alcohol preference.
We then shifted our focus to human alcoholrelated pheno types by investigating whether human orthologues to M5 mod ule genes are enriched with genetic association signals for binge drinking in a sample of 905 14yearold adolescent males from the IMAGEN project.15 We identified 250 human orthologues
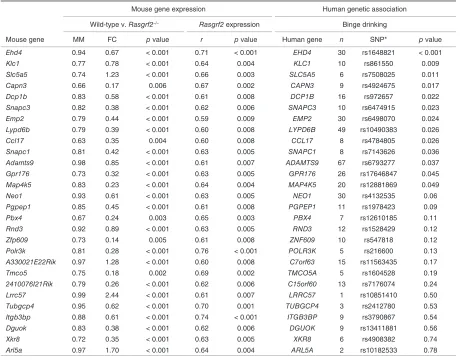
for M5 module genes, 216 of which contained SNPs covered by the Illumina HumanHap610 Genotyping BeadChip (see Table 1 for orthologues of the top 40 M5 genes). This set of 216 ortho logues was significantly enriched with genetic association sig nals for binge drinking GWAS data, even after correction for multiple testing (p = 0.01, pFDR = 0.02; Fig. 2A).
with Rasgrf2 mRNA expression (p < 0.01). Thus, of the initial set of 216 human genes, we highlighted 28 candidates for alcoholrelated phenotypes based on the apparent promi nence of their orthologues in the M5 module (Table 2).
EHD4 is associated with binge drinking and VS activation
during a reward task
The SNP showing the most highly significant association with binge drinking was rs1648821 (p < 0.001), which is lo cated in intron 3 of the EHdomain containing 4 (EHD4) gene (Fig. 2B and Appendix 1, Table S5). In order to further validate our overall findings, we decided to take EHD4 for ward for candidatebased analyses. First, we extended upon the single SNP association between rs1648821 and binge drinking by performing a haplotype analysis in the same sample of male adolescents.15 We selected haplotype block
3, which consists of rs1648821 and 5 other SNPs (Appendix 1, Fig. S3 and Table S5), to test for a kernelbased associa tion with binge drinking behaviour. This yielded a highly significant result (pempirical < 0.001; all empirical p values pre
sented in this study are based on 1000 permutations). We have previously shown that RASGRF2 appears to exert its effect on alcoholrelated phenotypes by altering mesolimbic dopamine function, resulting in a mitigation of the rewarding effects of alcohol.10 Thus, to determine whether EHD4 might
exert its effect on binge drinking through similar mechanisms, we examined whether there was an association between hap lotype block 3 in EHD4 and activation of the VS, which con tains the NAcc, during a reward task (i.e., the MID task). Our sample consisted of 608 14yearold boys from the IMAGEN baseline assessment with fMRI data, which was a subsample the study’s 905 participants.15 Whole brain contrast maps dur
[image:5.585.43.548.273.674.2]ing reward anticipation showed a widespread positive BOLD
Fig. 1: Identifying gene coexpression modules associated with knockout (KO) status. (A) Association of each module’s eigengene with the KO status. The Y axis indicates the –log10 of the association p value. The dotted red line represents the significance level at p < 0.001 after
Bonferroni correction. (B, C) Correlations between gene significance (i.e., correlation with Rasgrf2 gene expression levels) and module mem-bership for (B) M5 and (C) M6 modules. Colour-coding is equivalent to module names (green and medium purple).
0
51
0
10
15
A
B
C
0.0
0.2
0.4
0.6
0.8
1.0
0.0
0.2
0.4
0.6
0.8
1.0
5 4 3 2
1 10 11 12 13 14 15 16 18
0.0 0.2 0.4 0.6 0.8 1.0
19 20 21 22 23 24 25 26 27 28 29 30 31 32 33 34 35 36 37 17
9 8 7 6
0.0
Module membership in green module Module membership in mediumpurple2 module
Module membership v. gene significance cor = 0.46, p < 0.001
Module membership v. gene significance cor = 0.21, p = 0.12
0.2 0.4 0.6 0.8 1.0
Gene significance for
Rasgrf2
expression
–log
(p
value)
Gene significance for
Rasgrf2
response, with highest activation in subcortical regions, includ ing the VS, extending into the insula, prefrontal cortex and the parietal cortex (Fig. 3A). Reward feedback induced significant positive BOLD responses predominantly in the cingulate gyrus, the prefrontal cortex and the parietal cortex (Fig. 3B). In the anticipation phase, we found a significant association be tween haplotype block 3 in EHD4 and the right (pempirical < 0.001)
but not the left VS (pempirical = 0.41; Appendix 1, Table S6). There
was no significant association between haplotype block 3 and VS activity upon reward feedback (data not shown).
Evidence of a
cis-acting haplotypic effect on EHD4 mRNA
expression
Considering rs1648821 and the other 5 SNPs constituting hap lotype block 3 are all intronic and do not tag (r2 > 0.8) any
[image:6.585.80.508.224.685.2]coding SNPs, we set out to test whether this haplotype influ enced EHD4 mRNA expression levels. EHD4 expression data from peripheral blood were available from a subsample of ado lescent boys (n = 190) from the IMAGEN project. By applying a kernelbased association test, we found an association between
Table 1: Top 40 M5 module genes ranked by module membership. Differential gene expression between wild-type and
Rasgrf2–/– mice and module membership statistics, as well as human orthologues, are also included.
Rank Mouse gene symbol
Differential expression Module membership
Human gene symbol
logFC t p value MM p value kWithin
1 Glrx1 3 38.27 < 0.001 0.99 < 0.001 76.61 —
2 LOC666403 4.48 59.71 < 0.001 0.99 < 0.001 76.23 —
3 1200015F23Rik 2.15 42.63 < 0.001 0.99 < 0.001 75.97 —
4 Tmem87a –2.38 –42.17 < 0.001 –0.99 < 0.001 75.47 TMEM87A
5 Lrrc57 2.44 34.6 < 0.001 0.99 < 0.001 75.23 LRRC57
6 Ccndbp1 1.43 24.13 < 0.001 0.99 < 0.001 73.6 CCNDBP1
7 9930021D14Rik 1.31 22.86 < 0.001 0.99 < 0.001 72.98 —
8 Slc25a18 2.25 23.78 < 0.001 0.98 < 0.001 72.8 SLC25A18
9 2810410P22Rik 1.84 19.75 < 0.001 0.98 < 0.001 71.23 —
10 Pla2g4b 0.43 11.35 < 0.001 0.98 < 0.001 70.12 PLA2G4B
11 Gfer 0.66 14.77 < 0.001 0.98 < 0.001 68.74 GFER
12 Cops8 –2.91 –21.1 < 0.001 –0.98 < 0.001 67.93 COPS8
13 Adamts9 0.85 15.38 < 0.001 0.98 < 0.001 67.84 ADAMTS9
14 Eme2 –1.74 –20.75 < 0.001 –0.98 < 0.001 68 EME2
15 C920004C08Rik –0.98 –16.06 < 0.001 –0.98 < 0.001 66.72 —
16 Slc39a9 0.65 12.83 < 0.001 0.97 < 0.001 66.17 SLC39A9
17 Arrdc3 2.07 16.82 < 0.001 0.97 < 0.001 68.47 ARRDC3
18 2810423A18Rik 1.51 17.65 < 0.001 0.97 < 0.001 68.02 —
19 Mad 1.21 17.31 < 0.001 0.97 < 0.001 68.05 —
20 A330021E22Rik 1.28 16.43 < 0.001 0.97 < 0.001 64.42 C7orf63
21 Arl5a 1.7 16.24 < 0.001 0.97 < 0.001 66.31 ARL5A
22 LOC229810 –1.64 –18.56 < 0.001 –0.97 < 0.001 68.29 —
23 Zap3-pending 0.58 13.07 < 0.001 0.97 < 0.001 65.62 —
24 Clstn1 –1.51 –18.54 < 0.001 –0.97 < 0.001 66.34 CLSTN1
26 Vrk1 0.85 –13.51 < 0.001 0.96 < 0.001 62.83 VRK1
27 2310002B06Rik –0.6 –12.66 < 0.001 –0.96 < 0.001 61.92 —
28 Polr3f –0.38 –9.54 < 0.001 –0.96 < 0.001 61.86 POLR3F
29 Gpr19 0.81 11.99 < 0.001 0.96 < 0.001 62.33 GPR19
30 Mid1 1.61 17.27 < 0.001 0.96 < 0.001 62.82 MID1
31 A630064P09Rik –0.46 –10.17 < 0.001 –0.96 < 0.001 59.67 —
32 Ccl27 –1.79 –15.52 < 0.001 –0.96 < 0.001 60.68 —
33 8430432M10Rik 0.67 11.92 < 0.001 0.95 < 0.001 59.82 —
34 Ndufb10 1.09 15.91 < 0.001 0.95 < 0.001 59.86 NDUFB10
35 Ube2i –1.04 –12.22 < 0.001 –0.95 < 0.001 56.05 UBE2I
36 Tubgcp4 0.62 10.28 < 0.001 0.95 < 0.001 55.84 TUBGCP4
37 Bub1b 0.36 8.56 < 0.001 0.94 < 0.001 53.49 BUB1B
38 Ehd4 0.67 9.79 < 0.001 0.94 < 0.001 54.66 EHD4
39 Rps2 –0.51 –10.47 < 0.001 –0.94 < 0.001 53.67 RPS2
40 Arhgap12 1.12 11.84 < 0.001 0.94 < 0.001 53.33 ARHGAP12
logFC = fold change on log2 scale between wild-type and Rasgrf2–/–; MM = module membership; kWithin = number of connections between a gene and
Fig. 2: Manhattan and regional association plot for the M5 (green) module associations with male adolescent binge drinking from the IMAGEN study sample. (A) Genome-wide association study signals for binge drinking in male adolescents. The single-nucleotide polymorphism (SNP) with the lowest –log(p) located within 100 kb either upstream or downstream was used to present each gene. In total 372 813 variants were used and 16 449 genes were mapped for enrichment analysis. (B) Regional association of the EHD4 gene locus for binge drinking in male adolescents. Association p values (–log10 scale, Y axis) of variants are shown according to their chromosomal positions (X axis). Blue lines indicate the genetic recombination rate (cM/Mb).
0 20 40 60 80 100
B
A
10
–log
(p
value)
5 4 3 2
1 10 11 12 13 14 15 16 18 19 20 21 22 X Y
0
10 r2
8
0.8
rs1648821
0.6 0.4 0.2 6
4
2
0
42 42.1 42.2 42.3 42.4
2.5 5 7.5 10
Chromosomal location
Plotted SNPs
17 9
8 7 6
–log(
p value)/statistics/odds ratio
Manhattan plot for gene set green module
Pathway/gene set name: green module Pathway/gene set name: p value: 0.01 Pathway/gene set name: FDR: 0.02
MGA MAPKBP1 SPTBN5 EHD4 PLA2G4E PLA2G4D PLA2G4F
VPS39 JMJD7
JMJD7–PLA2G4B
PLA2G4B
MIR4310
Position on chr15 (Mb)
haplotype block 3 and EHD4 mRNA expression (pempirical <
0.001), indicating this haplotype exerts a cisacting effect.
Discussion
Previous characterization of male Rasgrf2–/– mice revealed sig nifi
cant reductions in ethanol intake and preference relative to wild type controls as well as altered mesolimbic dopamine neur on ac tivity and dopamine release in the NAcc.10 In the present study
we therefore applied a systems biology approach to elucidate the downstream consequences of altered mesolimbic dopamine signalling in the NAcc of this same mouse model. We con structed a coexpression network using transcriptomewide data derived from the NAcc of male Rasgr2–/–mice and wildtype con
trols, which revealed 37 distinct modules of functionally related genes. One of these modules, M5 green, was significantly associ ated with both Rasgrf2 KO status (binomial trait) and Rasgrf2 mRNA expression levels (quantitative trait), thereby highlight ing this module as a putative central regulator of mesolimbic do pamine signalling and reinforcement mechanisms in the NAcc.
Initial characterization of this module by GO term enrichment analysis indicated that this module plays a role in the regulation of protein phosphorylation and kinase activity, which is in keep ing with the known function of Rasgrf2 as a guanine nucleotide releasing factor and activator of MAP kin ase signalling path ways.11,24,27 We also found significant coexpression of our M5
module genes with neuronal marker genes indicating that the functioning of this module is largely neuronspecific. Again, this is in accordance with previous research showing that Rasgrf2 ex pression in the CNS is localized to neurons only, not glia.11,24
This apparent neuron specific expression of M5 module genes is potentially interesting considering the relatively homogeneous neuronal makeup of the NAcc, whereby approximately 90% of these neurons belong to the class of mediumsized spiny neur ons (MSNs).6 They are known to play a critical role in the regu
lation of alcohol reinforcement by functioning as integrators of dopaminergic and glutamatergic signals,28 so a neuron specific
[image:8.585.63.523.331.691.2]role for the M5 module in the NAcc is highly suggestive of an important role for this module in alcohol reinforcement mech anisms. Further research to determine whether M5 module
Table 2: Summary of mouse genes in the M5 module with high module membership and gene significance (correlated with Rasgrf2 expression levels) and their corresponding genetic association with binge drinking in humans.
Mouse gene expression Human genetic association
Wild-type v. Rasgrf2–/– Rasgrf2 expression Binge drinking
Mouse gene MM FC p value r p value Human gene n SNP* p value
Ehd4 0.94 0.67 < 0.001 0.71 < 0.001 EHD4 30 rs1648821 < 0.001
Klc1 0.77 0.78 < 0.001 0.64 0.004 KLC1 10 rs861550 0.009
Slc5a5 0.74 1.23 < 0.001 0.66 0.003 SLC5A5 6 rs7508025 0.011
Capn3 0.66 0.17 0.006 0.67 0.002 CAPN3 9 rs4924675 0.017
Dcp1b 0.83 0.58 < 0.001 0.61 0.008 DCP1B 16 rs972657 0.022
Snapc3 0.82 0.38 < 0.001 0.62 0.006 SNAPC3 10 rs6474915 0.023
Emp2 0.79 0.44 < 0.001 0.59 0.009 EMP2 30 rs6498070 0.024
Lypd6b 0.79 0.39 < 0.001 0.60 0.008 LYPD6B 49 rs10490383 0.026
Ccl17 0.63 0.35 0.004 0.60 0.008 CCL17 8 rs4784805 0.026
Snapc1 0.81 0.42 < 0.001 0.63 0.005 SNAPC1 8 rs7143626 0.036
Adamts9 0.98 0.85 < 0.001 0.61 0.007 ADAMTS9 67 rs6793277 0.037
Gpr176 0.73 0.32 < 0.001 0.63 0.005 GPR176 26 rs17646847 0.045
Map4k5 0.83 0.23 < 0.001 0.64 0.004 MAP4K5 20 rs12881869 0.049
Neo1 0.93 0.61 < 0.001 0.63 0.005 NEO1 30 rs4132535 0.06
Pgpep1 0.85 0.45 < 0.001 0.61 0.008 PGPEP1 11 rs1978423 0.09
Pbx4 0.67 0.24 0.003 0.65 0.003 PBX4 7 rs12610185 0.11
Rnd3 0.92 0.89 < 0.001 0.63 0.005 RND3 12 rs1528429 0.12
Zfp609 0.73 0.14 0.005 0.61 0.008 ZNF609 10 rs547818 0.12
Polr3k 0.81 0.28 < 0.001 0.76 < 0.001 POLR3K 5 rs216600 0.13
A330021E22Rik 0.97 1.28 < 0.001 0.60 0.008 C7orf63 15 rs11563435 0.17
Tmco5 0.75 0.18 0.002 0.69 0.002 TMCO5A 5 rs1604528 0.19
2410076I21Rik 0.79 0.26 < 0.001 0.62 0.006 C15orf60 13 rs7176074 0.24
Lrrc57 0.99 2.44 < 0.001 0.61 0.007 LRRC57 1 rs10851410 0.50
Tubgcp4 0.95 0.62 < 0.001 0.70 0.001 TUBGCP4 3 rs2412780 0.53
Itgb3bp 0.88 0.61 < 0.001 0.74 < 0.001 ITGB3BP 9 rs3790867 0.54
Dguok 0.83 0.38 < 0.001 0.62 0.006 DGUOK 9 rs13411881 0.56
Xkr8 0.72 0.35 < 0.001 0.63 0.005 XKR8 6 rs4908382 0.74
Arl5a 0.97 1.70 < 0.001 0.64 0.004 ARL5A 2 rs10182533 0.78
FC = fold change on log2 scale between wild-type and Rasgrf2–/– mice; MM = module membership; SNP = single-nucleotide polymorphism.
genes influence the activity of the DARPP32 pathway, a major regulator of synaptic plasticity in response to alcohol in MSNs, may prove informative in the elucidation of this role.28
Additional characterization of the M5 module revealed an enrichment of genes residing within previously identified QTL for alcohol preference in a recombinant mouse strain.26 Further
more, we also found an enrichment of GWAS signals for binge drinking originating from M5 orthologous human genes in a human sample consisting of adolescent boys, indicating that this module, initially identified in mice, is indeed translatable to humans. After filtering these human orthologues to identify those genes representing central regulators of the M5 module (i.e., high module membership and a highly significant correla tion with Rasgrf2 mRNA expression), we highlighted 28 genes that represent highly convin cing candidates for a role in the regulation of reinforcement mechanisms in MSNs.
A literature search revealed that several of these 28 candi dates have previously been implicated in alcohol and addictionrelated phenotypes, thereby providing proof of prin ciple. For example, Snapc3 was identified as a candidate in volved in ethanol consumption and withdrawal in a recent QTL study using a recombinant panel of BxD mice.29 Snapc3 encodes
a component of the small nuclear RNA (snRNA) activating
complex required for the transcription of both RNA polymerase II and III snRNA genes.30 Interestingly, our list of 28 genes also
contains Snapc1, which encodes another component of this com plex potentially highlighting snRNA as an important class of molecules in the regulation of reinforcement. In addition, Rnd3, which encodes the GTPase RhoE, has previously been impli cated in an astroglial inflammatory response to ethanol admin istration,31 whereas another gene, Klc1, has been implicated in
morphineinduced conditioned place preference in mice.32 Inter
estingly, Klc1 encodes kinesin chain light 1, a component of kinesin motor proteins responsible for intracellular molecule trafficking,33 which in the context of reinforcement may play a
role in the transport of proteins regulating synaptic plasticity. Our list of 28 genes also includes numerous novel candidates that warrant further validation and characterization. Indeed, the most highly significant association with binge drinking from this list originated from the EHD4 gene, which encodes the etshomology (EH) domain containing 4 protein,34 whereby
[image:9.585.60.529.333.666.2]the minor T allele of rs1648821 was associated with a higher fre quency of binge drinking. Extended characterization of this sin gle SNP association in our sample of adolescent boys revealed a 6marker haplotype featuring rs1648821, which not only ap pears to influence peripheral mRNA expression levels of
Fig. 3: Whole brain analysis of reward anticipation and reward feedback in male adolescents from the IMAGEN study sample. Posi-tive blood oxygen level–dependent response during (A) reward anticipation and (B) reward feedback (family-wise error–corrected
EHD4, but also exhibits a highly significant association with binge drinking. In addition, this haplotype was also associated with altered ventral striatal activity during the reward anticipa tion phase of the MID task, indicating that EHD4 may influence binge drinking by regulating reward and reinforcement mech anisms in the NAcc. This is concordant with the earlier pro posed idea that M5 module genes identified in mice may influ ence alcohol related phenotypes by altering reinforcement mechanisms in MSNs of the NAcc.
The primary function of EHD4 is in the regulation of endo cytosis, a process by which a small portion of plasma mem brane, including receptors or receptorligand complexes, be comes internalized into the cell and packaged into early endosomes for either degradation or recycling.35 A well
characterized member of the EH domaincontaining family of genes, EHD1, has been shown to regulate the recycling of AMPA receptor subunits to the plasma membrane during NMDA receptor–dependent LTP,35,36 a process known to be
vital in the promotion of synaptic plasticity underlying alco hol reinforcement in the NAcc.37 Considering the high levels
of homology between EHD1 and EHD4, as well as the ten dency of their encoded proteins to form functional heterodi mers,34,38 EHD4 may be involved in alcohol reinforcement
mechanisms through the regulation of synaptic plasticity.
Limitations
The major potential limitation of the present study relates to the difficulty in determining the extent to which the M5 mod ule was dysregulated in Rasgrf2–/–mice by perturbed mesolim
bic dopamine signalling or by the loss of Rasgrf2 function in the NAcc. However, our followup validation studies investi gating genetic associations between M5 module orthologues and binge drinking in male adolescents support a role for this module in the regulation of alcoholrelated phenotypes, which suggests that the M5 module dysregulation observed in mutant mice was most likely a result of altered mesolimbic dopamine functioning. Furthermore, it should be noted that the findings from our coexpression network analyses in mice are merely correlational, so the cause–effect relationship be tween the M5 module and alcoholrelated phenotypes cannot be determined on the basis of these data alone. However, given that this module is significantly enriched with GWAS signals for binge drinking episodes in a sample of adolescent males, this implies the M5 module — or at least certain com ponents of it — may regulate binge drinking in humans.
Conclusion
By means of a translational systems approach using gene ex pression data from the NAcc of Rasgrf2–/–mice, we have identi
fied a module of coexpressed genes whose human orthologues are significantly enriched with GWAS signals for frequency of binge drinking in adolescent boys. We propose that these genes represent novel candidates for a role in the regulation of binge drinking and other alcoholrelated phenotypes, and we have highlighted EHD4 as a particularly prominent candidate. Overall, our findings support both the validity and necessity of
functional characterization of GWAS signals using animal models, as well as the translational benefits of applying sys tems biology approaches to these models as a means to gener ate additional candidate genes in humans. Considering that binge drinking and excessive alcohol use during adolescence are major contributors toward the development of alcohol abuse in later life, EHD4 and its associated M5 module genes may have predictive value with the potential to inform future preventative meas ures for alcohol problems in later life.
Acknowledgements: This work was supported by the European
Unionfunded FP6 Integrated Project IMAGEN (reinforcement related behaviour in normal brain function and psychopathology) (LSHMCT 2007037286), the FP7 projects IMAGEMEND, MATRICS and the In novative Medicine Initiative Project EUAIMS (1153002), as well as the Medical Research Council Programme grant “Developmental pathways into adolescent substance abuse” (93558). Further support was provided by the Swedish Funding Agency FORMAS, the German Bundesministerium für Bildung und Forschung (NGFN Plus; FKZ: 01GS08152 and eMED „Alcoholism“) and the Deutsche Forschungsge meinschaft (DFG): ReinhartKoselleck Award SP 383/51, European Research Council and FP7 SynSys (to JAG) and Ecole des Neurosci ences de ParisIle de France (ENP) and City of Paris (to MM), Grants PS09/01979 and RD06/0020/0000 from MINECO, Spain (to ES).
Affiliations: From the Discipline of Psychiatry, University of Adelaide,
(Smolka); and the Deptartment of Psychopharmacology, Central Institute of Mental Health, Faculty of Clinical Medicine Mannheim, University of Heidelberg, Germany (Sommer, Spanagel).
Competing interests: T. Jia has received grants from the European
Union, MRC and Formas. T. Banaschewski has served in an advisory or consultancy role for Actelion, Hexal Pharma, Lilly, Medice, Oxford Out comes, PCM Scientific, Novartis, Shire and Viforpharma; has received speaker fees from Medice, Novartis and Shire; and has been involved in clinical trials conducted by Shire and Viforpharma, all outside the sub mitted work. G. Barker has received teaching honoraria from General Electric Healthcare and consulting fees from IXICO. A. Bokde has re ceived an SFI Stokes Lectureship grant from Science Foundation Ireland. K. Mann declares a grant from the European Union. M. Rietschel has re ceived funding from the DFG, the BMBF and the European Union; as well as an honorarium from Novartis for participation on the German Alzheimer Prevention Initiative Advisory Board.
Contributors: D. Stacey, G. Barker, C. Buchel, A. Fernández
Medarde, J. Gallinat, H. Garavan, A. Heinz, B. Ittermann, K. Mann, T. Paus, Z. Pausova, E. Santos and G. Schumann designed the study. D. Stacey, B. Ruggeri, M. Maroteaux, A. Cattrell, C. Nymberg, T. Banaschewski, S. Bhattacharyya, H. Band, A. Bokoe, F. Carvalho, S. Desrivières, A. Easton, M. FauthBühler, H. Flor, J. Gallinat, H. Garavan, A. Heinz, B. Ittermann, G. Lathrop, C. Lawrence, E. Loth, J.L. Martinot, F. Nees, T. Paus, M. Rietschel, A. Rotter Neubert, M. Smolka, C. Mueller and G. Schumann acquired the data, which D. Stacey, A. Lourdusamy, T. Jia, C. Nymberg, P. Conrod, V. Frouin, M. Rietschel, W. Sommer, M. Mameli, R. Spanagel, J.A. Girault and G. Schumann analyzed. D. Stacey, A. Lourdusamy, T. Jia, P. Conrod, K. Mann, T. Paus and G. Schumann wrote the arti cle, which all authors reviewed and approved for publication.
Members of the IMAGEN consortium: Gunter Schumann, Anna
Cattrell, Herta Flor, Frauke Nees, Tobias Banaschewski, Arun Bokde, Rob Whelan, Christian Buechel, Uli Bromberg, Patricia Conrod, Vincent Frouin, Dimitri Papadoulos, Juergen Gallinat, Hugh Garavan, Andreas Heinz, Henrik Walter, Bernd Ittermann, Penny Gowland, Tomáš Paus, Luise Poustka, JeanLuc Martinot, Herve Lemaitre, Eric Artiges, or MarieLaure Paillère Martinot, Michael N. Smolka, Eva Mennigen, Nora C. Vetter and Sarah Rodehacke.
References
1. Courtney KE, Polich J. Binge drinking in young adults: data, defi nitions, and determinants. Psychol Bull 2009;135:14256.
2. Blomeyer D, Treutlein J, Esser G, et al. Interaction between CRHR1 gene and stressful life events predicts adolescent heavy alcohol use. Biol Psychiatry 2008;63:14651.
3. Chassin L, Pitts S, Prost J. Binge drinking trajectories from adoles cence to emerging adulthood in a highrisk sample: predictors and substance abuse outcomes. J Consult Clin Psychol 2002;70:6778. 4. Dawson DA, Goldstein R, Chou S, et al. Age at first drink and the
first incidence of adultonset DSMIV alcohol use disorders. Alcohol Clin Exp Res 2008;32:214960.
5. Chou SP, Pickering R. Early onset of drinking as a risk factor for lifetime alcoholrelated problems. Br J Addict 1992;87:1199204. 6. Spanagel R. Alcoholism: a systems approach from molecular physi
ology to addictive behavior. Physiol Rev 2009;89:649705.
7. Baik I, Cho NH, Kim SH, et al. Genomewide association studies identify genetic loci related to alcohol consumption in Korean men. Am J Clin Nutr 2011;93:80916.
8. Heath AC, Whitfield JB, Martin NG, et al. A quantitativetrait genomewide association study of alcoholism risk in the com munity: findings and implications. Biol Psychiatry 2011;70:5138. 9. Schumann G, Coin LJ, Lourdusamy A, et al. Genomewide associ
ation and genetic functional studies identify autism susceptibility candidate 2 gene (AUTS2) in the regulation of alcohol consump tion. Proc Natl Acad Sci U S A 2011;108:711924.
10. Stacey D, Bilbao A, Maroteaux M, et al. RASGRF2 regulates alcoholinduced reinforcement by in fl uencing mesolimbic dopa mine neuron activity and dopamine release. Proc Natl Acad Sci U S
A 2012;109:2112833.
11. FernándezMedarde A, Esteban LM, Nunez A, et al. Targeted dis ruption of RasGrf2 shows its dispensability for mouse growth and development. Mol Cell Biol 2002;22:2498504.
12. Tian X, Gotoh T, Tsuji K, et al. Developmentally regulated role for RasGRFs in coupling NMDA glutamate receptors to Ras, Erk and CREB. EMBO J 2004;23:156775.
13. Tian X, Feig LA. Agedependent participation of RasGRF proteins in coupling calciumpermeable AMPA glutamate receptors to Ras/ Erk signaling in cortical neurons. J Biol Chem 2006;281:757882. 14. Li S, Tian X, Hartley DM, et al. Distinct roles for Rasguanine
nucleotidereleasing factor 1 (RasGRF1) and RasGRF2 in the induc tion of longterm potentiation and longterm depression. J Neurosci 2006; 26:17219.
15. Schumann G, Loth E, Banaschewski T, et al. The IMAGEN study: reinforcementrelated behaviour in normal brain function and psy chopathology. Mol Psychiatry 2010;15:112839.
16. Hibell B, Ahlstrom S, Balakireva O, et al. The 2007 ESPAD report: substance use among students in 35 European countries. Stockholm: Modintryckoffset AB; 2009.
17. Du P, Kibbe WA, Lin SM. Lumi: a pipeline for processing Illumina microarray. Bioinformatics 2008;24:15478.
18. Zhang B, Horvath S. A general framework for weighted gene co expression network analysis. Stat Appl Genet Mol Biol 2005;4:e17. 19. Langfelder P, Horvath S. WGCNA: an R package for weighted
correlation network analysis. BMC Bioinformatics 2008;9:559. 20. Kang HM, Sul JH, Service SK, et al. Variance component model to
account for sample structure in genomewide association studies.
Nat Genet 2010;42:34854.
21. O’Doherty J, Dayan P, Schultz J, et al. Dissociable Roles of Ventral and Dorsal Striatum in Instrumental Conditioning. Science 2003;247:14. 22. Barrett JC, Fry B, Maller J, et al. Haploview: analysis and visualiza
tion of LD and haplotype maps. Bioinformatics 2005;21:2635. 23. Purcell S, Neale B, ToddBrown K, et al. PLINK: a tool set for
wholegenome association and populationbased linkage analyses.
Am J Hum Genet 2007;81:55975.
24. Zippel R, Gnesutta N, MatusLeibovitch N, et al. RasGRF, the ac tivator of Ras, is expressed preferentially in mature neurons of the central nervous system. Brain Res Mol Brain Res 1997;48:1404. 25. Bach FR, Jordan MI. Kernel independent component analysis. J
Mach Learn Res 2003;3:148.
26. Belknap JK, Atkins A. The replicability of QTLs for murine alcohol preference drinking behavior across eight independent studies.
Mamm Genome 2001;12:8939.
27. Fasano S, Brambilla R. RasERK signaling in behavior: old ques tions and new perspectives. Front Behav Neurosci 2011;5:79. 28. Girault JA. Signaling in striatal neurons: the phosphoproteins of re
ward, addiction, and dyskinesia. Prog Mol Biol Transl Sci 2012;106:3362. 29. Metten P, Iancu OD, Spence SE, et al. Dualtrait selection for etha nol consumption and withdrawal: genetic and transcriptional net work effects. Alcohol Clin Exp Res 2014;38:291524.
30. Ma B, Hernandez N. A map of proteinprotein contacts within the small nuclear RNAactivating protein complex SNAPc. J Biol Chem 2001;276:502735.
31. Guasch RM, Blanco AM, PérezAragó A, et al. RhoE participates in the stimulation of the inflammatory response induced by ethanol in astrocytes. Exp Cell Res 2007;313:377988.
32. Bilecki W, WawrzczakBargiela A, Przewłocki R. Regulation of kin esin light chain 1 level correlates with the development of morphine reward in the mouse brain. Eur J Neurosci 2009;30:110110.
33. Verhey KJ, Hammond JW. Traffic control: regulation of kinesin motors. Nat Rev Mol Cell Biol 2009;10:76577.
34. Yap CCC, Lasiecka ZM, Caplan S, et al. Alterations of EHD1/ EHD4 protein levels interfere with L1/NgCAM endocytosis in neurons and disrupt axonal targeting. J Neurosci 2010;30:664657. 35. Sharma M, Naslavsky N, Caplan S. A role for EHD4 in the regula
tion of early endosomal transport. Traffic 2008;9:9951018. 36. Blume JJ, Halbach A, Behrendt D, et al. EHD proteins are associ
ated with tubular and vesicular compartments and interact with specific phospholipids. Exp Cell Res 2007;313:21931.
37. Girault JA, Valjent E, Caboche J, et al. ERK2: a logical AND gate crit ical for druginduced plasticity? Curr Opin Pharmacol 2007;7:7785. 38. George M, Ying G, Rainey MA, et al. Shared as well as distinct