136
Chapter 19
Modeling and Simulation of Solar PV Array Emulator Utilizing Buck Converter
with Adaptive Control Base on Neural Network
A.S. Samosir1,a, N.H. Sodikin1, E. Komalasari1, A. Trisanto1 1
Department of Electrical Engineering, University of Lampung, Bandar Lampung, Indonesia a
Abstract. This paper presents the modeling and simulation of Solar Array Emulator utilizing Buck Converter with Neural Network Adaptive control. The simulation activity carried out using MATLAB/Simulink software. The Solar Array emulator is realized by controlling buck converter using Adaptive control base on Neural Network Controller with reference from Solar Array model. The Solar Array model was derived from the characteristic equation Solar Cell. The characteristics of Solar Array Emulator model was tested by varying the value of load and considering the effect of irradiance variation. The output characteristics of Solar Array Emulator model is verified by comparing to the characteristics of the actual PV module. The Sunmodule SW50 poly RMA from SolarWord is chosen as a reference for this simulation. The proposed Solar Array Emulator was found to be valid and accurate for any irradiance variations.
Keywords: Solar Array Emulator; Buck Converter; Photovoltaic; Matlab; Simulink.
I. Introduction
The increasing of world demand for energy resources is a crucial challenge that makes renewable energy sources has gained importance. One of the most promising renewable energy sources is solar photovoltaic [1]. It can produce direct current electricity when exposed to direct sunlight. Solar photovoltaic are solid state devices that convert the energy of sunlight directly into electrical energy. Solar photovoltaic have several advantages such as pollution-free, low maintenance costs and low operating costs. Their sources of energy, which is derived from solar energy, are also widely available and it is free.
Photovoltaic technology is a technology for generating electrical power by converting solar radiation into direct current electricity using semiconductors who have photovoltaic effect. The main component of a PV system is the solar cell, which functions to convert solar energy into direct current electrical energy.
In application, several solar cells connected in series and parallel to form a solar module, and several solar modules can be connected in series or parallel to form a Solar Array in order to increase the output power of a solar panel system. When exposed to sunlight, the solar panels will generate the direct current electricity, which is ready to supply power to the load. Because of its energy conversion systems using Photovoltaic technology, the power plant of this type is also called Solar Photovoltaic Power Plant.
137
Many factors that affect the performance of the Solar PV Array system should be investigated. Therefore, Solar Array Emulator is needed to find out how much these factors affect the performance of the solar photovoltaic system.In this paper, a modeling and simulation of Solar Array Emulator utilizing Buck Converter under MATLAB-Simulink software is carry out. The Solar Array emulator is realized by controlling buck converter using Adaptive control base on Neural Network Controller. The characteristics of Photovoltaic Emulator model was tested by varying the value of load and considering the effect of irradiance variation. The output characteristics of Solar Array Emulator model is verified by comparing to the characteristics of the actual PV module SolarWord SW50.
II. Solar PV Array Model
In application Solar cell transform solar radiation into DC current to generate electric power based on the principle of photovoltaic effect in semiconductor materials.
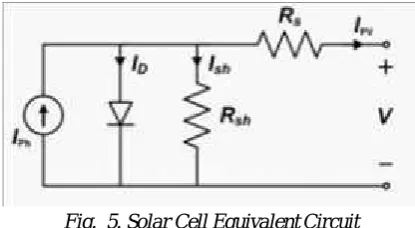
[image:2.595.199.407.329.443.2]The most common model used to predict energy production in photovoltaic cell modeling is the single diode circuit model that represents the electrical behavior of the pn-junction is given in [5-6]. Fig. 1 shows the single diode circuit model of Solar cell.
Fig. 5. Solar Cell Equivalent Circuit
From the single diode equivalent circuit in Fig. 1, the equation for the output current is given by:
where
Ipv= output current (ampere) Iph= photocurrent (ampere) ID= diode current (ampere) Ish= shunt current (ampere)
The current through the diode follow the Shockley diode equation:
where
IO= reverse saturation current (ampere) n = diode ideality factor
138
By Ohm's law, the shunt resistor current is:where Rsh= shunt resistance (Ω), and the voltage across Rshis Vshequal to VD, and:
where
VD= voltage across diode and resistor Rsh (volt) Vpv= voltage across the output terminals (volt) Ipv= output current (ampere)
RS= series resistance (Ω)
[image:3.595.191.416.358.581.2]Substituting equation (2) and (3) into the first equation and using equation (4) produces the characteristic equation of a solar cell, which relates solar cell parameters to the output current and voltage [1-2]:
Table 1. Specification Of Solarworld SW50 Module [7]
Parameters Symbol Value
Maximum power Pm 50 W
Voltage at max power Vm 18.2 V
Current at max power Im 2.75 A
Open circuit voltage Voc 22.1 V
Short circuit current Isc 2.98 A
Number of Series Cells Ns 36
Number of Parallel Cells Np 1
Fig. 2. Simulink Model of the solar cell
The nonlinear and explicit equation given by Eq. (5) depends on solar irradiance, the cell temperature, and their reference values which are generally provided by manufacturers of PV modules for specified operating condition. As Standard Test Conditions the irradiance is 1000W/m2and the cell temperature is 25OC [1-7].
139
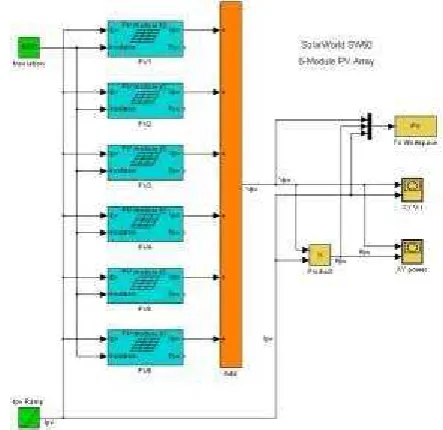
Conditions and has 36 series connected cells [7]. Fig. 2 shows the model of the Solar PV cell with input parameters irradiance and voltage. The contents of the block PV1-Module in Fig. 2 are shown in Fig. 3. [image:4.595.163.446.150.269.2]The Solar PV Array model was developed using MATLAB-Simulink software. The developed model of the Solar PV Array is shown as Fig. 4. Model of Solar PV Array consist of 6-module SolarWorld SW50 in series connection.
Fig. 3. Simulink Model of block PV1-Module in Fig. 2.
Fig. 4. Model of Solar PV Array consist of 6-module SolarWorld SW50 in series connection
III. Buck Converter For Solar PV Array Emulator
Buck Converter Power Circuit
The Buck converter is a type of step-down DC-DC converter. Output of the Buck converter is regulated according to the duty cycle of the PWM input at fixed frequency. The power circuit of a Buck converter is illustrated in Fig. 5, consists of DC source Vs, Power Switch Q, Diode, Inductor, Capacitor, and load Resistor [8-10].
In steady state operation, the average output voltage of the Buck Converter is
Vo = . Vs
[image:4.595.188.410.311.526.2]140
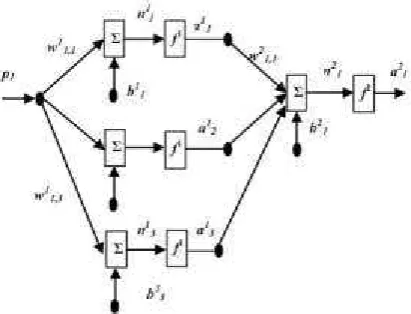
Neural Network Controller [image:5.595.195.409.134.213.2]In order to design the neural network controller, some information about the plant is needed. Usually the numbers of input and output neuron at each layer are equal to the number of input and output signals of the system respectively. The architecture of the proposed neural network control of a Buck converter adopted from [10] as shown in Fig. 6.
Fig. 5. Power circuit of a Buck Converter
Fig. 6. Architecture of the neural network controller [10].
The connections weight parameter between jth and ith neuron at mth layer is given by wth, while bias parameter of this layer at ith neuron is given by bim. Transfer function of the network at tth neuron in mth layer is defined as
The output function of neuron at mthlayer is given by aim = f m (nim )
where f is activation function of the neuron. In this design, the activation function for the output layer and the hidden layer are unity and a tangent hyperbolic function respectively.
The activation function of the hidden layer is given as
[image:5.595.202.408.248.405.2]141
where k is sampling time, a is learning rate, and F performance index function of the network.Fig. 7. Model of Solar PV Array Emulator utilizing Buck Converter
MODELLING OF SOLAR PV ARRAY EMULATOR UTILIZING BUCK CONVERTER
The model of the Solar PV Array Emulator using Buck Converter was developed using a MATLAB-Simulink model. The developed Solar PV Array consists of 6module SolarWorld SW50 in series connection.
A Simulink model of Buck Converter is carried out by using Power Electronic model of SimPower toolbox. The developed Buck converter model consists of DC source, power Mosfet, Diode, Inductor, Capacitor, and load Resistor. The buck converter is controlled by a Neural Network controller and PWM generator.
Finally, both of Buck Converter model and Solar PV Array model are combined to produce a solar PV Array Emulator. The developed solar PV Array Emulator model is shown in Fig. 7.
III. Result and Discussions
3.1 Solar PV Array Model output under number of modul variation
The performance of the Solar PV Array model is tested through simulation. In this simulation, Model of Solar PV Array from Fig. 4 is used. The output of the PV Array model is investigated when the number of modules that are connected in series changed from 1 to 6 modules. Fig. 8 to 10 depicts the performances curve of Solar PV Array model.
140
120
100
80
60
40
20
0
0 0.5 1 1.5 2 2.5 3 3.5
[image:6.595.197.410.563.703.2]142
350300
250
200
150
100
50
0
0 0.5 1 1.5 2 2.5 3 3.5
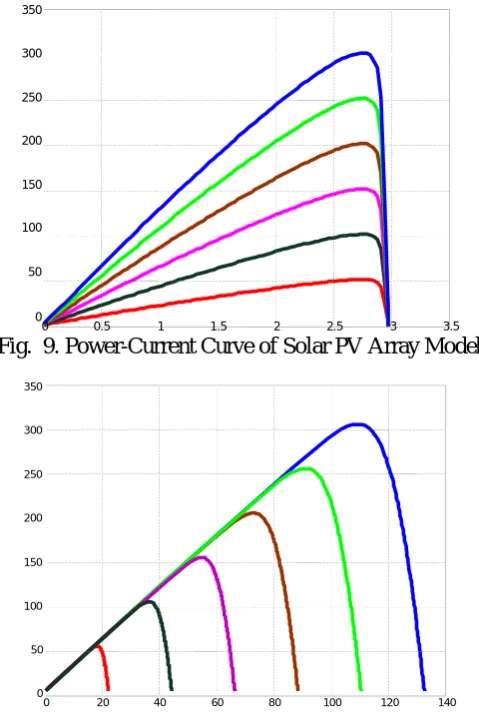
Fig. 9. Power-Current Curve of Solar PV Array Model
350
300
250
200
150
100
50
0
[image:7.595.184.424.46.405.2]0 20 40 60 80 100 120 140
Fig. 10. Power-Voltage Curve of Solar PV Array Model
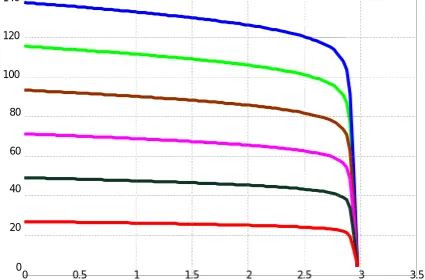
Fig. 8 shows the Voltage-Current curve of the Solar PV Array when the number of modules that are connected in series changed from 1 module to 6 modules. This Fig. shows that the output voltage of Solar PV Array is increase with the increase of module-number in series connection.
Fig. 9 shows the Power-Current curve of the Solar PV Array when the number of modules that are connected in series changed from 1 module to 6 modules. From this Fig. we know that the output Power of Solar PV Array and the maximum power point of the Solar PV Array are also increase with the increase of module-number in series connection.
The curve in Fig. 10 shows the relation of Power and Voltage of the Solar PV Array when the number of modules that are connected in series changed from 1 module to 6 modules.
3.2 Solar PV Array Emulator Performance
143
Table 2. Parameter Of Pv Array With 6-Module Of Solarworld Sw50 In Series ConnectionParameters Value
Maximum power 300.3 W
Voltage at max power 109.4 V
Current at max power 2.75 A
Open circuit voltage 132.6 V
Short circuit current 2.98 A
Number of Module in Series 6
Number of Module in Parallel 1
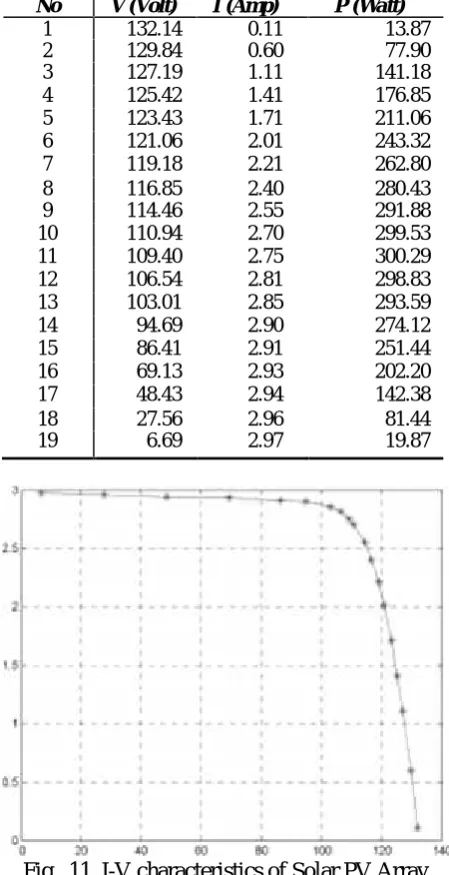
[image:8.595.191.414.261.715.2]In the simulation, Model of Solar PV Array Emulator utilizing Buck Converter from Fig. 7 is used. The output of the Solar PV Array Emulator is investigated. The performance of Solar PV Array Emulator model tested with variable load. The data simulation results are given in Table III.
Table 3. Data simulation results
No V (Volt) I (Amp) P (Watt)
1 132.14 0.11 13.87
2 129.84 0.60 77.90
3 127.19 1.11 141.18
4 125.42 1.41 176.85
5 123.43 1.71 211.06
6 121.06 2.01 243.32
7 119.18 2.21 262.80
8 116.85 2.40 280.43
9 114.46 2.55 291.88
10 110.94 2.70 299.53
11 109.40 2.75 300.29
12 106.54 2.81 298.83
13 103.01 2.85 293.59
14 94.69 2.90 274.12
15 86.41 2.91 251.44
16 69.13 2.93 202.20
17 48.43 2.94 142.38
18 27.56 2.96 81.44
[image:8.595.191.416.265.703.2]19 6.69 2.97 19.87
144
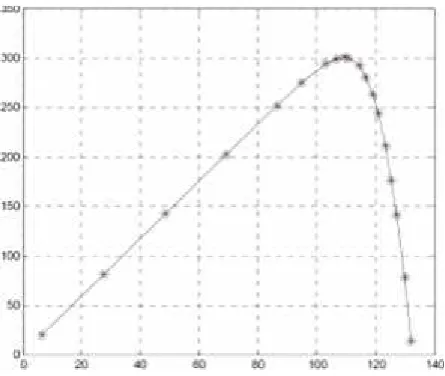
Fig. 12. P-V characteristics of Solar PV ArrayFrom data simulation, the obtained characteristic for the Solar PV Array Emulator utilizing Buck Converter is shown in Fig. 11 and 12. Fig. 11 shows the CurrentVoltage (I-V) characteristics and Fig. 12 shows the Power-Voltage (P-V) characteristics of the created PV Array Emulator models. With Irradiance 1000W/m2and Temperature 25OC, the Solar PV Array emulator produce the maximum power is 300.29 Watt with voltage at the maximum power of 109.40 V and current at the maximum power of 2,75 A at the value of 40 Ohm load.
For comparison, according the table II, at standard test conditions, PV array with 6-Module of SolarWord SW50 in series connection produces maximum power 300.3 Watt with voltage at maximum power of 109.4 V and current at the maximum power of 2.75 A. The data shows that the developed model of Solar PV Array Emulator is valid.
IV. Conclusions
A modeling and simulation of Solar PV Array Emulator Utilizing Buck Converter is presented. The performance of the Solar PV Array Emulator system has been investigated. The simulation results show the proposed Solar PV Array Emulator model has similar characteristics to the actual characteristics of 6-module SolarWorld SW50 in series connection. In the standard test conditions it was found that the proposed Solar PV Array Emulator produces the maximum power 300.29 Watt with voltage and current of 109.40V and 2.75A. For comparison, according the datasheet, at standard test conditions the Shell SP75 solar module produces the maximum power 300.3 Watt with voltage at the maximum power of 109.4 V and current of 2.75 A..
References
[1]. Ankur V. Rana,and Hiren H. Patel,“Current Controlled Buck Converter based Photovoltaic Emulator”,
Journal of Industrial and Intelligent Information Vol. 1, No. 2, June 2013.
145
[3]. M. Abdulkadir, A. S. Samosir and A. H. M. Yatim,“Modeling and Simulation of a Solar PhotovoltaicSystem, Its Dynamics and Transient Characteristics in LABVIEW”,ARPN Journal of Engineering and Applied Sciences. Vol. 3, No.2, Jun 2013.
[4]. F.Yusivar, M. Y. Farabi, R. Suryadiningrat, W. W. Ananduta, and Y. Syaifudin. “Buck-Converter Photovoltaic Emulator”, International Journal of Power Electronics and Drive System (IJPEDS), Vol.1, No.2, December 2011.
[5]. Pandiarajan, N, Ranganath Muthu. “Mathematical Modeling of Photovoltaic Module with Simulink”.
International Conference on Electrical Energy System, ICESS 2011.
[6]. R Khezzar, M Zereg, and A Khezzar, “Comparative Study of Mathematical Methods for Parameters Calculation of CurrentVoltage Characteristic of Photovoltaic Module”, International Conference on Electrical and Electronics Engineering, ELECO 2009.
[7]. Sunmodule SW 50 Poly RMA, Product Information Sheet SolarWord SW50 Photovoltaic Solar Modul. USA.
[8]. A. S. Samosir and A. H. M. Yatim, “Implementation of new control method based on dynamic evolution control for DC-DC power converter”, International Review of Electrical Engineering, Vol. 4, No. 1, 2009.
[9]. A. S. Samosir, T Sutikno and A. H. M. Yatim, “Dynamic evolution control for fuel cell DC-DC converter”,TELKOMNIKA journal, Vol. 9, no.1, 2011.
[10]. W.M.Utomo, Z.A. Haron, A. A. Bakar, M. Z. Ahmad and Taufik, “Voltage Tracking of a DC-DC Buck-Boost Converter
![Table 1. Specification Of Solarworld SW50 Module [7]](https://thumb-us.123doks.com/thumbv2/123dok_us/8801516.914230/3.595.191.416.358.581/table-specification-of-solarworld-sw-module.webp)