Weight based Classification Algorithm for Medical Data
J. S. Raikwal
Department of Information Technology Institute of Engineering & Technology
Devi Ahilya University Indore
Kanak Saxena
Department of Computer Application Samrat Ashok Technological Institute
India Vidisha, India
ABSTRACT
Machine learning concept has been incorporated by number of software and devices in the computer science and information industry. These software and devices are capable in decision making just like a human brain. This capability of decision making is govern by artificial intelligence techniques. These techniques follow many algorithms developed for decision making and machine learning. Decision making depends upon the profound training of contemporary data in a particular domain. Data plays a major and important part as one of the element in any machine learning algorithm. The main focus of this paper is on developing a machine learning algorithm that helps in training the available medical domain data to prepare a data model that negotiates with the query. This is achieved through the analysis of different machine learning methodologies like Support Vector Machines (SVM), Decision Trees and Recursive Partitioning (RP) algorithm and their model building processes. A new data mining and machine learning algorithm is proposed along with the performance analysis over the medical domain dataset. The analysis indicates that as the data size increases there is a continuous increase in algorithm accuracy but concurrently its time consumption also increases.
General Terms
Classification algorithmKeywords
SVM, decision tree, recursive, partitioning algorithm and performance evaluation
1.
INTRODUCTION
Data mining is the area in which predictive models are built by means of certain computational methods. These methods comprise the transformation of existing data in a particular domain into a comprehensible form for information extraction. It is also elaborated as the process of data selection and exploration for building data models from vast data stores for revealing unknown patterns.
Data mining find its applications in various fields like retail, banking, security, crime investigations, governance, e-politics etc. Now a days it is also gradually prevalent in medical and healthcare sector. There are number of reasons behind its popularity, for example increase in medical insurance fraud and abuse in health care stimulates the use of data mining techniques in this domain, and because of this many health care insurers accepted it to reduce losses and track convicts [2].
In medical domain, some of the features of available data are still undiscovered. It makes the domain uncertain. So a proficient system is required capable enough to provide unambiguous decisions for taking appropriate steps in medical surgery or treatments. Sometimes same properties with the same symptoms of diseases required different treatments.
Therefore accurate decisions and classification of data is required.
Data is one of the important element of any machine learning algorithm. In real life if a person is trained well then the decisions made by the person are suitable for near life. Therefore an unambiguous and correct data model is required for developing any data mining application [5]. In this paper medical data related to different ailments are considered. It also describes the suitable classifier that is used for classifying different behavioural characteristics and hidden data patterns using the weightage of the attributes. Logically sometimes in real world some attribute affects more than the other on an event frequently.
This paper focuses on the classification scheme, comparative study of algorithm processing and classification accuracy and resource consumed by the system. The next sections consist of the algorithm, dataset structure and algorithm execution in details, after that the implementation manual, experimental results and conclusion and future work are discussed.
2.
BACKGROUND
This section provides the different algorithms that are participating in proposed classifier development and comparative analysis.
SVM: SVM stands for Support Vector Machines. It is a supervised learning models that represents algorithms that performs data analysis, patter recognition, classification and regression analysis. It builds hyper plane or a set of hyper planes in a high or infinite dimensional space. SVM has already been adopted by various machine learning algorithms as a major functional unit [4].
Basic SVM receives a set of data as input. Performs prediction on received data sets. Creates two possible classes and gives those classes as output. This complete process of data set classification into two classes makes it non-probabilistic binary linear classifier. SVMs are built on the basis of maximum margin linear discriminates and have similarity with probabilistic approaches. In addition to this it does not consider the dependencies between the attributes.
Decision Tree (C 4.5): C4.5 creates decision trees using training data sets. Like ID3, it is also based on the information entropy concept. Training data set can be defined as a set S = S1, S2….. of already classified samples. Each sample Si
consists of a p-dimensional vector (X1,i, X2,i,….,Xp,i), where
the Xj represent attributes or features of the sample, as well as
the class in which Si falls.
C4.5 identifies an attribute of the data at each node. The chosen attribute most effectively splits set of samples into subsets. Splitting depends upon the normalized information gain known as entropy difference. A node with highest normalized information gain can be preferred as a decision making node. This process has been recursively applied to all subsets also. Following are the steps of C 4.5 algorithm:
INPUT: Data set D showed by discrete attributes.
OUTPUT: Decision tree T is created using dataset.
i) Create the node N;
ii) If instance is belong to the same class;
iii) Then return node N as leaf node and marked with CLASS C;
iv) IF attribute List is null, THEN
v) Return the node N as leaf node and signed with the most common CLASS;
vi) Select the attribute with highest information in the attribute list and signing the test attribute;
vii) Signing node N as test attribute;
viii) FOR the known value of each test attribute to divide the samples;
ix) Generating a new branch which is fit for test attribute = ai from node N;
x) Suppose that Ci is the set of test attribute = ai in the samples;
xi) IF Ci is null THEN
xii) Adding a leaf node and sign with the most common CLASS;
xiii) ELSE we will add a leaf node return by the Generate decision tree.
Recursive partitioning algorithm (RP): It creates a tree in which each node of the tree is linked with a model of type M. A fluctuation test for parameter instability is performed for assessing the need for splitting a node. If there is a noteworthy instability related to any of the partitioning variables Zj, then splits the node into B locally optimal segments (currently only B = 2 is implemented) and then the process is recursively applied to each of the B children. If no more significant instabilities can be observed, then recursion stops. More precisely, the steps of the algorithm are [14]:
1. Fit the model once to all observations in the current node.
2. Assess whether the parameter estimates are stable with respect to every partitioning variable Z1….. Zℓ. If there is some overall instability selects the variable Zj associated with the highest parameter instability, otherwise stops.
3. Compute the split point(s) that locally optimize the objective function Ψ.
4. Split the node into child nodes and repeat the procedure.
3.
DATA SET
Dataset should be clean and clear so that the training and testing of the algorithm must be clear. Additionally they should provide accurate results. In this paper medical domain data is considered, so the following datasets have been selected:
Table 1. Dataset and Instances
Datasets Number of instances
breast-w.arff 699
diabetes.arff 768
heart-c.arff 920
lung-cancer.arff 32
liver-disorders.arff 345
All the datasets listed in Table 1 are weak machine learning datasets which are found under [12]. Dataset’s structure and properties are defined by several characteristics. This includes the numbers and types of the attributes or variables and various statistical measures applicable to them.
In the simplest case, there is only one variable and the dataset consist of a single column of values, often represent as a list. In spite of the name, such as univariate dataset is not a set in the usual mathematical sense since a given value may occur multiple times. The values may be numbers, such as real numbers or integers. For each variable, the values are normally all of the same kind. However, there may be missing values which must be indicated in some way.
ARFF stands for Attribute Relation File Format. It is an ASCII text file. It defines a list of instances. These instances shares a set of attributes. These files are basically used with weak machine learning software. Department of Computer Science of the University of Waikato has developed these files in a machine learning project.
Fundamentally there are two distinct units in ARFF text files. First unit defines the header information. This information is followed by the information about the data. Header mainly consist of information like name of relation, a list of attributes and their types. Second unit is known as the data unit. It includes the data declarations and instances.
4.
ALGORITHM
This section of a paper describes a new kind of algorithm that is working on the basis of weights to find the most optimum solutions for medical data. In previous section different properties of SVM and decision tree are discussed by which any SVM and decision tree make data model and find the most optimum classification task.
The task can be sub-divide into three steps, first step is the selection of datasets; second step is the implementation of decision tree; the third and last step is to classify instances of decision tree rules using SVM with a weight function.
1. Read data set
2. for each instance in dataset
Create combination sets
3. Let
y
a
b
x4. Generated combination of instance in form of (x1, y1), (x2,
y2)
5. Y is theoretical value for x1 then
Y y x
f( ) 1
) ( 1 )
(x y a b x
f
)) ( 1
( 2
)
(x2 y a b x f
6. Now for each point we found
... ) ( 22 )
( 12
f x f x
s
f(x)2
s
7. If all instances are evaluated then
Exit with classified values
Else
Go to step 3
End
The algorithm given above can be described using an example, suppose that there is a dataset with N number of instances and M number of columns known as attributes.
All attributes are listed with their names and their relative information, suppose that for being cancer tobacco is in habit of a class, and sleeping is another attribute for a relation. Then tobacco is considered as more effective candidate for that instance. Here user interaction is required to pay a weight value for each attribute as per their effect in dataset.
Sort all the weights provided for each attribute. Make pairs of the selected attributes. Like if any instance has attributes in sorted order (a1, a2…..).Then pairing of attributes is performed
using these attributes set. And generate points (a1, an-1), (a1, a n-2)….. now the generated points are consumed using the
formula
y
a
bx
and omits a function f(x). as in same way for all points in data instances we generate functions and defined using new equation ( )2 ...2 )
( 12
f x f x
s where S
provide the unique normalized values.
5.
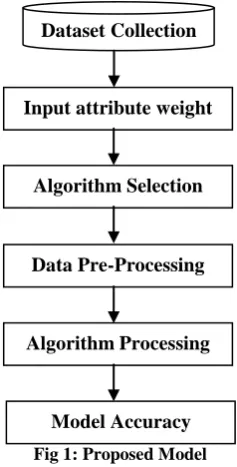
PROPOSED MODEL
This section describes the proposed model which is implemented in this research work. It includes data pre-processing, attribute differentiation, weight inputs and classification.
Dataset collection: It’s a dataset repository containing
different datasets for the execution purpose. A user can select any dataset from this repository. All these datasets are in ARFF format.
Input attributes weights: It’s a user interface through which
[image:3.595.368.487.76.310.2]the system user can add the weights for data execution. Using this interface user can be able to sort the database attributes according to his/her choice.
Fig 1: Proposed Model
Data pre-processing: It includes the cleaning of unwanted objects in the input dataset. Additionally it adopts removing instances of the dataset which contains missing values.
Algorithm processing: User provides the input algorithm using dropdown selection option. The selected algorithm is trained and their supplied attributes are ordered. After processing of algorithm, a data model is obtained that can be used for prediction and classification.
Model accuracy: Model is tested by using the same dataset with random sequences of instances in database object. And numbers of iterations are done for finding the normalized accuracy. The accuracy calculation can be understood with the help following example.
Suppose Number of folds =4;
first time accuracy = 80;
second time =70;
third time = 85;
and fourth time= 95;
than by averaging them we found 82.5 % accuracy from the classification algorithm.
6.
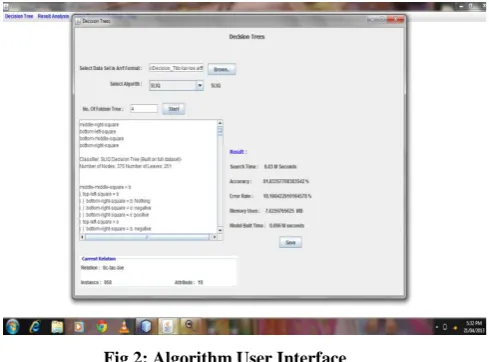
IMPLEMENTATION
This section describes the implementation details of the system. The implementation of the system is performed using JAVA framework and NetBeans IDE. This IDE supports various tools and user interface component by which the application development is quite easy and programmer friendly environment. Additionally this IDE supports various other development library which enables to write fresh codes in easier manner.
Dataset Collection
Input attribute weight
Algorithm Selection
Data Pre-Processing
Algorithm Processing
Fig 2: Algorithm User Interface
In the given figure 2 there is a provision of selection of data set and also there is an option for selecting the algorithm which is required to apply over the dataset. In the given screen we can see that the number of folds indicate that number of times we evaluate the performance of algorithm to normalize the accuracy of the system. The system additionally consists of on console window which provide the model structure and additional dataset information. The evaluated performance of the selected dataset is given in the side column by accuracy, error rate, memory uses, build time and search time. After passing the required parameters system needs to click on the button start by which system start processing with the supplied data set and selected algorithm. And after processing they provide the performance evaluation and data model.
7.
RESULTS
In this section, the results of performance analysis of the implementation of a proposed system are analysed. Analysis presents the comparison of the implemented system with already available algorithms as discussed in background section. This analysis provides the justification for the adoption of the proposed system for the classification of medical data efficiently as compared to other systems.
For evaluating and analysing the performance of the proposed system two different aspects are considered. First one is the accuracy and the number of experiments conducted. Second one is the time consumption to find the data model from the input and the number of experiments.
Table 2 shows the comparison of accuracy values with the increasing data set size of the proposed system with other similar kind of algorithms like C4.5, SVM and RP for classification.
Table 2: Accuracy Comparison
Data set size Proposed
System
C4.5 SVM RP
30(lung-cancer.arff) 62.4 74.43 82.4 62.4 60(diabetes.arff) 69.3 73.48 80.72 69.27 90(diabetes.arff) 72.8 72.71 73.4 68.34 120(diabetes.arff) 75.28 76.3 78.34 69.34 150(diabetes.arff) 73.45 72.38 74.33 71.4 180(diabetes.arff) 78.48 74.27 72.34 67.02 210(diabetes.arff) 80.09 76.1 78.18 72.39 240(diabetes.arff) 83.1 72.88 74.94 69.34
In Table 1 when the data set size in first row is 30, the accuracy of the proposed system is 62.4, which is equal to RP’s accuracy but lesser than C4.5 and SVM. When the data
set size in fourth row increases the accuracy of the proposed system becomes 75.28, which is greater than RP but lesser than C4.5 and SVM. Now in seventh and eighth row when the data size increases with 210 and 240 values respectively, the accuracy of the proposed system becomes greater than C4.5, SVM and RP.
[image:4.595.319.551.267.431.2]According to the comparison results in Table 1, it is found that as the data set size increases accuracy of the proposed system for classification increases. It is also observed that initially the accuracy performance of the proposed system is low when the data set size was small as compared to other considered algorithms, but as the data set size increases the accuracy of the proposed system improves and provides the chances for better classification. Results of accuracy comparisons are also presented in a graph as shown inFigure 3. Thus the proposed system is efficient with respect to accuracy as the data set size increases.
Fig 3: Accuracy Comparison Graph
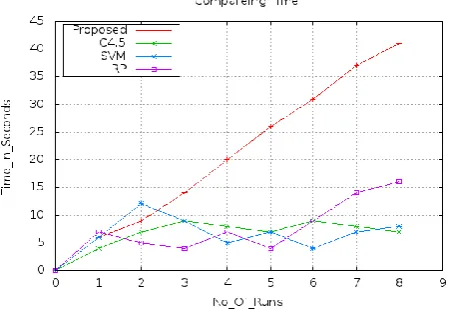
Table 3 shows the comparison of evaluation time with the increasing data set size of the proposed system with other similar kind of algorithms available for classification.
Table 3: Time Consumption Comparison
Data set size Proposed
method
C4.5 SVM RP
30(lung-cancer.arff) 6 4 6 7
60(diabetes.arff) 9 7 12 5
90(diabetes.arff) 14 9 9 4
120(diabetes.arff) 20 8 5 7
150(diabetes.arff) 26 7 7 4
180(diabetes.arff) 31 9 4 9
210(diabetes.arff) 37 8 7 14
240(diabetes.arff) 47 7 8 16
According to the comparison results in Table 3, it is found that as the data set size increases the time consumption to derive the data model for classification increases. It is also observable that the time for evaluation of the proposed system is too high as compared to other similar kind of considered algorithms. Results of evaluation time comparison are also presented in a graph as shown in Figure 4. Thus the proposed system consumes exponential time as the size of data increases and therefore the algorithm is not much efficient with respect to time.
algorithm is higher than otheralgorithms as the size of data is increases. In our second analysis it is found that comparative time is too higher than other algorithm.
According to the results deduced from the analysis, it is suggested that the proposed algorithm is suitable for only those applications where model accuracy is having more preference than time. Means to say that where accuracy matters but time is not much effective parameter.
[image:5.595.57.282.223.378.2]But from the other source of literature it is found that if any algorithm is not suitable in terms of time resources then it is not much adoptable thus here an improvement for time domain.
Fig 4 Time Consumption Comparison Graph
8.
CONCLUSION AND FUTURE WORK
Medical domain is a large domain of study and the same cases reflect the different decision. Thus an advance and suitably adoptable classifier is required by which classification provides the clear decisions for medical domain data. This paper concentrates over searching an effective and efficient data model that works over different medical domain datasets (linear) to find the best adoptable approach. A new classification algorithm is designed and compared with support vector machine, C4.5 decision tree learning and RP algorithms. During analysis it is found that the relative performance of the developed classification algorithm is quite high in terms of accuracy but the algorithm consumes large amount of time and memory resources. Thus the proposed algorithm is sometimes cost effective with increasing size of the data.
In future we will work for the same model of classification and improve the classifier method using the concept of SVM and others by which we improve the time and memory of the system effectively and the algorithm becomes adoptable.
9.
REFERENCES
[1] Mrs.P.Nancy, Dr.R.Geetha Ramani, A Comparison on Performance of Data Mining Algorithmsin Classification of Social Network Data, International Journal of Computer Applications (0975 – 8887) Volume 32– No.8, October 2011.
[2] T3: A Classification Algorithm for Data Mining,Christos Tjortjis and John Keane,Springer-Verlag Berlin Heidelberg 2002.
[3] A multiple-kernel support vector regression approach for stock market price forecasting, 0957-4174/$see front matter, 2010 Elsevier Ltd. All rights reserved. doi: 10.1016/j.eswa.2010.08.004
[4] Improving SVM-Based Nontechnical Loss Detection in Power Utility Using the Fuzzy Inference System, IEEE TRANSACTIONS ON POWER DELIVERY, VOL. 26, NO. 2, APRIL2011.
[5] Blending PSO and ANN for Optimal Design of FSS Filters With Koch Island Patch Elements, IEEE TRANSACTIONS ON MAGNETICS, VOL. 46, NO. 8, AUGUST 2010.
[6] Data Mining: A prediction of performer or underperformer using classification, Umesh Kumar Pandey et al, / (IJCSIT) International Journal of Computer Science and Information Technologies, Vol. 2 (2) , 2011, 686-690.
[7] Distortion Based Algorithms For Privacy Preserving Frequent Item Set Mining , International Journal of Data Mining & Knowledge Management Process (IJDKP) Vol.1, No.4, July 2011.
[8] Mining search behavior and user-generated content Presentation at the Industrial Session EDBT/ICDT 2012, Copyright 2012 ACM 978-1-4503-0790-1/12/03.
[9] Data Mining Applications in Healthcare, Journal of Healthcare Information Management — Vol.19, No.2.
[10]An Implementation of ID3 --- Decision Tree Learning Algorithm, Wei Peng, Juhua Chen and Haiping Zhou, Project of Comp 9417: Machine Learning.
[11]Fuzzy ID3 Decision Tree Approach for Network Reliability Estimation, IJCSI International Journal of Computer Science Issues, Vol. 9, Issue 1, No 1, January 2012ISSN (Online): 1694-0814, www.IJCSI.org
[12]http://repository.seasr.org/Datasets/UCI/arff/
[13]http://www.cs.waikato.ac.nz/ml/weka/arff.html
[14]R. Achim Zeileis, Torsten Hothorn, Kurt Hornik, Party with the Mob: Model-Based Recursive Partitioning, http://cran.r-