Munich Personal RePEc Archive
Indicators for the analysis of the
evolution of the stock exchange
Alexandru, Ciprian Antoniade
The Ecological University of Bucharest
15 February 2008
Indicators for the analysis of the evolution of the stock
exchange
Ciprian-Antoniade ALEXANDRU, Lecturer, PhD candidate The Ecological University of Bucharest
Abstract: This paper comprises a study of the general indicators used for the overall evaluation of the performance of the stock exchange in Romania. Due to these indicators, investors can assess the volume and the dynamics of the respective market. Irrespective of whether the categories are considered together or separately, the number of available
financial instruments is essential for institutional and specialised investors in their diversifying, arbitrage and hedging operations.
The necessity to measure the volume, the quality and the intensity of the activity of the stock exchange through a series of specific quantitative and qualitative indicators led to the
monitoring of their evolution, which makes it possible to be able to characterise the performance of the stock exchange and its level of development at a given period.
Keywords: technical indicators, trading volume
JEL: G10, G12
1. THE EVOLUTION OF THE INDICES AT THE BUCHAREST STOCK EXCHANGE
Also known as technical indicators, the stock exchange indices can establish various correlations between the movement tendencies of prices and volumes. Technical indicators describe a specific situation of the market and their purpose is to establish the current operational performance of the constituent elements of the market, starting from the sub-classes of the instruments up to a level of reference or totally comparative with certain periods. Technical indicators were created as a result of the necessity to be aware of and determine the state and the moving tendency of the market, the way in which the prices of the traded instruments will evolve, the favourable moments for opening or closing a market position.
The indices represent a distinct category of the statistical indicators, which have gained a wide applicability in all the fields of the economic and social activity due to the fact that they reflect expressively and analytically the changes taking place, the role and the influence of various factors in the variation of the analysed phenomena1.
1
A stock exchange index can be defined as a measure of the dynamics of the value of the stock exchange in its whole or of a specific industrial or services sector. In some cases it is possible to calculate regional indices – the criterion according to which firms are included in the calculation formula of this index is represented by their geographical location (this situation is often seen in the case of international indices).
The significance of stock exchange indices results from their capacity to measure the overall performance of the market, or just of one of its segments. Stock exchange indices express the movement of the price of the securities traded on a specific market.
Stock exchange indices provide the investors the possibility to have access to concentrated, concise information which permits them to have a clear image of the way in which the market will evolve.
By monitoring the evolution of the value of a stock exchange index it is possible to identify the overall tendency of a stock exchange or of one of its sectors, represented by the direction of the general movement of the prices of securities, usually shares, in the respective market or in the analysed sector.
Some specialists consider that a stock exchange index also expresses the average preference of capital owners from the point of view of investing the sums of money they have at their disposal in the economic activity.
The stock exchange indices are not classical statistical measures, but rather specific calculations based on conventional arithmetic and geometrical averages. The common unit for expressing all the stock exchange indices is called the point, and its value varies.
A special advantage of the stock exchange indices is represented by the relative way of expressing the index, which makes it possible to make comparisons – which are not influenced by inflation – in different periods of time.
The Bucharest Stock Exchange launched on 16 April 1998 its second official index, called Bucharest Exchange Trading Composite Index (BET-C). The starting value was of 1,000 points, the same as the value of the BET index.
The BET-C index is a composite index which reflects the general evolution of all the companies listed on the BVB regulated market, Ist and IInd Category, excepting the Financial Investment Societies (SIFs). Similarly with the methodology of the other indices launched by BVB, the methodology of the BET-C index reflects the price movement of the shares traded within the main market (“Regular”).
The value of the index is given by the weighted average of the market capitalization of all the companies in its structure.
The weight of the individual shares in the BET-C index basket is determined by the stock exchange capitalization of each company, adjusted according to the representation factor.
market capitalization of the company in the index basket = price x total number of
shares x representation factor x price correction factor
The purpose of using the representation factor is that of limiting the weight of an individual company in the BET-C index basket. The use of the representation factor is meant to assure the fact that the weight of the individual market capitalization of each company does not exceed at the adjustment moment (when the representation factors are estimated) the maximum limit of 20% of the total value of the capitalization of the BET-C index basket.
The calculation formula for the BET-C index is:
= − − = − × × × × × × × = N i t i i t i t i N i t i i t i t i t t c R q p c R q p BETC BETC , 1 1 , , 1 , , 1 , , ,
1 (1)
where:
- BETCt – the value of the BET-C index at the current moment, t
- BETCt-1 – the value of the BET-C index at the current moment, t-1
- pi,t – the price of the shares of company i at the current moment, t
- pi,t-1 – the closing price of the shares of company i at the moment t-1
- qi,t – the number of shares at the current moment t
- Ri – the representation factor of maximum 20% of the weight of the constituents of the index basket, which corresponds to the shares of company i and is calculated with two decimals, with values in the interval (0,1]
- ci,t – the correction factor of the prices of the shares of company i at the moment t, in the days of operational review, which is calculated with six decimals
- ci,t-1 – the correction factor of the price of the shares of company i at the
moment t-1, in the days of operational review, which is calculated with six decimals
- N – the number of companies included in the index basket.
The adjustment and review principles are identical with those of the BET index, excepting the free float factor.
Due to the fact that the main purpose for creating the composite index is to reflect the evolution of all the traded shares, new companies are automatically included in the index basket as they are listed, in the following day after the price is established on the market.
The BET-C index is also expressed daily in EURO and USD through the same methodology as the one used for the BET index.
most liquid companies listed at BVB. The number of companies included in the BET index basket is of 10, but it is possible for the number to increase in the future as a result of listing new companies, which are representative for sectors in the national economy.
The BET index basket includes the shares of the most liquid 10 companies listed on the BVB regulated market, Ist and IInd Category, excepting financial investment societies traded on the regulated market administered by BVB, investment funds and other similar entities.
The criteria for selecting the companies which will be included in the
index basket are liquidity and relevant aspects taken into consideration by the BVB Indices Committee, such as the financial situation of the company, legal aspects, transparency and the interests of the stakeholders.
Companies with the highest liquidity coefficient are selected in a descending order for being included in the BET index basket. The liquidity coefficient is calculated quarterly, before the periodic meetings of the Index Committee in March and September, and it represents the main criterion for drawing up the selection list of the companies which are eligible for being included in the index basket.
All these changes of the calculation methodology of the BET index were made so that the calculated values should be as representative as possible for the Romanian stock exchange, and that external factors such as splits should not influence artificially the evolution of the index values.
From now on, the value of the index will be mainly influenced by the price movement of the shares included in the index, as it was in the former calculation formula. The new methodology influenced very much the way in which the weight of the symbols included in the index is calculated.
2. THE EVOLUTION OF THE STOCK EXCHANGE CAPITALIZATION
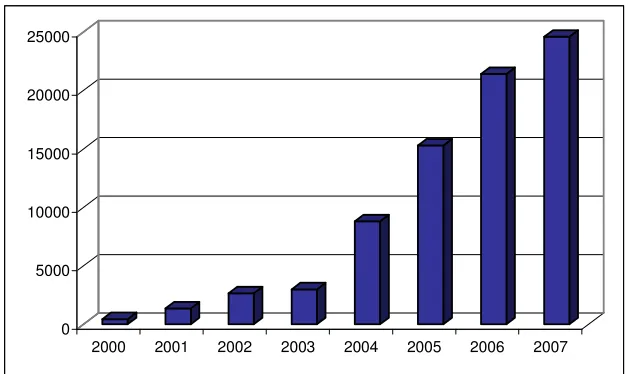
Table 1 The evolution of the BVB capitalization in the period 2000-2007
2000 2001 2002 2003 2004 2005 2006 2007 BVB
Capit.
450 1,361 2,646 2,991 8,819 15,311 21,415 24,601 Relative
growth
- 202% 94% 13% 195% 74% 40% 15%
Source: BVB data after the last trading day in the respective years
As it can be seen in Figure 1, the evolution of the capitalization respects the configuration of an exponential function, a trend sustained by several factors, starting with those concerning the globalisation of financial markets and the access of foreign capital, and including also positive macro-economic indicators registered in the last years.
0 5000 10000 15000 20000 25000
2000 2001 2002 2003 2004 2005 2006 2007
Fig. 1 The nominal evolution of the BVB capitalization in the period 2000-2007
Source: BVB data after the last trading day in the respective years
[image:6.612.158.472.330.517.2]Table 2 The evolution of capitalization, of the traded value and of the BET index at
BVB in the years 2004-2007*
2004 2005 2006 2007* Capitalization:
- value (bill. lei)
- growth year/previous year (%)
- weight in GDP (%)
34.1 180.2 13.9 56.1 64.5 19.5 73.3 30.7 21.4 87.9 59.3 n/a
Traded value: - value (bill. lei)
- growth year/previous year (%) 2.7 164.7 7.9 192.6 10.7 35.4 7.49 63.5 BET: - points
- growth year/previous year (%) 4.364.7 212.9 6.586.1 50.9 8.050.1 22.2 6.665.6 37
Source: BVB, CNVM reports, summary of transactions on www.bvb.ro for the
years 2004-2006 and the 1st quarter of 2007, statistical yearbooks
According to statistical data regarding the annual value of GDP and to data from the last trading session in the respective year, we notice an increasingly significant growth of the capitalization of companies listed at BVB, as a weight of GDP (Table 3). In 2006, the BVB capitalization represents 21.42% of GDP, while the gross domestic product itself registers an important development from one year to the other.
Table 3 The evolution of BVB capitalization in GDP, in the period 2005-2006
- million lei - 2000 2001 2002 2003 2004 2005 2006 BVB
Capit. 1,102 3,857 9,158 12,187 34,147 56,065 73,342 GDP 80,377 116,769 151,475 197,565 246,372 287,186 342,418 % 1.37% 3.30% 6.05% 6.17% 13.86% 19.52% 21.42%
Source: BVB, INS
The growth rhythm of the capitalization registered a slowing down trend in the years 2005-2006, mainly due to the fact that individual ownership declined in the favour of companies controlled through groups of persons and firms, and that the
level of ownership was limited to 1% of the owners’ equity of the SIF. This measure
also determined a slowdown of the positive trend of the BET-FI index, which registered at the end of September 2006 an appreciation of just 2.1% compared to February in the same year.
Another measure which discouraged those investors that focused on speculative trading and capital turnover at short time intervals was represented by
the implementation of the provisions of the new fiscal code, which mentions that the taxation rate of incomes obtained from investments and from the transfer of alienated real estate properties in a period shorter than one year after the acquisition date increased to 16%.
CONCLUSIONS
In the last years, the evolution of the Romanian stock exchange is characterised by a decreasing dynamics, usually registered after the first quarter. In 2007, the decrease occurred earlier due to internal political factors, and was accentuated by the external international situation. In February 2007, a change of trend was noticed, and some trading sessions were dominated by feelings of panic. Despite all these fluctuations, the capitalization and the total value of transactions were in the middle of 2007 above the levels recorded in December and in the similar period of 2006. After the significantly weak beginning of 2008, an ascending evolution is expected to follow.
BIBLIOGRAPHY
1. Ciprian A., Pia a de capital-instrumente i institu ii, Bren, Bucharest, 2007 2. B di M., Baron T., Korka M., Statistic pentru afaceri, Eficient, Bucharest, 1998
3. * * *, 2000-2005, Romanian Statistical Yearbook, Bucharest 4. * * *, 2001-2005, BNR annual reports, Bucharest
5. * * *, Bucharest Stock Exchange, www.bvb.ro 6. * * *, SSIF Intercapital Invest, www.intercapital.ro