http://dx.doi.org/10.4236/ajac.2016.73025
How to cite this paper: Su, J.X., Gao, X.K., Tan, L.R., Liu, X.Z., Ye, Y.Q., Chen, Y.F., Ma, K.S. and Pan, T. (2016) Near-Infrared Spectroscopy Combined with Absorbance Upper Optimization Partial Least Squares Applied to Rapid Analysis of Polysac-charide for Proprietary Chinese Medicine Oral Solution. American Journal of Analytical Chemistry, 7, 275-281.
http://dx.doi.org/10.4236/ajac.2016.73025
Near-Infrared Spectroscopy Combined with
Absorbance Upper Optimization Partial
Least Squares Applied to Rapid Analysis of
Polysaccharide for Proprietary Chinese
Medicine Oral Solution
Jiexiong Su1, Xinkai Gao1, Lirong Tan1, Xianzhao Liu1, Yueqing Ye1, Yifang Chen2, Kaisheng Ma2, Tao Pan2*
1Infinitus (China) Company Ltd., Jiangmen, China
2Department of Optoelectronic Engineering, Jinan University, Guangzhou, China
Received 29 January 2016; accepted 13 March 2016; published 16 March 2016
Copyright © 2016 by authors and Scientific Research Publishing Inc.
This work is licensed under the Creative Commons Attribution International License (CC BY).
http://creativecommons.org/licenses/by/4.0/
Abstract
Near-infrared (NIR) spectroscopy was applied to reagent-free quantitative analysis of polysaccha-ride of a brand product of proprietary Chinese medicine (PCM) oral solution samples. A novel me-thod, called absorbance upper optimization partial least squares (AUO-PLS), was proposed and successfully applied to the wavelength selection. Based on varied partitioning of the calibration and prediction sample sets, the parameter optimization was performed to achieve stability. On the basis of the AUO-PLS method, the selected upper bound of appropriate absorbance was 1.53 and the corresponding wavebands combination was 400 - 1880 & 2088 - 2346 nm. With the use of random validation samples excluded from the modeling process, the root-mean-square error and correlation coefficient of prediction for polysaccharide were 27.09 mg∙L−1 and 0.888, respectively. The results indicate that the NIR prediction values are close to those of the measured values. NIR spectroscopy combined with AUO-PLS method provided a promising tool for quantification of the polysaccharide for PCM oral solution and this technique is rapid and simple when compared with conventional methods.
Keywords
Near-Infrared Spectroscopic Analysis, Proprietary Chinese Medicine Oral Solution, Polysaccharide, Absorbance Upper Optimization Partial Least Squares
1. Introduction
Proprietary Chinese medicine (PCM) oral solution is a kind of health-care nourishing product, which is conve-nient to eat. According to the theory of traditional Chinese medicine, modern research results and practical ex-perience, it is crafted by extracting some active components from a variety of Chinese herbal medicine. The compound polysaccharide, as the main active ingredients of PCM oral solution, can effectively regulate and en-hance human immunity, prevent diseases and improve physical fitness. In the process of producing PCM oral solution, the real-time determination of the polysaccharide content is the necessary guarantee of monitoring the quality of the products. The conventional method [1] needs sample pretreatment and chemical reagent, which is difficult for real-time monitoring of production quality. Therefore, a rapid, simple, and reagent-free method has the significant value in practice.
Near-infrared (NIR) spectroscopy primarily reflects absorption of overtones and combination of vibrations of X-H functional groups (such as C-H, O-H, and N-H). Because of weak absorption strength, most of samples can be measured directly without preprocessing. This rapid, simple and non-destructive technique has obvious ad-vantages and is commonly used in many areas, including agriculture [2]-[6], food [7] [8], environment [9], bio-medicine [10]-[13] and pharmaceuticals [14] [15]. However, to the best of our knowledge, a quantification me-thod for the determination of polysaccharide in the PCM oral solution using NIR spectroscopy has not been de-veloped yet. Since the NIR spectra have serious overlapping and no significant absorption band, especially for the PCM oral solution with multiple components, appropriate chemometric methods must be employed to obtain wavelength optimization and quantitative analysis models with high signal-to-noise ratio (SNR). It can achieve extracting information variables and remove the noise interference. Partial least squares (PLS) regression has been recognized as an effective multivariate analysis method, and has been widely applied in the spectral analy-sis field [2]-[13].
Zengjian oral solution is a well-known brand product of PCM healthy oral solution, which is produced via re-fining polysaccharide from natural plant such as tremella, enoki and Chinese wolfberry etc. In this study, absor-bance upper optimization PLS (AUO-PLS) was proposed, and NIR spectroscopy combined with AUO-PLS me-thod was successfully applied to the rapid and reagent-free quantification of polysaccharide for Zengjian oral solution.
The stability of the spectral analysis model is very important in practice. Numerous experiments show that differences in partitioning of calibration and prediction sample sets can result in fluctuations in predictions and parameters (e.g. the number of PLS factors), thus leading to unstable results [3] [5] [8] [9] [12]. In the current study, a rigorous process of calibration, prediction, and validation based on randomness and stability was per-formed to achieve the goal of spectroscopic analysis.
2. Materials and Methods
2.1. Experimental Materials, Instruments, and Measurement Methods
A total of 1533 Zengjian oral solution samples were collected from infinitus (China) Company Ltd. The poly-saccharide concentrations of these samples were measured with a UV-2300 UV-Vis spectrophotometer (Shang-hai Tianmei, China) using mineral chameleon titration method. Mineral chameleon titration is capacity analysis method with potassium permanganate solution as titrant. It requires the use of chemical reagents, and by color reaction to achieve accurate quantification of the polysaccharide concentration of a sample. The measured val-ues ranged from 330.26 mg∙L−1 to 679.99 mg∙L−1, and the mean value and standard deviation were 484.67 and 52.53 mg∙L−1, respectively, which were used as the reference values for the calibration modeling of NIR spec-troscopic analysis. Based on the obtained calibration model, a new method without chemical reagent for rapid determination of polysaccharide concentration of the PCM oral solution samples can be established with NIR spectroscopy.
2.2. Calibration, Prediction, and Validation Process with Stability
First, the 693 samples were randomly selected from a total of 1533 samples as the validation sample set, which were not subjected to the modeling optimization process. Then, the remaining 840 samples were used as model-ing sample set and were further randomly divided into calibration (420 samples) and prediction (420 samples) sample sets for 100 times. The calibration and prediction models were established for all 100 divisions, and the model parameters were optimized depending on the mean prediction effects for all divisions to obtain objective and stable models.
The root-mean-square errors (SEC, SEP) and correlation coefficients (RC, RP) for calibration and prediction in modeling set were calculated, respectively. For each division (i) of calibration and prediction sets, they were denoted as SECi, SEPi, RC,i and RP,i, respectively, i=1, 2,,100. The mean values (SEPAve, RP,Ave) and stan-dard deviations (SEPSD, RP,SD) of SEPi and RP,i for all the divisions were further calculated, respectively. These
values were used to analyze model prediction accuracy and stability. The equation SEP+ = SEPAve + SEPSD was used as a comprehensive indicator of prediction accuracy and stability of a model. A smaller value of SEP+ in-dicated higher accuracy and stability. The model parameters were selected to achieve minimum SEP+. The se-lected model was then revalidated against the validation sample set. The root-mean-square error and correlation coefficient of prediction in validation sample set were then calculated and denoted as SEP and RP, respectively. The calculation formulas are as follows:
(
)
21 SEP 1 m k k k C C m = − = −
∑
(1)(
)
(
)
(
)
(
)
Ave Ave 1 P 2 2 Ave Ave 1 1 R m k k k m m k k k kC C C C
C C C C
= = = − − = − −
∑
∑
∑
(2)where m is the number of validation samples; Ck and Ck are the measured and predicted polysaccharide
con-centrations of the kth validation sample, respectively; CAve and CAve are the mean measured polysaccharide value and the mean predicted polysaccharide value of all the validation samples, respectively.
2.3. Selection of Number of PLS Factors with Stability
The number of PLS factors (F) is an important parameter of PLS method that corresponds to the number of spectral latent variables corresponding to sample information. The selection of a reasonable F is both necessary and difficult. If F was set too small, the sample information in the spectra was unable to be fully reflected. If F was set too big, extra noises would be led into the model, the prediction ability would descend in both cases. In the present study, F was selected according to minimum SEP+ based on all divisions for the calibration and pre-diction sample sets. Thus, the optimal number of PLS factors exhibited stability and practicality.
2.4. AUO-PLS Method
Lambert Beer’s law is described by the following equation:
( )
1( )
( )
( )
01
lg I lg
A I T λ λ λ λ = − =
(3)
where λ is the wavelength; A(λ) is the absorbance; I0(λ) and I1(λ) are the intensity of incident light and the inten-sity of transmitted light through the sample, respectively; and T(λ) is the transmittance, i.e., the ratio of trans-mitted light intensity and incident light intensity. Conversely, Equation (3) can then be expressed as follows:
( )
1( )
( )
( ) 010 A 100%
I T I λ λ λ λ −
According to the above equation, e.g. when A(λ) = 4, the transmitted light intensity was merely one ten thou-sandth of the incident light intensity, i.e., the 99.99% of the incident light was absorbed by the sample. In this case, the transmitted light was very weak and was difficult to detect; it would thus likely cause noise in the spectrum. Therefore, wavelength selection with appropriate absorbance values, which correspond to a high qual-ity of sample information and low levels of noise, is necessary. In this study, a novel PLS-based wavelength se-lection method, named absorbance upper optimization PLS (AUO-PLS) was proposed on the basis of the selec-tion of the upper bound of absorbance, which can appropriately minimize noise bands. The specific steps are as follows:
Step 1: A region of wavelength screening (Δ) was set in advance for the entire scanning region according to the physical and chemical characteristics of the measured objects and the instrument properties. Meanwhile, in the average spectrum for all samples within the region 4, the minimum and maximum values of absorbance were denoted as Amin and Amax, respectively. An appropriate step of absorbance (ε) was set.
Step 2: Set some value A*, A*≥ Amin, the upper bound of absorbance Aupper was changed from A* to Amax with the step ε. According to relationship between wavelength and absorbance within the region Δ, for each Aupper, the absorbance interval (Amin, Aupper) corresponded to a wavebands combination.
Step 3: Every obtained wavebands combination was employed for establishing the PLS calibration and pre-diction models. The corresponding SEPAve, RP,Ave, SEPSD, RP,SD and SEP+ values were then calculated.
Step 4: According to minimum SEP+, the optimal Aupper was determined, and the wavebands combination corresponded (Amin, Aupper) was also selected.
In this study, the region Δ was set to be the entire scanning region (400 - 2498 nm) with 1050 wavelengths. The Amin was greater than or close to zero, and the Amax value was less than or close to five, therefore, Amin and Amax were set to 0 and 5, respectively. Noticed that around 1450 nm is another obvious absorption peak with ab-sorbance value 1.40. In order to retain the relevant information of the region, the A* value was set as 1.40 (namely set Aupper > 1.40), because the main purpose in here is to remove the noise bands with saturate absorp-tion. The absorbance step ε was set to 0.01 and the number of PLS factors (F) was set to F∈
{
1, 2,, 30}
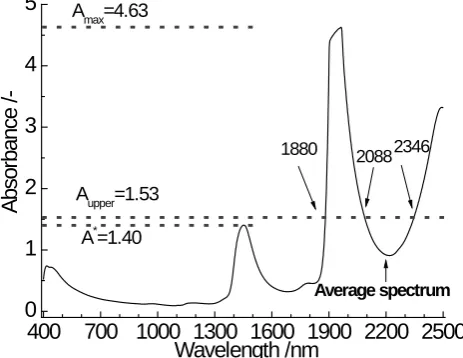
. Fig-ure 1 shows a sketch map of the relationship between wavelength and absorbance for the case in which the ab-sorbance value Aupper = 1.53 and the corresponding wavebands combination is 400 - 1880 & 2088 - 2346 nm.3. Results and Discussion
3.1. Wavebands Combination Selection with AUO-PLS
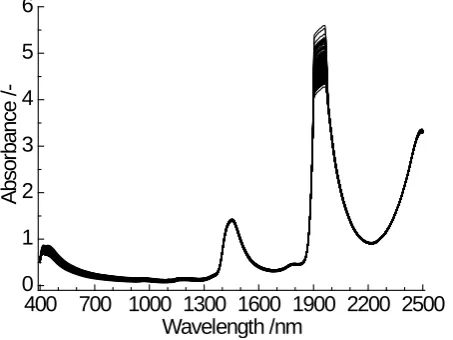
[image:4.595.197.429.513.692.2]The NIR spectra of the 1533 samples of Zengjian oral solution in the entire scanning region (400 - 2498 nm) are shown in Figure 2. As indicated in the figure, a saturate absorption region appears at about 1900 - 2000 nm. The saturate region was caused by strong absorption of water molecules and scattering of some tangible components
Figure 1. Sketch map for relationship between wavelength and
absorbance. 400 700 1000 1300 1600 1900 2200 2500 0
1 2 3 4 5
A
upper=1.53
Amax=4.63
A*=1.40
Average spectrum
2346 2088 1880
A
bs
or
banc
e /
Figure 2. NIR spectra of 1533 samples of Zengjian oral solution in the en-tire scanning region (400 - 2498 nm).
in oral solution samples. AUO-PLS method mentioned in Section 2.4 was performed to avoid the noise wave-bands with high absorption.
The SEP+ values for each upper bound of absorbance Aupper are shown in Figure 3. The results showed that, the prediction polysaccharide value achieved the minimum SEP+ when about Aupper = 1.53. The corresponding wavebands combination was 400 - 1880 & 2088 - 2346 nm with 871 wavelengths, and the prediction accuracy and stability results (SEPAve, RP,Ave, SEPSD, RP,SD, and SEP+) are summarized in Table 1. As a comparison, the full PLS model based on the entire scanning region was also established, and the prediction effects were also summarized in Table 1. The SEP+ value for optimal AUO-PLS model was 27.81 mg∙L−1, which was obviously better than that of the full PLS model. The relative SEP value (RSEP)for the optimal AUO-PLS model was 5.6%. The results show that, by avoiding the noise wavebands with high absorption, the prediction ability was improved and model complexity was reduced.
3.2. Model Validation
The randomly selected validation samples, which were excluded in the modeling optimization process, were used to validate the adopted AUO-PLS model. The PLS regression coefficients were calculated using the spec-tral data and measured polysaccharide concentrations of all modeling samples depending on the selected para-meter F. The predicted polysaccharide concentrations of the validation samples were then calculated using the obtained regression coefficients and spectra of the validation samples.
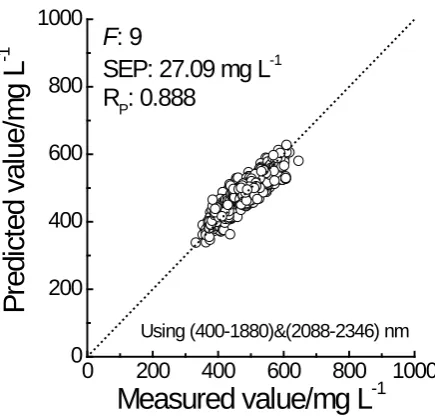
Figure 4 shows the relationship between the NIR predicted and measured values of the 693 validation sam-ples. The evaluation values (SEP and RP) for validation effect were 27.09 mg∙L−1 and 0.888, respectively. The results indicate that the NIR prediction values of the validation samples are close to those of the measured val-ues. Satisfactory validation effects were achieved for the random samples because stability was considered in the modeling optimization process.
4. Conclusion
Wavelength selection is crucial for spectroscopic analysis, as it improves the effectiveness of prediction, reduces model complexity, and aids in the design of a specialized spectrometer with a high signal-to-noise ratio. The proposed AUO-PLS method focused on the optimization of upper bounds of absorbance to avoid noise interfe-rence caused by high absorbance. Based on the relationship between wavelength and absorbance, the appropri-ate wavebands combination was selected. NIR spectroscopy combined with the proposed AUO-PLS method was successfully employed for the reagent-free and rapid quantitative analysis of polysaccharide for Zengjian oral solution. A rigorous process of calibration, prediction, and validation based on randomness and stability was performed to produce objective and stable models. We believe that AUO-PLS has such applicability and can be also applied to other brand product of PCM healthy oral solution.
400 700 1000 1300 1600 1900 2200 2500 0
1 2 3 4 5 6
Wavelength /nm
A
bs
or
banc
e /
-Figure 3.SEP+ values for each upper bound of absorbance with AUO-PLS me-thod.
Figure 4. Relationship between the predicted and measured values of the
valida-tion samples with AUO-PLS method.
Table 1.Prediction effects of full PLS and AUO-PLS models for polysaccharide.
Methods Adopted wavebands Aupper F (mg∙LSEPAve −1) (mg∙LSEPSD −1) RP,Ave RP,SD SEP +
(mg∙L−1) RSEP (%)
Full PLS 400 - 2498 - 12 36.75 1.30 0.723 0.019 38.05 7.6
AUO-PLS 400 - 1880 & 2088 - 2346 1.53 9 26.97 0.84 0.858 0.010 27.81 5.6
Acknowledgements
This work was supported by Foundation of Infinitus (China) Company Ltd.
References
[1] Yang, L.F. and Liu, Z. (2009) The Research of Determination Method of Polysaccharide Content in Compound Prepa-rations. Modem Traditional Chinese Medicine, 28, 244-246.
[2] Moron, A. and Cozzolino, D. (2002) Application of Near Infrared Reflectance Spectroscopy for the Analysis of
Or-1.4 1.8 2.2 2.6 3.0 3.4 3.8 4.2 4.6 5.0 26
28 30 32 34 36 38
1.50 1.52 1.54 1.56 27.7
27.8 27.9 28.0
S
EP
+ /m
g
L
-1
Upper bound of absorbance
/-1.53
0 200 400 600 800 1000 0
200 400 600 800 1000
F
: 9
SEP: 27.09 mg L
-1R
P: 0.888
Using (400-1880)&(2088-2346) nm
P
redi
ct
ed
val
ue/
m
g
L
-1
[image:6.595.204.422.292.500.2] [image:6.595.88.542.554.614.2]ganic C, Total N and pH in Soils of Uruguay. Journal of Near Infrared Spectroscopy, 10, 215-221.
http://dx.doi.org/10.1255/jnirs.338
[3] Chen, H.Z., Pan, T., Chen J.M. and Lu, Q.P. (2011) Waveband Selection for NIR Spectroscopy Analysis of Soil Or-ganic Matter Based on SG Smoothing and MWPLS Methods. Chemometrics and Intelligent Laboratory Systems, 107, 139-146. http://dx.doi.org/10.1016/j.chemolab.2011.02.008
[4] Pan, T., Wu, Z.T. and Chen, J.M. (2012) Waveband Optimization for Near-Infrared Spectroscopic Analysis of Total Nitrogen in Soil. Chinese Journal of Analytical Chemistry, 40, 920-924.
[5] Pan, T., Li, M.M. and Chen, J.M. (2014) Selection Method of Quasi-Continuous Wavelength Combination with Ap-plications to the Near-Infrared Spectroscopic Analysis of Soil Organic Matter. Applied Spectroscopy, 68, 263-271.
http://dx.doi.org/10.1366/13-07088
[6] Chen, J.M., Pan, T., Liu, G.S. and Han, Y. (2014) Selection of Stable Equivalent Wavebands for Near-Infrared Spec-troscopic Analysis of Total Nitrogen in Soil. Journal of Innovative Optical Health Sciences, 7, 1-9.
http://dx.doi.org/10.1142/S1793545813500715
[7] Chen, J.Y., Iyo, C. and Kawano, S. (2002) Effect of Multiplicative Scatter Correction on Wavelength Selection for Near Infrared Calibration to Determine Fat Content in Raw Milk. Journal of Near Infrared Spectroscopy, 10, 301-307.
http://dx.doi.org/10.1255/jnirs.346
[8] Liu, Z.Y., Liu, B., Pan, T. and Yang, J.D. (2013) Determination of Amino Acid Nitrogen in Tuber Mustard Using Near-Infrared Spectroscopy with Waveband Selection Stability. Spectrochimica Acta. Part A: Molecular and
Biomo-lecular Spectroscopy, 102, 269-274. http://dx.doi.org/10.1016/j.saa.2012.10.006
[9] Pan, T., Chen, Z.H., Chen, J.M. and Liu, Z.Y. (2012) Near-Infrared Spectroscopy with Waveband Selection Stability for the Determination of COD in Sugar Refinery Wastewater. Analytical Methods, 4, 1046-1052.
http://dx.doi.org/10.1039/c2ay05856a
[10] Pan, T., Liu, J.M. and Chen, J.M. (2013) Rapid Determination of Preliminary Thalassaemia Screening Indicators Based on Near-Infrared Spectroscopy with Wavelength Selection Stability. Analytical Methods, 5, 4355-4362.
http://dx.doi.org/10.1039/c3ay40732b
[11] Pan, T., Huang, W.J., Liu, Z.Y. and Yao, L.J. (2012) Near-Infrared Spectroscopic Analysis of Hemoglobin with Stabil-ity Based on Human Hemolysates Samples. American Journal of Analytical Chemistry, 3, 19-23.
http://dx.doi.org/10.4236/ajac.2012.31004
[12] Xie, J., Pan, T., Chen, J.M., Chen H.Z. and Ren, X.H. (2010) Joint Optimization of Savitzky-Golay Smoothing Models and Partial Least Squares Factors for Near-Infrared Spectroscopic Analysis of Serum Glucose. Chinese Journal of
Analytical Chemistry, 38, 342-346. http://dx.doi.org/10.3724/sp.j.1096.2010.00342
[13] Han, Y., Chen, J.M., Pan, T. and Liu, G.S. (2015) Determination of Glycated Hemoglobin Using Near-Infrared Spec-troscopy Combined with Equidistant Combination Partial Least Squares. Chemometrics and Intelligent Laboratory
Sys-tems, 145, 84-92. http://dx.doi.org/10.1016/j.chemolab.2015.04.015
[14] Luypaert, J., Massart, D.L. and Vander Heyden, Y. (2007) Near-Infrared Spectroscopy Applications in Pharmaceutical Analysis. Talanta, 72, 865-883. http://dx.doi.org/10.1016/j.talanta.2006.12.023
[15] Reich, G. (2005) Near-Infrared Spectroscopy and Imaging: Basic Principles and Pharmaceutical Applications. Advanced