Munich Personal RePEc Archive
The energy consumption-GDP nexus:
Panel data evidence from 88 countries
Sinha, Dipendra
Ritsumeikan Asia Pacific University, Japan and Macquarie
University, Australia
7 November 2009
Online at
https://mpra.ub.uni-muenchen.de/18446/
The Energy Consumption-GDP Nexus: Panel Data Evidence from 88 Countries
Dipendra Sinha, Ritsumeikan Asia Pacific University, Japan and Macquarie University, Australia
Abstract:
This paper uses panel data from 88 countries to examine the relationship between per capita GDP and per capita energy consumption. The results show that per capita GDP and per capita energy consumption are cointegrated. Also, there is a two-way short-run, long-run and strong causality between the growth of GDP and growth of energy
consumption. These results are in contrast to almost all other existing studies.
I. Introduction
There have been numerous studies on the relationship between energy consumption and
GDP. This paper uses panel data from the following 88 countries to examine the
relationship: Algeria, Argentina, Australia, Austria, Bangladesh, Belgium, Benin,
Bolivia, Brazil, Cameroon, Canada, Chile, China, Colombia, Democratic Republic of the
Congo, , Republic of the Congo, Costa Rica, Cote d’Ivoire, Cyprus, Denmark,
Dominican, Ecuador, Egypt, El Salvador, Finland, France, Gabon, Georgia, Germany,
Ghana, Greece, Guatemala, Haiti, Honduras, Hong Kong, Hungary, Iceland, India,
Indonesia, Iran, Ireland, Israel, Italy, Jamaica, Japan, Jordan, Kenya, Korea, Latvia,
Luxembourg, Malaysia, Malta, Mexico, Morocco, Netherlands, New Zealand, Nicaragua,
Nigeria, Norway, Oman, Pakistan, Panama, Paraguay, Peru, Philippines, Portugal, Saudi
Arabia, Senegal, Singapore, South Africa, Spain, Sri Lanka, Sudan, Sweden, Switzerland,
Syrian Arab Republic, Thailand, Togo, Trinidad and Tobago, Tunisia, Turkey, UAE, UK,
USA, Uruguay, Venezuela, Zambia and Zimbabwe. This paper differs from the previous
panel study in two important ways. First, we use the largest dataset by including a panel
of 88 countries. Second, for per capita income, we use purchasing power adjusted data.
Previous studies such as Lee (2005) and Mahadevan and Asafu-Adjaye (2007) use per
capita income in constant US dollars. But, purchasing power parity adjusted data on per
capita income are preferable for panel data.
There is a large body of literature that examines the relationship between GDP
and energy. One of the first studies was by Kraft and Kraft (1978). They use data for the
USA for 1947-1974 to study the causal relationship between gross energy consumption
conclusion is that energy conservation would not adversely affect GNP. This study was
followed by many other studies such as Akarca and and Long II (1980), Abosedra and
Baghestani (1991), Masih and Masih (1997) and Soytas and Sari (2003). These studies
employ data for a single country or countries and find varied results. More recent studies
use panel data. Al-Iriani (2006) uses panel data for member countries of the Gulf
Cooperation Council (GCC). He finds uni-directional causality from GDP to energy
consumption. This result suggests that energy conservation policies may be adopted by
the GCC without any adverse effects on the growth rate of GDP. Chien-Chiang (2005)
uses panel data for 18 developing countries. He finds short-run and long-run
uni-directional causality flowing from energy to GDP. His result suggests that energy
conservation may harm economic growth in the short-run and the long run. Mahadevan
and Asafu-Adjaye (2007) find that for the energy exporting developed countries, there is
both short-run and long-run bi-directional causality between economic growth and energy
consumption while for the energy exporting developing countries, energy consumption
causes economic growth only in the short-run.
II. Data, Methodology and Results
This paper uses panel data for 88 countries for natural logarithms of per capita GDP in
constant purchasing power parity terms (denoted by gdp) and per capita energy
consumption in terms of kilograms of oil equivalent (denoted by energy). The first
differences of these two variables (which give us the growth rates) are denoted by ∆gdp
and ∆energy . Annual data are for 1975-2003 for all countries. Thus, we have a balanced
use the following panel unit root tests: Im, Pesaran and Shin (2003) test, and Levin, Lin
and Chu (2002) test and Fisher type ADF and PP tests proposed by Maddala and Wu
(1999). The results of the panel unit root tests for gdp and energy are in Tables 1 and 2,
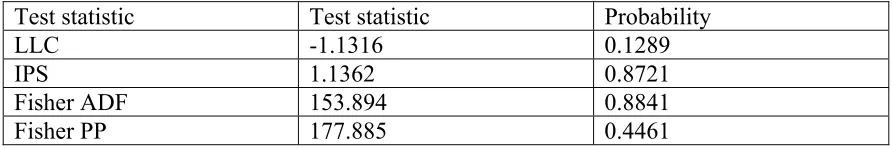
respectively. We find that both gdp and energy have unit roots according to LLC, IPS,
Fisher ADF and Fisher PP unit root tests. The unit root tests for ∆gdp and ∆energy are in
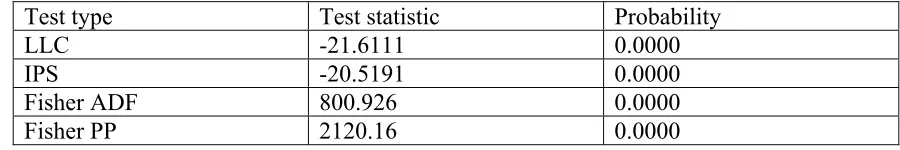
Tables 3 and 4 respectively. Both variables are stationary in their first differences. Since
both variables are I(1), we proceed with Pedroni’s (1999, 2004) panel cointegration tests.
We consider the following bivariate relationships:
gdpit = αi +δt + βenergyit + εit (1)
where α is the country effect, δ is the fixed effect and ε is the residual.
[Tables 1-5, about here]
The results of the panel ADF and panel PP cointegration tests are in Table 5. It shows
that gdp and energy are cointegrated at the 5% level of significance. Since the two
variables are cointegrated, we proceed with the dynamic panel VECM causality tests.
Like Mahadevan and Asafu-Adjaye (2007), we use Granger causality model with a
dynamic error term as proposed by Holz-Eakin, Newey and Rosen (1988). For the
VECM tests, we use the error correction model as follows:
∆gdpit = ∆θ1j +
∑
θ mk
11ik∆gdpit-k +
∑
θ mk
12ik∆energyit-k + λ1εit-1 + u1it (2)
∆energyit = ∆θ2j +
∑
θ mk
21ik∆energyit-k +
∑
θ mk
22ik∆gdpit-k + + λ2εit-1 + u2it (3)
Here, k is the lag length, ∆ stands for first difference and εit-1 is the lagged residual from
the cointegrating equation (1) . To test for short run causality running from the growth of
equal to zero. Similarly, the reverse short run causality can be tested by testing the
restriction that the coefficients θ22ik are equal to zero. To test for long run causality
flowing from the growth of per capita energy consumption to the growth rate of per
capita GDP, we test the restriction λ1 =0 in (2). The reverse long run causality is
examined by testing the restriction λ2 = 0 in (3). For the joint short run/long run causality
(also known as the strong Granger causality) running from the growth of per capita
energy consumption to growth of per capita GDP, we test the restrictions that θ12ik and λ1
are equal to zero. The reverse causality is similarly defined.
The results for short run causality, long run causality and strong causality for lags
of 1, 2 and 3 are given in tables 6, 7 and 8, respectively. Tests with higher order lags up
to 10 were also carried out. The results were the same. The Schwarz Bayesian criterion
did not select lags higher than 3.
[Tables 6-8, about here]
The results are clear-cut. We find that there is evidence of short run, long run and
strong two-way Granger causality between the growth rates of per capita GDP and
energy consumption. These results are in contrast to many other studies which find
causality in one direction or the other. Our sample of countries consists of 58 developing
and 30 developed countries. Although not reported here, we also performed cointegration
and causality tests separately for developing and developed countries. The results are
quite similar for those of the panel of 88 countries.
III. Conclusions
We use panel data for 88 countries to test for cointegration between per capita real GDP
Thus, we conduct tests for short-run, long run and strong Granger causality between the
growth rates of per capita GDP and energy consumption. We find evidence for two-way
short-run, long-run and strong causality between the two variables. These results
References:
Abosedra, S. and Baghestani, H. (1991), “New Evidence on the Causal Relationship
United States Energy Consumption and Gross National Product,” Journal of Energy and
Development, vol. 14, pp. 285-292.
Akarca, A.T. and Long II, T.V. (1980), “On the Relationship between Energy and GNP:
A reexamination,” Journal of Energy and Development, vol.5, pp. 326-331.
Al-Iriani, M.A. (2006), “Energy-GDP Relationship Revisited: An Example from GCC Countries using Panel Causality,” vol. 34, pp. 3342-3350.
Holz-Eakin, D., Newey, W. and Rosen, H. (1988), “Estimating Vector Autoregressions
with Panel Data,” Econometrica, vol. 56, pp. 1731-1395.
Im, K. S., Pesaran, M. H., and Y. Shin (2003), “Testing for Unit Roots in Heterogeneous
Panels,” Journal of Econometrics, vol. 115, pp. 53–74.
Kraft, J. and A. Kraft (1978), “On the Relationship between Energy and GNP,” Journal
of Energy and Development, vol. 3, pp. 401-403.
Lee, C-C (2005), “Energy consumption and GDP in developing countries: A cointegrated
panel analysis,” Energy Economics, vol. 27, pp. 415-427.
Masih, M. M and R. Masih (1997), “On the Temporal Causal Relationship between Energy Consumption, Real Income and Prices: Some New Evidence from Asian-energy Dependent NICs based on Multivariate Cointegration/Vector Error Correction
Approach,” Journal of Policy Modeling, vol. 19, pp. 417-440.
Levin, A., Lin, C. F., and C. Chu (2002), “Unit Root Tests in Panel Data: Asymptotic and
Finite-Sample Properties,” Journal of Econometrics, vol. 108, pp. 1–24.
Maddala, G. S. and S. Wu (1999), “A Comparative Study of Unit Root Tests with Panel
Data and A New Simple Test,” Oxford Bulletin of Economics and Statistics, vol. 61, pp.
631–52.
Mahadevan, R. and Asafu-Adjaye, J. (2007), “Energy consumption, economic growth and prices: A reassessment using panel VECM for developed and developing countries,”
Energy Policy, vol. 35, pp. 2481-2490.
Pedroni, P. (1999) “Critical Values for Cointegration Tests for Heterogeneous Panel with
Multiple Regressors” Oxford Bulletin of Economics and Statistics, vol. 61, pp. 653-70.
Pedroni, P (2004) “Panel Cointegration: Asymptotic and Finite Sample Properties of
Pooled Time Series Tests with an Application to the PPP Hypothesis” Econometric
Soytas, U. and Sari, R. (2003), “Energy Consumption and GDP: Causality Relationship
Table 1. Panel unit root tests for gdp
Test type Test statistic Probability
LLC 2.5598 0.9948
IPS 3.5493 0.9948
Fisher ADF 133.526 0.9927
Fisher PP 158.062 0.8302
Note: gdp stands for the natural logarithm of real per capita GDP in purchasing power
Table 2. Panel unit root tests for energy
Test statistic Test statistic Probability
LLC -1.1316 0.1289
IPS 1.1362 0.8721
Fisher ADF 153.894 0.8841
Fisher PP 177.885 0.4461
Note: energy stands for the natural logarithm of per capita energy consumption. LLC and
Table 3. Panel unit root tests for ∆gdp
Test type Test statistic Probability
LLC -18.9967 0.0000
IPS -19.5765 0.0000
Fisher ADF 766.630 0.0000
Fisher PP 1060.00 0.0000
Note: ∆gdp stands for the first difference of natural logarithm of real per capita GDP in
Table 4. Panel unit root tests for ∆energy
Test type Test statistic Probability
LLC -21.6111 0.0000
IPS -20.5191 0.0000
Fisher ADF 800.926 0.0000
Fisher PP 2120.16 0.0000
Note: ∆energy stands for the first difference of natural logarithm of per capita energy
Table 5. Pedroni’s panel cointegration tests for gdp and energy
Test type Test statistic Probability
Panel PP -2.7793 0.0084
Panel ADF 2.8356 0.0072
Note: gdp and energy stand for the per capita constant GDP in purchasing power terms
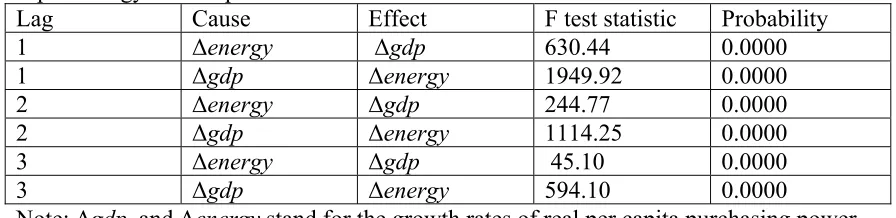
Table 6. Short run causality tests between the growth rates of real per capita GDP and per capita energy consumption
Lag Cause Effect F test statistic Probability
1 ∆energy ∆gdp 630.44 0.0000
1 ∆gdp ∆energy 1949.92 0.0000
2 ∆energy ∆gdp 244.77 0.0000
2 ∆gdp ∆energy 1114.25 0.0000
3 ∆energy ∆gdp 45.10 0.0000
3 ∆gdp ∆energy 594.10 0.0000
Note: ∆gdp and ∆energy stand for the growth rates of real per capita purchasing power
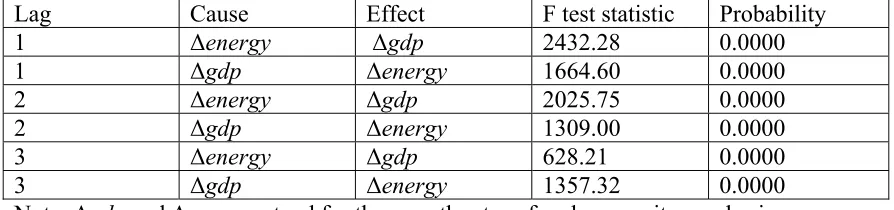
Table 7. Long run causality tests between the growth rates of real per capita GDP and per capita energy consumption
Lag Cause Effect F test statistic Probability
1 ∆energy ∆gdp 2432.28 0.0000
1 ∆gdp ∆energy 1664.60 0.0000
2 ∆energy ∆gdp 2025.75 0.0000
2 ∆gdp ∆energy 1309.00 0.0000
3 ∆energy ∆gdp 628.21 0.0000
3 ∆gdp ∆energy 1357.32 0.0000
Note: ∆gdp and ∆energy stand for the growth rates of real per capita purchasing power
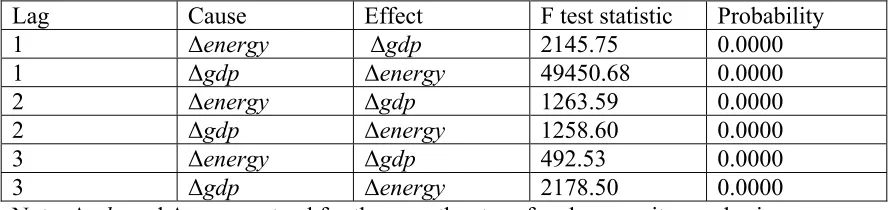
Table 8. Joint short/long (strong Granger) causality tests between the growth rates of real per capita GDP and per capita energy consumption
Lag Cause Effect F test statistic Probability
1 ∆energy ∆gdp 2145.75 0.0000
1 ∆gdp ∆energy 49450.68 0.0000
2 ∆energy ∆gdp 1263.59 0.0000
2 ∆gdp ∆energy 1258.60 0.0000
3 ∆energy ∆gdp 492.53 0.0000
3 ∆gdp ∆energy 2178.50 0.0000
Note: ∆gdp and ∆energy stand for the growth rates of real per capita purchasing power