http://dx.doi.org/10.4236/ijg.2013.49126
Using Capillary Pressure Derived Parameters for
Improving Permeability Prediction
Amir Maher S. Lala
Geophysics Department, Faculty of Science, Ain Shams University, Cairo, Egypt Email: [email protected]
Received May 6, 2013; revised June 8, 2013; accepted July 5, 2013
Copyright © 2013 Amir Maher S. Lala. This is an open access article distributed under the Creative Commons Attribution License, which permits unrestricted use, distribution, and reproduction in any medium, provided the original work is properly cited.
ABSTRACT
This paper presents the construction and verification of a new better semi-analytical, statistically derived universal model than that modified from Huet and Blasingame equation for estimating absolute permeability from mercury injec- tion capillary pressure data. The foundation of my new model is the petrophysical relation between absolute permeabil- ity and capillary-pressure/wetting phase saturation properties. I also incorporate characteristics of capillary pressure behavior using the classic Brooks-Corey power-law model. The final form of my new proposed model allowed us to predict absolute permeability as a function of effective porosity, irreducible wetting phase saturation, displacement or threshold pressure corresponding pore throat radius, and basic pore size characteristics. I built my model using 189 sets of mercury—injection (Hg-air) capillary pressure data and measured permeability-including core samples from several reservoirs both carbonate and sandstone lithologies. I identified this correlation by quantifying its accuracy and preci- sion based on regression analysis. I compared permeability estimates obtained from Huet and Blasingame mercury-in- jection capillary-pressure-based model and my new universal predicted permeability model to a set of laboratory meas- ured permeability of my studied core sample and previously published data results respectively, where I quantified the method’s accuracy and precision based on error analysis. The measured permeability samples range is from 0.003 mD to 5341 mD. I review current employed models that are classified as belonging to Poiseuille model.
Keywords: Capillary Pressure; Permeability; Poiseuille Model
1. Introduction
As I noted earlier the majority of permeability estimates obtained from capillary pressure curves are derived from two fundamental theories, percolation length models and poiseuille models. Poiseuille theory attempts to treat the flow paths of rocks as a bundle of tubes with various pore diameters. The complexity of a rock system doesn’t necessarily lend itself to the bundle of tubes model. However, many authors have introduced the scaling fac- tors into poiseuille theory that treats variable pore throat distributions and tourtousity as calibration constants.
The primary distinction between percolation and poi- seuille models for permeability is that for the poiseuille application, the flow paths within the reservoir rock are mathematically formulated (exactly), and the random na- ture of the rock is reconciled by introducing experimen- tally derived tuning factors.
All the models for permeability estimation use the simple relationship between Hg-air capillary pressure
(Pc), interfacial tension σHg-air, contact angle θHg-air, and
pore throat entry radius (R) first proposed by Washburn in 1921 [1];
Hg air
Hg air
2 0.417 cos 1 c
R P (1)
where: R = pore throat radius in μm;
σHg-air = interfacial tension between mercury and air in
dyn/cm;
θHg-air = contact angle between mercury and air in de-
grees (typically 140 degrees);
Pc = capillary pressure between the Hg and air phases
in Psia.
sure for a variety of rock types. Nelson [2] has developed a comprehensive review of the literature, and he has identified five major categories of permeability models based on the physical rock attributes used in the model development: the five major model categories specified by Nelson are:
1) petrophysical model, 2) models based on grain size and mineralogy, 3) models based on surface area and water saturation, 4) well log models, and 5) models based on basic rock pore dimensions.
In this paper, I focus on models that incorporate basic rock pore characteristics and dimensions, and specifically pore characteristics as determined from capillary pres- sure data. Nelson has further classified these particular models as direct types, since they not only relate rock permeability directly to the pore dimensions and connec- tivity, but also incorporate fundamental theories of fluid flow through porous media. Most of these direct methods, especially the early models, were developed in the 1940s and 1950s-use mercury-injection capillary pressure data to quantify the rock pore and pore throat characteristics.
Although the physical basis for the existing direct models is similar, I have observed varying results (even inconsistent) among the various theoretical models. The primary motivation for my work is to “close the loop” on relating mercury injection capillary pressure data and the simplified “bundle of tubes” permeability power law model by Brook and Corey, and is extended to incorpo- rate the permeability model proposed by Huet-Blsingame [3] using the theory of Purcell [4] and Burdine [5], com- bined with the function fitting parameters of Brooks and corey [6] and Nakornthap and Evans [7] to determine the absolute permeability from MICP.
Consequently, the principle objective of this work is to develop and document a universal model which provides a more consistent correlation of permeability with mer- cury capillary pressure data for a much wider range of rock types. I begin with a review of the most important models developed previously and I then document the validation of our generalization of the Huet and Blasi- game K (Hg) model.
2. Material and Methods
Methods Derived from Poiseuille Theory
1) Brooks and Corey’s λ(1966)
Pore-throat size distribution is an important property of porous media. It affects both permeability and capil- lary pressure. Several variables have been proposed to quantify this property (Archie, 1950 [8], Jennings, 1987 [9], Thomeer, 1960 & 1983 [10,11], Brooks and Corey, 1966 [6]). Among these variables, Brooks and Corey’s λ (1966) and Thomeer’s Fg (1960, 1983) are the most popular.
Brooks and Corey (1966) found that drainage capil- lary-pressure curves can be approximated by a power- law relationship:
* for
c d c d
S P P P P (2) where S* is normalized, wetting-phase saturation, called
“effective saturation”, which is expressed as:
* 1
w wir wir
S S S S (3)
where Swiris irreducible water saturation.
The λ in Equation (2) is called “pore-size distribution index”. It controls the slope of a capillary pressure curve. Larger λ values usually have gentle curves, while smaller λ values usually have steeper curves. The λ typically is obtained by fitting the experimental data with the least- squares technique. It is the negative slope of the points on a log-log plot of S* vs. J-function. The J function
needed to calculate λ is a dimensionless number origin- nally developed by Leverett (1941) [12].
To synthesize capillary pressure curves with Equation (2), λ must be estimated. The λ is measured directly from the best-fit line drawn through the data points on a log-log plot of S*vs. J-function. The negative slope of
the fitted line is λ. According to Brooks and Corey (1966) [6], porous media having narrow pore-throat size distri- butions (well sorted) tend to have large values of λ, while porous media having wide pore-throat size distributions (poorly-sorted) tend to have small values of λ. If this as- sumption is correct, then λ should be correlated with other variables, such as permeability and irreducible wa- ter saturation, since these variables are sensitive to pore- throat distribution. A plot of Brooks and Corey’s original
data shows no relationship between λ and these two
variables.
2) Huet-Blasingame Method (2005):
Huet-Blasingame [3] use the underlying theory of Pur- cell and Burdine, combined with the function fitting pa- rameters of Brooks and Corey and Nakornthap and Ev- ans to determine the absolute or Klinkenberg-corrected permeability from MICP [13]. Their dataset includes a variety of rock types spanning a wide range of perme- ability (0.0041 - 8340 mD) and porosity (0.003 - 0.34). The Huet-Blasingame implementation requires first that the capillary pressure curve be modeled according to the power law relationship of Brooks and Corey Equation (1) Huet and Blasingame use the terms “displacement pres- sure” and “threshold pressure” interchangeably, although the physical meanings of each have been specifically defined by Pittman. Displacement pressure is the pres- sure at which mercury first enters the sample, regardless of its interconnectivity.
taken to ensure a conformance correction is taken into consideration which discounts any “apparent” intrusion of mercury into the sample due to surface vugs and/or irregularities. For clarity, the threshold pressure as first defined by Katz and Thompson (1986 & 1987) [15,16] and further illustrated by Pittman (1992) [17] is defined as the pressure at which mercury first forms a connected filament across the span of the sample. The threshold pressure corresponded graphically to the inflection point on a mercury injection plot.
Huet-Blasingame further related permeability to the curve fitting parameters of Equation (1) by:
1.6575 H B
0. 1.78
5475 46
1.6498
2
81718.8669 1
10 0
d
wi
K P
S
(4)
My intension was to qualify the performance of Huet and Blasingame method using the log-log correlation plot-specifically, the perfect correlation (i.e., the 1:1 trend) as well as the 2.5 factor trends. I used this enve- lope to assess goodness of fit between the measured per- meability and calculated one from the used permeability model.
My data set is comprised of 202 whole core plug sam- ples representing sand and limestone formation from different basins within the Egypt. The range of porosity and permeability is 1.8 to 39.9 percent and 0.003 to 5341 MD, respectively. The diverse composition and the va- riable texture of the sandstones suggest this should be a representative sample set for reservoirs. A graphical and statistical analysis system multiple regression pro- gram was used to establish various empirical relation- ships.
3. Results and Discussion
1) Correlation of different petrophysical parame- ters
My initial calibration process was performed to esti- mate the displacement and critical capillary pressure (Pd),
[image:3.595.308.538.83.307.2]irreducible wetting phase saturation, the index of pore size distribution (λ), effective porosity, Winland (R35) and calculating the permeability value on a sample by sample basis using the Huet and Blasingame and Brooks- Corey Pc (Sw) model.
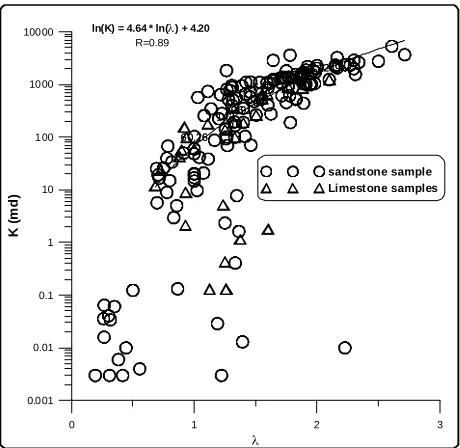
Figure 1 shows the directly relationship between per-
meability and estimated Pore geometry index (λ) of
Brook and Corey’s method. The directly relationship indicates wide spectrum of pore throat size distribution (poor sorting) at low values of λ thus the rock will obtain low permeability values which are also function of pore throat size distribution and vice versa. The Brook and corey’s method provides its best correlation to sample measured permeability above 0.1 md. However, for sam- ples data below 0.1 md, the points become scattered and
0 1 2 3
0.001 0.01 0.1 1 10 100 1000 10000
K(
m
d
)
1010
101 265 142
60.26 191
1249 906
196 541
sandstone sample Limestone samples 1010
101 265 142
60.26 191
1249 906
196 541
ln(K) = 4.64 * ln() + 4.20
R=0.89
Figure 1. The relationship between pore geometry index and permeability for the all studied samples.
correlation turn very weak. The Brook and Corey’s me- thod suffers up to an order of magnitude of error and suggest, at least for this case, that the Brook and Corey’s method may not be applicable. Our defends using this wide permeability range despite the fact that the original equation of Brook and Corey is not tailored specifically for low permeability rocks because of the inherent un- certainties at the time of accurately measuring perme- ability below 0.1 md. This indicates that the two pa- rameter are affected more by macro porosity than micro porosity
I present my results as log-log crossplots of calculated permeability using Huet and Blasingame versus meas- ured permeability in Figures 2 and 3 where the dis- placement pressure used for Huet and Blasingame method is estimated using Schowlter and Katz- Thampson assumptions respectively. For guidance high and low dashed trend line which represent a variance factor of 2.5. The graph provides a visual orientation as to the accuracy of permeability estimation method. Data points which lie within the envelope are considered as an
acceptable match. Using the Katz and Thampson (Pd)
0.001 0.01 0.1 1 10 100 1000 10000 100000 K (measured)
0.001 0.01 0.1 1 10 100 1000 10000 100000 1000000
K
(c
al
c
lu
at
ed
)
Sandstone samples Limestone samples R=0.95
[image:4.595.57.288.85.297.2]ln(KH-B) = 0.93 * ln(Kmeas) + 3.92
Figure 2. Comparison between calculated (Kc) and meas- ured (Km) permeability. The upper and lower dashed lines represent the range of 0.25 < Kc/Km < 4 (Calculated from Huet and Blasingame, 2005).
0.001 0.01 0.1 1 10 100 1000 10000 100000
K (measured) 0.001
0.01 0.1 1 10 100 1000 10000 100000
K
(c
al
cl
u
at
ed
)
Sandstone samples Limestone samples R=0.95
ln(KH-B) = 0.93 * ln(Kmeas) + 1.43
Figure 3. Comparison of the MICP-based permeability es- timated using Huet-Blasingame method to themeasured (Km) permeability. The upper and lower dashed lines rep- resent the range of 0.25 < Kc/Km < 4 (Calculated from Huet and Blasingame, 2005).
assumption will affect on the accuracy of the Huet and Blasingame and overestimate the absolute permeability using MICP measurement—obviously because of gas slip- page effects. The Katz-Thampson (Pd) yields good pre-
cision of the results for permeabilities above 2 md and below 0.7 md, but the method has poor accuracy between these values. This performance in Huet and Blasingame
model may be due to interpretation in fitting the capillary pressure curve, as well as the fact that Huet-Blasingame used a data set which was not optimally populated (our data set contained a very large variation in sample per- meabilities). It is clear that additional work is required to improve both the accuracy and precision of this method for estimating permeability using MICP tests on core samples.
Overall, the accuracy and precision of the mercury in- jection, capillary pressure based permeability correla- tions were lower than expected. Perhaps this perform- ance could be due to our data sets employed in this study, but that seems less likely than the probability of issues with the method itself.
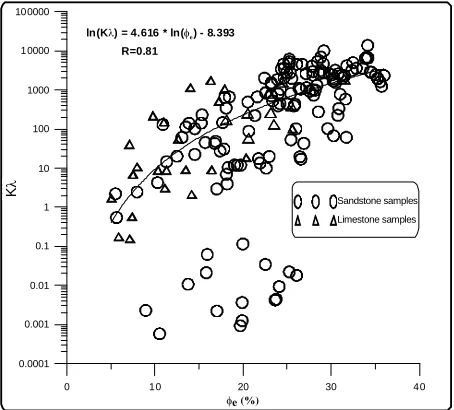
Figure 4 illustrates the relationship between measured permeability multiplied by pore geometry index versus effective porosity for all studied samples. The correlation indicates better precision above 0.1 md with good accu- racy. Below this (Kλ) limit value the correlation lacks accuracy, which may account for the strong correlation between permeability and effective porosity and between pore geometry index and macro pore throat radius. Whereas, the scattering of data points below 0.1 md in- dicates significant degree of samples pore throat size he- terogeneity and so weak correlation of λ.
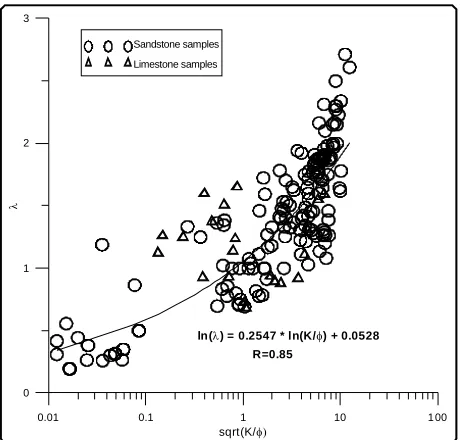
[image:4.595.57.289.357.577.2]Figure 5 shows the relationship between pore geome- try indexes versus the sqrt (K/φ) for our studied samples. As pore geometry index is a measure of degree of pore sorting it shows positive strong correlation, increasing λ values will increase the homogeneity of pore throat ra- dius values and so will sqrt (K/φ) values.
Figure 6 indicates the weak negative correlation be- tween pore geometry index and irreducible water satura- tion estimated from capillary pressure curves of our
0 10 20 30 40
e (%) 0.0001
0.001 0.01 0.1 1 10 100 1000 10000 100000
K
ln(K) = 4.616 * ln(e) - 8.393
R=0.81
K
λ
Sandstone samples
Limestone samples
[image:4.595.310.537.502.707.2]0.01 0.1 1 10 1 00 sqrt(K/
0 1 2 3
ln() = 0.2547 * ln(K/) + 0.0528 R=0.85
Sandstone samples
[image:5.595.58.288.84.304.2]Limestone samples
Figure 5. The relationship between pore geometry index and sqrt (K/φ) for all studied samples.
0 0.04 0.08 0.1 2 0.16 0.2
SWi
0 1 2 3
P
o
re
ge
om
e
tr
y
ind
e
x
(
Sandstone samples
[image:5.595.59.287.344.553.2]Limestone samples
Figure 6. The relationship between pore geometry index versus irreducible water saturation for the all studied sam- ples.
studied core samples. The weak relation may be caused by the presence of other factors which has more affect on pore geometry index like permeability and pore throat. The inversely relationship because porous media having narrow pore throat size distributions (well sorted ) tend to have large values of λ and vice versa. So, λ should be correlated with irreducible water saturation since both are sensitive to pore throat distribution. But it seems thatλ is mostly affected and measure macro pore sorting so will result relatively weak inversely correlation with Swi
which is affected by presence of micro pores in the stud-
ied rock samples.
The permeability versus porosity time pore geometry index square (φλ2) for all studied samples are presented
in Figure 7. The correlation performs quiet well above K value of 0.1 md with high correlation coefficient. The correlation become worse below this K value indicate that λ is a more function of macro porosity which give greater contribution to fluid flow, thus improve the rela- tionship between K andφ.
The relationship between kλ and φ R35 values for our
studied core samples are plotted in Figure 8. Visual in- spection of this figure shows that the samples points are described very well by the best fit line with high regres- sion coefficient determined for all the samples. This im- plies that within the limits of our data, it is reasonable with our obtained model to estimate the permeability of the reservoir. Because pore throat radius R35 and λ are
closely related to macropores and quantifies the largest and best connected pore throats which mostly affect on reservoir fluid flow (permeability).
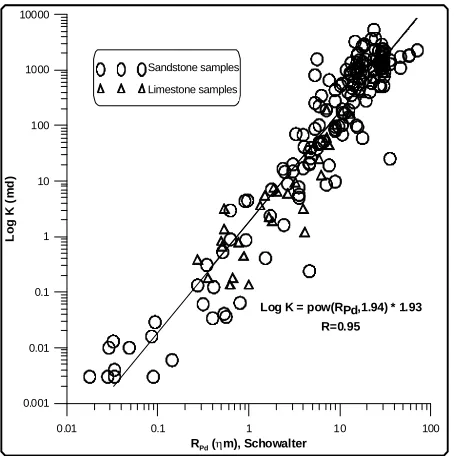
Figures 9 and 10 show the relationship between meas- ured permeability versus pore throat radius estimated using schowlter and Katz and Thompson assumptions respectively. These figures show directly strong correla- tion with high correlation coefficient where R = 0.95. So, my data samples prove that, I can use the terms dis- placement pressure and threshold pressure interchangea- bly, although the physical meaning of each have been specifically defined by Pittman (1992). The strong corre- lations illustrate the forms of a connected filament across the span of the sample at these pore throat radiuses of our studied data set.
0 50 100 150 200 250
(Phi)(lamda)2 0.001
0.01 0.1 1 10 100 1000 10000
K(
m
d
)
K = 16.1 *- 215
R = 0.89 Sandstone samples
Limestone samples
0.1 1 10 100 1000 10000 (R35.
0.0001 0.001 0.01 0.1 1 10 100 1000 10000 100000
(K
.
ln(K.) = 1.714 * ln(R35.) - 3.171 R=0.954 Sandstone samples
[image:6.595.58.286.83.311.2]Limestone samples
Figure 8. The relationship between (Kλ) and (R35.φ) for all studied samples.
0.01 0.1 1 10 100
RPd(m), Schowalter
0.001 0.01 0.1 1 10 100 1000 10000
Lo
g
K
(m
d)
Log K = pow(RPd,1.94) * 1.93 R=0.95 Sandstone samples
Limestone samples
Figure 9. The relationship between estimated pore throat radius versus permeability (Schowalter, 1979).
2) Development of new modified model
Using the relation of Huet and Blasingame I develop a base model to correlate permeability from capillary pres- sure data. The constants a1, a2, a3, a5 and a6 of our new general permeability equation can be determined through the use of calibration data set of cores and capillary pressure data. Here after, that Quantity will be referred to as the kernel. The coefficients a1, a2, a3, a5 and a6 should be adjusted to minimize the error in the prediction of K. The estimation of a1, a2, a3, a5 and a6 can be
0.01 0.1 1 10 100
RPd(PSIA), Katz
0.001 0.01 0.1 1 10 100 1000 10000
Lo
g
K
(m
d)
LogK = pow(RPd,1.98) * 1.39 R=0.95 Sandstone samples
[image:6.595.309.537.85.312.2]Limestone samples
Figure 10. The relationship between estimated pore throat radius versus permeability for all studied samples, (Katz and Thompson, 1987).
accomplished by fitting the data with an equation having the form of:
nY C X (5)
Y values associated with permeability, X values asso- ciated with the kernel.
The constants C and n are determined through least square minimization or other suitable error minimization technique.
Providing measured porosity, fractional bulk volume occupied by non-wetting phase in the formation material at pressure Pc, infinite pressure Vb (P∞), pore size distri-
bution index and displacement pressure derived from capillary pressure measurements of a formation material from a laboratory capillary pressure measured curves on core samples. Using the said parameters in empirically derived equation to predict permeability;
Log a1 a2 log a3log 2 a4log 100 a5log
d
wi P S
(6)
Here after refereed to as the kernel.
Determining the coefficients a1, a2, a3, a4 and a5 by use of a suitable minimization technique; using a1, a2, a3, a4 and a5 in the Equation (6) so,
a3
a4 a5 a2K a1* Pd * 2 * 100Swi * (7)
for determining permeability from measured capillary pressure curves.
[image:6.595.60.287.349.577.2]the kernel and y is permeability. Thus,
Th-Ka ( t )z
LogK log29.45 1.828 log .00
0
591 log 2
15.36 log 100
og2.3 l .
d
wi
P
S
(8)
where, r = 0.952
Schow ( l et r)
LogK log23.501 1.801 log .00
0
73 log 2
12.528 log 100
2.074 log .
d
wi
P
S
(9)
where, r = 0.964
The two equations indicate slightly improvement of correlation coefficient (r) with change of the used dis- placement pressure deriving assumptions from Thampson- Katz [18] to Schowlter.
The most significant contribution of this work will be presentation of the two Equations (8) & (9) as these rela- tions clearly verify that permeability should be a power law function of displacement pressure, irreducible wet- ting phase saturation and porosity. While, involving of effective porosity variable of my measured data samples set in the correlation doesn’t make any enhancement for the regression coefficient of my model.
Furthermore, I have built a new model using samples from both sandstone and carbonate covering a wide range of lithology. Thus, I postulate that new general permeability predication equations might holds for different lithology and fluid systems.
3) Validation of the new permeability universal mo- del
Measured permeabilities and capillary pressure de- rived petrophysical properties from Caballos Formation, San Francisco, Colombia and Stevens sandstone samples, Yowlumne and Paloma Fields, Kern County, California (Wu, 2004) [18], were used to test the new regression model for verification of the permeability predication.
[image:7.595.309.538.83.304.2]My calibration process was performed to estimate the permeability on a sample by sample basis using the new universal regression model from the given data set of ste- vens sandstone samples.
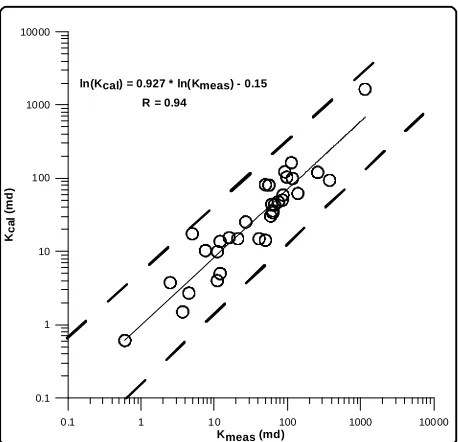
Figure 11 shows the permeability calculated from my new universal model versus the measured permeability. All of the predicted permeability values fall into the ac- ceptable range 0.25 < Kc/Km < 4, where Kc and Km are calculated and measured permeabilities, respectively. This range is considered acceptable because Bradley et al. (1972) [19,20] pointed out that closely spaced permeabil- ity measurements in core analysis can vary up to four times and still be considered accurate estimates. The co- efficient of correlation (R) = 0.94 indicates the presence of high correlation. Thus, I postulate that a general equa- tion holds for different lithology and fluid systems.
0.1 1 10 100 1000 10000
Kmeas (md) 0.1
1 10 100 1000 10000
Kca
l
(m
d
)
ln(Kcal) = 0.927 * ln(Kmeas) - 0.15 R = 0.94
Figure 11. Comparison between MICP based permeability estimated using the new model to the measured Caballos and Stevens permeability.
4. Conclusions
My data set emphasizes and verifies the assumption of the function fitting parameter of Brooks and Corey’s (λ) and its relation to pore throat size distribution porosity and permeability. The model given by Brooks and Corey is robust and suitable for this work.
Pore geometry index shows good relationship between porosity and permeability and control fluid movement in the pores of rocks, which makes it easy to predict and widen the application of our new modified Huet and Blasingame model.
The strong correlation between pore throat radius of Schowlter and Katz-Thompson versus permeability is caused by forming of a connected filament across the span of the sample at these pressures. The permeability K can be successfully correlated to the effective porosity, capillary displacement and critical pressures correspond- ing pore throat radius, irreducible wetting phase satura- tion, and the index of pore size distribution using a theo- retically defined power law correlation model.
KH-B method has been formulated in such a way that
allows the capillary pressure data to be incorporated as a variable using the Brooks-Corey methodology. Given that the entire pore throat distribution is considered dur-
ing the Huet-Blasingame approach, the KH-B value is
Huet and Blasingame used data set which was not op- timally populated. I recognize that the method was not derived for rock permeabilities less than 0.1 md. The model can be relatively insensitive to the different com- bination of the Pd, Swi and λ parameters while my pre-
sent study widens the permeability range to less than 0.1 md. This is an issue that is most likely related to the quality and character of the capillary pressure data.
The building of my model suggests that the correlating properties of the porous media (k, φ, Swi, Pd, and λ) are
not specifically dependent upon lithology but rather, these properties uniquely quantify the fluid flow behavior of the porous medium.
My new model takes into consideration issues relevant to low and very low permeability reservoirs (very com- plex flow paths, micro/nano-porosity, etc.).
General equation for accurate predications of perme- ability produced from measured capillary pressure curve is possible in spite of sample rocks lithology type.
R35 is of better correlation than pore geometry index with permeability because λ expresses the complete spec- trum of effective pore throat radius.
The calculated permeabilities from the new universal empirical model agree well with measurements.
REFERENCES
[1] E. W. Washburn, “The Dynamic of Capillary Flow,”
Physical Review, Vol. 17, No. 3, 1921, p. 273.
[2] P. H. Nelson, “Permeability-Porosity Relationships in Se- dimentary Rock,” The Log Analyst, May-June 1994, pp. 38-62.
[3] C. C. Huet, J. A. Rushing, K. E. Newsham and T. A. Blasingame, “A Modified Purcell/Burdine Model for Es- timating Absolute Permeability from Mercury Injection Capillary Pressure Data,” Paper IPTC 10994 Presented
at the 2005 International Technology Conference, Doha,
21-23 November 2005, 12 p.
[4] W. R. Purcell, “Capillary Pressure—Their Measurement Using Mercury and the Calculation of Permeability There Form,” Transaction of AIME, Vol. 1, No. 2, 1949, pp. 39-48.
[5] N. T. Burdine, “Relative Permeability Calculations from Pore Size Distribution Data,” Transaction of AIME, Vol. 5, No. 3, 1953, pp. 71-78.
[6] R. H. Brooks and A. T. Corey, “Properties of Porous Media Affecting Fluid Flow,” Journal of Irrigation and
Drainage Engineering (ASCE), Vol. 92, No. 2, 1966, pp.
61-88.
[7] K. Nakornthap and R. D. Evans, “Temperature Depend-
ant Relative Permeability and Its Effect on Oil Displace- ment by Thermal Methods,” Society of Petroleum Engi-
neers, Vol. 1, 1986, pp. 230-242.
[8] G. E. Archie, “Introduction to Petrophysics of Reservoir Rocks,” AAPG Bulletin, Vol. 34, No. 5, 1950, pp. 943- 961.
[9] J. B. Jennings, “Capillary Pressure Techniques: Applica- tion to Exploration and Development Geology,” The
American Association of Petroleum Geologist Bulletin,
Vol. 71, No. 10, 1987, pp. 1196-1209.
[10] J. H. M. Thomeer, “Introduction of a Pore Geometrical Factor Defined by a Capillary Pressure Curve,” Transac-
tion of AIME, Vol. 219, No. 2057, 1960, pp. 354-358.
[11] J. H. M. Thomeer, “Air Permeability as a Function of Three Pore Network Parameters,” Journal of Petroleum
Technology, Vol. 35, No. 4, 1983, pp. 809-814.
[12] M. C. Leverett, “Capillary Behavior in Porous Solids,”
Transaction of AIME, Vol. 142, No. 1, 1941, pp. 341-358.
[13] L. J. Klinkenberg, “The Permeability of Porous Media to Liquids and Gases,” American Petroleum Institute, Drill- ing and Productions Practices, 1941, pp. 200-213. [14] T. T. Schowalter, “Mechanics of Secondary Hydrocarbon
Migration and Entrapment,” The American Association of
Petroleum Geologist Bulletin, Vol. 63, No. 5, 1979, pp.
723-760.
[15] A. J. Katz and A. H. Thompson, “Quantitative Prediction of Permeability in Porous Rock,” Physical Review B, Vol. 34, No. 11, 1986, pp. 8179-8181.
[16] A. J. Katz and A. H. Thompson, “Prediction of Rock Elec- trical Conductivity from Mercury Injection Measure- ments,” Journal of Geophysical Research, Vol. 92, No. B1, 1987, pp. 599-607.
[17] E. D. Pittman, “Relationship of Porosity and Permeability to Various Parameters Derived from Mercury Injection- Capillary Pressure Curve for Sandstone,” The American
Association of Petroleum Geologist Bulletin, Vol. 76, No.
2, 1992, pp. 191-198.
[18] A. H. Thompson, A. J. Katz and R. A. Raschke, “Estima- tion of Absolute Permeability from Capillary Pressure Measurements,” Paper SPE 16794 Presented at the 1987
SPE Annual Technical Conference and Exhibition, Dallas,
27-30 September 1987, 7 p.
[19] T. Wu, “Permeability Predication and Capillary Pressure Simulation Sandstone Reservoir,” Ph.D. Thesis, Texas A&M University, College Station, 2004.
[20] J. S. Bradley, R. W. Duschatko and H. H. Hinch, “Pocket Permeameter: Hand-Held Device for Rapid Measurement of Permeability,” The American Association of Petroleum