Munich Personal RePEc Archive
Trade transparency and trading volume:
the possible impact of the financial
instruments markets directive on the
trading volume of EU equity markets
Avgouleas, Emilios and Degiannakis, Stavros
School of Law, University of Manchester, Williamson Building,
Oxford Road, Manchester, M11 9PL, UK, Department of Statistics,
Athens University of Economics and Business, 76 Patision Street,
GR 104-34, Athens, Greece
2009
Online at
https://mpra.ub.uni-muenchen.de/96306/
T r a d e T r a n s p a r e n c y a n d T r a d i n g V o l u m e : T h e
P o s s i b l e I m p a c t o f t h e F i n a n c i a l I n s t r u m e n t s
M a r k e t s D i r e c t i v e o n t h e T r a d i n g V o l u m e o f E U
E q u i t y M a r k e t s
Dr Emilios Avgouleas
School of Law, University of Manchester, Williamson Building, Oxford Road, Manchester, M11 9PL, UK.
E-mail:
emilios.avgouleas@manchester.ac.uk
Dr Stavros Degiannakis Department of Statistics,
Athens University of Economics and Business, 76 Patision Street, GR 104-34, Athens, Greece
E-mail: Stavros.degiannakis@gmail.com
Abstract: The EC Directive on Financial Instruments Markets 2004 (MiFID) has introduced a number of order and trade publication obligations imposed on organized exchanges, Alternative Trading Systems (ATS), and the class of broker dealers that
execute transactions in shares internally. This article investigates the impact of MiFID’s
trade transparency rules on the trading volume of EU equity markets in a forward-looking mode. We use data extracted from the closest possible precedent and examine trading volume levels before and after trading in FTSE100 stocks on the London Stock Exchange (LSE) shifted from the quote-driven Stock Exchange Automatic Quotation System (SEAQ) to the order-driven Securities Electronic Trading Service (SETS). This change resulted in significantly increased transparency standards. Trading volume is measured on the basis of three criteria: volume-based turnover, value-based turnover and turnover ratio. No evidence is found indicating that higher transparency standards lead per se to
higher levels of trading volume. Therefore, the impact of MiFID’s transparency rules on
trading volume in EU equity markets should become a matter of further study following their implementation.
JEL: C14, C22, G18, G28, K22.
Keywords: Trading Volume, London Stock Exchange, MiFID, MTFs, Transparency, Regulated Markets, SEAQ, SETS, Systematic Internalisers.
1 . I n t r o d u c t i o n
The EC Directive on Financial Instruments Markets (MiFID)1 introduces a number of
order and trade publication requirements imposed on organized exchanges, called in the
Directive regulated markets, qualifying ATSs, called in the Directive Multilateral Trading
Facilities (MTFs), and broker dealers that execute internally transactions in shares
admitted to trading on an organized market in the EU on an organized and systematic
basis, called in the Directive systematic internalisers. These raise significantly the levels
of transparency of EU equity markets. This article explores the possible impact of
MiFID’s rules on trading volume in EU equity markets as a guide for EU policy-making in this area taking also into account the findings of finance and regulation literature on
market microstructure.2 The mere existence of an efficient price discovery mechanism is
in itself insufficient if investors want to transact at efficient prices; in other words:
‘[e]fficient prices, after all, are unimportant if one can transact only a 100-share lot at
these prices’.3
Thus, the actual impact of MiFID’s transparency rules on trading volume
in EU equity markets will have direct influence on the efficient operation of these
markets.
Keynes has suggested that the degree of liquidity of an asset can be measured on
the basis of: (a) the riskiness of its final value (ability to realise the asset’s value) and (b)
the availability of the market to readily absorb the sale of the asset without any serious
downward pressure on the price of the asset. The absorptive capacity of the market has
been used by certain authors as a measure of liquidity4 and is to a certain extent
dependent on prevailing levels of trading volume. Another criterion for measuring
liquidity is the depth of the bid/offer spread in quote driven markets and the difference
The authors would like to thank Professors Yakov Amihud of the Stern Business School, New York
University and Nick Travlos, Dean of the Athens Laboratory of Business for their critical comments on earlier versions of this paper.
1
Directive 2004/39/EC of 21 April 2004 on markets in financial instruments, OJ L 145/1.
2
For an overview see Mahoney (2003), O’Hara (1999), Glosten and Milgrom (1985) and Kini and Mian
(1995).
3
Madhavan et al. (2001).
4
between the best buy and sell limit orders in order driven markets.5 This article does not
purport to measure the liquidity impact of MiFID on EU equity markets but rather to
examine its possible effect on trading volume, which, in turn may have a significant
bearing on prevailing levels of liquidity. In order to measure trading volume we use three
criteria: volume-based turnover, value-based turnover and turnover ratio.
Since MiFID has not yet been implemented in EU Member States, we examine
the shift of the LSE from SEAQ to SETS on 20 October 1997 to draw tentative
conclusions on MiFID’s predicted impact on trading volume. The examined period
extends from 22 October 1992 to 18 October 2002. The data set comprises the price, the
volume-based turnover and the number of ordinary shares in issue, on a daily basis, for
seventy stocks that remained in the FTSE100 index throughout the period under
investigation. Thirty stocks did not maintain a presence in the basket of FTSE 100 for the
entire post-SETS period. The data was obtained from DataStream©.
International financial markets witnessed during the examined period three very
important developments. The first development was the radical transformation of market
structure through the introduction of ATSs. The second development was the advent of
Internet trading, which allowed retail investors much higher levels of access to stock
trading. The third development was the stock market bubble of the late 1990s, which
increased trading volume in a rather non-linear and unexpected manner. If the impact of the
aforementioned market developments on trading volume is isolated, then there is no
evidence that the enhanced trade transparency standards, which followed the introduction
of SETS, increased the market’s absorptive capacity.
This article is divided in five sections. The first section is the present introduction.
The second section provides a brief discussion of the mechanics of market transparency and
its perceived impact on trading volume. The third section explains the new transparency
obligations that MiFID imposes on: (a) organized securities markets, (b) Multilateral
Trading Facilities, and (c) ‘systematic internalisers’. The fourth section examines the impact on trading volume of the LSE’s shift from a dealer market to an order-driven
5
Pagano (1996). For details about the benchmarks used to measure liquidity based on the bid/offer spread
see Amihud and Mendelson (1986), Cheung et al. (2003), Chordia et al. (2003), Fleming (2001), and Irvine
market. The fifth section brings the different strands of the present discussion to a
comprehensive conclusion.
2 . M a r k e t T r a n s p a r e n c y a n d M a r k e t W e l f a r e
2.1 Defining Market Transparency
A transparent market is a market that combines three elements: (a) constant flow of issuer
specific information, (b) disclosure of material interests in financial assets, and (c) pre- and
post-trade dissemination of information about orders and trades. The first two elements are
regulated by mandatory disclosure rules and their discussion falls outside the scope of this
article.
Price transparency means the public availability of information about superior
prices for the conclusion of certain trades specified as to their quantity. Trade transparency
means the public availability of information about current trading flows on the market in
terms of volume. As a market must be transparent before and after the conclusion of the
transaction, relevant rules regulate the level of both pre-trade and post-trade transparency.
Pre-trade transparency means the availability of data about the size and price of orders
flowing to the market, pending execution. Also information about the prices at which a
market maker is ready to buy and sell securities of a specified size (quote). Post-trade
transparency means the availability of information after the conclusion of a transaction,
especially information about the specific price, quantity, and time of the transaction.
Maximum post-trade transparency would comprise immediate publication of data about the
price and volume of each transaction, as well as the identification of the transacting
parties.6
Order-driven securities markets usually maintain a high level of invisibility of
pre-execution orders and price limits imposed on them, until the time of pre-execution. Dealer
markets have, usually, high levels of pre-trade transparency. Market makers on the LSE, for
instance, before the introduction of SETS, used to post their quotes on SEAQ screens, and
this ensured a high level of pre-execution price visibility. On the other hand, post-trade
transparency is considerably higher in order-driven markets, which, in general, publish
6
information about matched trades immediately. In dealer markets, delayed publication of
information about completed trades is the norm.7
2.2 The Welfare Effects of Market Transparency Rules
Because of the complexity of the price discovery mechanism market information is of
considerable value to those who may wish to trade in the near future. Market participants
may employ the so-called ‘trade’ and ‘price decoding’ techniques in order to deduce new
information from the posted quotes or incoming order flow, as well as from completed
trades.8Depending on the reliability of such information and investor’s technical expertise
and skill, wide availability of information improves the allocative efficiency of investor
trading. This is achieved because a more equitable distribution of actual and potential
trading profit opportunities between broker-dealers and market users (outside investors) is
ensured by restricting9 the ability of brokers and exchange members to front-run client
trades.
Furthermore, trade transparency rules are introduced as a means to ensure: (a) better
execution of client orders and (b) the reduction in the frequency of market abuse in the
form of insider dealing and market manipulation, as large trades or their source may,
eventually, be detected.10
Yet, the producers of trade information, namely, those who have just transacted,
cannot be compensated. Thus, the same public-collective good argument employed to
justify mandatory disclosure rules11 may also be used in the present context. Namely, it is
assumed that, in the absence of strict publication requirements, trade information would
remain under-supplied, favouring internalizing brokers and/or exchange members over
outside traders. In the absence, for instance, of rules that oblige broker/dealers to publish
investor limit orders on receipt, dealers can front-run client orders,12 or leave them to expire
in order to execute them from their books at a more advantageous price.
However, regulatory initiatives to increase market transparency standards usually
face strong opposition that is based on the following arguments:
7
Steil (1996, pp. 32-33).
8
Gilson and Kraakman (1984, pp. 573-575, 577-578).
9
See Mahoney (1997, pp. 1485-1486).
10
For the importance of market transparency in safeguarding the integrity of securities markets see Avgouleas (1998).
11
Coffee (1984) and Mahoney (1995, p.1047).
12
(a) If traders lose their ability to capture most of the value of information they have
acquired through hard effort they will cease searching for new information. This
development would harm the information efficiency of market prices;
(b) if traders cannot conceal their positions, until they have extracted the full value of
private information, increased transparency standards may cause an outflow of trades
from the market concerned. Large traders, in particular, can become very vulnerable. If
information about their trades becomes readily available, the market might turn against
their positions. Large traders might in response abstain from active trading;
(c) changes in a market’s transparency alter a trader’s ability to strategically reveal
orders. This results in increased transaction costs and reduced liquidity, because trades
are withdrawn to avoid revealing orders to ‘noise’ and other ‘parasitic’ traders;13
(d) a requirement of immediate publication of trade information may penalize market
makers, which are legally obliged to provide liquidity in the market for the relevant
financial asset.14 Therefore, trading volume seems to migrate from the very transparent
markets to those with lower pre- and post-trade transparency;
(e) it seems that lower transparency standards reduce transaction spreads, since market
makers tend to offer better prices on block trades, when these remain concealed for some
time, because they can exploit the information conveyed by such trades.15
Nonetheless, many arguments against high standards of market transparency contain
loopholes. First, traders that acquire and read accurately new information or reinterpret
already available information faster than the rest of the market can, for a while, make
superior returns over that information. Secondly, arguments have been offered against the
view that high transparency standards inhibit trading volume and liquidity.16 Increased
market transparency standards might, for instance, result in lower instead of higher trading
costs and thus increase liquidity. In a dealer market, the dealer is exposed to the danger of
being taken advantage by informed traders. As a result, he widens his bid/offer spread
raising the trading costs of uninformed traders. On the other hand, in a relatively
transparent market where the dealer is less concerned with the possibility that he might
13
Harris (1996).
14
Market makers usually absorb large positions in their capacity as liquidity providers and subsequently re-balance their inventories in the open market Board and Sutcliffe (1995, pp. 7-19).
15Madhavan (1993) and Pagano and Röell (1996). 16
incur losses to insiders he lowers his spreads decreasing investors’ trading costs. The
argument applies equally to order-driven markets. Investor monitoring of trading trends
becomes easier, and their ability to respond faster to them leads, possibly, to increased
trading volume.17 Also, as experience from the operation of London Inter Dealer Brokers
(‘IDBs’)18
demonstrates, the withholding of trade information is not used by market dealers
only in order to protect their trades, but also in order to provide inaccessible trade
information to selected clients.19 In addition, it seems that the rapid publication of
post-trade information improves investor confidence that ‘they obtain fair prices’, possibly,
attracting additional order flows.20
Moreover, the multiplication of electronic trading channels, as, for instance, the
ATSs,21 makes market transparency a matter of cardinal importance for reasons of
protection of the integrity of the price formation mechanism. In this context, another issue
that has emerged over the recent years is the transparency of executing brokers’ order
books, especially in respect of limit orders and above all the transparency of transactions
executed internally by highly integrated financial institutions. These have the ability to
execute a client’s order against a proprietary position or match internally two opposite
client orders without having to send it to an exchange or an ATS for execution. It is
unlikely that, in the absence of very large trades, which are subject to mandatory reporting
requirements, the marketplace will receive information about the details of such
transactions in a timely manner. The issue of internalization was one of the most
controversial topics that MiFID has sought to regulate. It raises concerns about the
information efficiency of securities markets’ price formation mechanism, because of
limited availability of price and trade information and trade fragmentation, and issues of
best execution of investors’ orders.22
17
e.g. the display of limit orders may encourage new limit orders to be submitted.
18 On the LSE market makers’ trades executed through IDBs were not appearing on the main SEAQ
screens and thus were visible only to dealers allowed to trade on that system. The restriction of access to
IDBs’ systems for non LSE members was abolished by the LSE Notice of Rule Amendments N74/97, 16
October 1997.
19
This custom allowed large traders with close links with securities dealers to trade at better prices than the
average investor.Steil (1996, p. 37) and O’Hara (1995, p. 164).
20
Gemmill, (1994, pp.26-27).
21
See Harris (1993).
22
Notwithstanding the above, accepting that market transparency plays a very
crucial role in ensuring the fair operation of financial markets does not mean that
financial exchanges and their members should not ascertain property rights over market
(trade and price) information.23 In the highly competitive environment that these operate,
selling financial information constitutes a very legitimate source of income. Exchanges
can negotiate with interested investors information access agreements on a purely
commercial basis.24
Exchanges, ATSs and internalizing brokers should, however, have no right to
restrict access to trade information to any investor who is willing to pay the required
price, in much the same way that lighthouses could not discriminate against passing ships
in nineteenth century Britain, which, as Coase proved, was not a public service but was
financed through levies raised on shippers.25 A modified version of this approach is,
arguably, followed by MiFID, which seems to allow (through the use of the term: on
‘reasonable commercial terms’) commercial negotiations between investors and other
users of market data and operators of both MTFs26 and organized exchanges27 for the
right to have direct and immediate access to pre- and post-trade information. In this
sense, market information preserves its ‘public/collective good’ character, while
members or owners of the facility on which such information is generated are
compensated for their services.28
3 . M i F I D R u l e s o n M a r k e t T r a n s p a r e n c y
3.1 The Transparency Obligations of Regulated Markets
MiFID imposes on operators of both MTFs29 and regulated markets (exchanges)30
obligations for the timely publication of pre- and post-trade information. This information
covers bid and offer prices, the depth of trading interest and order flow, volume, price
23
Mulherin et al. (1991) and Mahoney (1997, p. 1479).
24
See also Mulherin et al. (1991, pp. 633-637) and Mahoney (1997, pp. 1480-1481).
25
Coase (1974, p.357).
26
MiFID, Arts 29 and 30.
27
Arts 44 and 45.
28
See also Mahoney (1997, pp. 1481-1482).
29
MiFID, Arts 29 and 30.
30
and the time of completed trades, in respect of shares admitted to trading on a regulated
market.
The pre-trade transparency obligations of regulated markets involve the
continuous publication of information about:
(a) Current bid and offer prices which are advertised through their systems for shares
admitted to trading (pre-trade transparency);31
(b) the specific types of order, the bid/offer spread in order-driven markets.
The types and size of quotes that designated market-makers in quote-driven markets will
be required to publish are to be determined by subsequent legislation, the so-called Level
2 implementing measures.32 The display of large size orders and quotes or of orders and
quotes in illiquid securities may be exempted,33 as such display may inhibit liquidity.
In the case of completed trades, regulated markets have the obligation to publish
the price, volume and time for all trades in equity instruments ‘concluded under the rules
and systems of the market on a reasonable commercial basis and as close to real time as
possible’34
(post-trade transparency). The reporting of the details of large trades and
trades in illiquid securities could be deferred. The range of orders/quotes to be disclosed
will also be defined by Level 2 implementing measures.
3.2 The Transparency Obligations of MTFs
Among other obligations imposed by MiFID on investment firms and market operators is
the objective, fair, timely and efficient handling of trading interests expressed through
MTFs.35 The authors of the Directive have tried to achieve this objective through, inter
alia, the imposition of pre- and post-trade transparency obligations in respect of equity
transactions concluded on MTFs,36 which are largely symmetrical with the transparency
obligations imposed by MiFID on regulated markets for similar orders or transactions
displayed on or concluded through such markets. MTF operators have no post-trade
transparency obligations, namely, the obligation to publish data on concluded trades,
31
MiFID, Art. 44(1).
32
On the structure and workings of the so-called Lamfalussy process, the method used for the production of financial services legislation in the EU, see Avgouleas (2005, pp. 328-333).
33
MiFID, Art. 44(2).
34
Art. 45(1).
35
Art. 14(1).
36
where relevant information is made public under the system of a regulated market.37
Possibilities for deferral of trade reporting, and the range/depth of pre-trade disclosure are
quite similar to those applicable to regulated markets.38 Also, auction-crossing systems
and other types of MTFs, which do not involve prior disclosure of firm indication for
prices, may be exempted from the scope of the pre-trade transparency obligation.39
3.3. The Transparency Obligations of ‘Systematic Internalisers’
Article 27 of the MiFID, which places pre-trade disclosure obligations on investment
firms that act as ‘systematic internalisers’40
is one of the most controversial provisions of
the Directive, and was considered by many in the industry as very intrusive to investment
firms’ economic freedom.
Article 27 requires investment firms, which execute client orders in shares
internally and outside of a regulated market or an MTF on an organized and systematic
basis to publish firm quotes, namely to disclose to the market the prices at which they
would be willing to buy from and/or to sell to their clients shares admitted to trading in a
regulated market.41 The publication obligation is limited to transactions up to ‘standard
market size’, defined as the ‘average size’ for the orders executed in those shares on EU
markets.42 This provision ensures that European wholesale markets are not be subject to
the rule and thus wholesale broker-dealers shall not be exposed to significant risks in
their role as market makers.
‘Systematic internalisers’ must make public their quotes regularly and
continuously, during normal trading hours. As firms are obliged to make public such
quotes on a reasonable commercial basis, MiFID allows ‘systematic internalisers’ to
decide the group of clients to whom they shall make such quotes available (retail or
professional),43 and the number of transactions they may undertake from the same
37
Art. 30(1).
38 Arts 29(2) and 30(2). Art. 30(2) requires MTFs to obtain the competent authority’s prior approval in
respect of arrangements governing deferred trade publication.
39
Art. 29 (2) and (3)(c).
40 Art. 4(7) of MiFID defines as ‘systematic internalisers’ investment firms, which, on an organised,
regular, and systematic basis, deal on own account by buying and selling financial instruments against their proprietary capital.
41
Art. 27(1).
42
Ibid.
43
client.44 The same firms have post-trade transparency obligations for transactions in
shares admitted to trading on a regulated market, which they execute internally and
outside of a regulated market or an MTF. They must make public details of such
transactions ‘as close to real time as possible’.45
Given the importance of the terms ‘standard market size’ and ‘average size’, it is not
surprising that the debate in the EU as to the content that should be given in these terms
in the forthcoming EU Directive, which as a Level 2 implementing measure, in
accordance with the Lamfalussy process, will give meaning to many of MiFID’s opaque
concepts, is quite heated. Providing definitions that are not expansive enough as to cover
the majority of medium size trades in equities may be of crucial importance for
maintaining and increasing trading volume in EU equity markets, in view of ever
growing global competition for the provision of trade intermediation and execution
services. For this reason, one of the central themes of this paper is to raise awareness
about the adverse consequences that the restrictive content of market maker’s obligation
to timely publish their quotes in regulated markets (Article 44(3)) and the reach of
systematic internalisers’ order and trade publication requirements may have on EU equity markets.
4 . M e a s u r i n g t h e I m p a c t o f T r a n s p a r e n c y R u l e s o n T r a d i n g
V o l u m e
4.1 Identifying the Appropriate Benchmark to Measure Trading Volume
There is an extensive literature dealing with measures of trading volume. Andersen
(1996), Campbell et al. (1993), Gallant et al. (1992), Karpoff (1987), Lamoureux and
Lastrapes (1994), and Lo and Wang (2000) are some of the studies that investigate the
properties of various measures of volume. Karpoff (1987) and Lo and Wang (2000) have
reviewed the most important surveys of measures of trading volume. Based mainly on the
relevant study of Lo and Wang (2000), we use the following three measures of trading
volume:
44
Art. 27(4).
45
The number of shares traded for asset i on a particular day t, called here
volume-based turnover, yt,i.
The number of shares that were traded at the current day’s t closing price, called
here value-based turnover, yt,ipt,i.
The ratio of the value-based turnover to the market value:
yt,ipt,i
Yt,ipt,i
, wherei t i t p
Y, , is the market value of asset i on day t, and Yt,i represents the ordinary shares in
issue of company i at current date t. Note that the number of shares traded to the total
number of shares outstanding, or yt,i Yt,i , gives the same result. Datar et al. (1998) have
used turnover ratio (number of shares traded as a fraction of the number of shares
outstanding) as a proxy for liquidity, in order to provide an alternative measure of
liquidity to Amihud and Mendelson’s (1986) posted bid/offer spread.
We use a sample that covers the period from October 22, 1992 to October 18,
2002. The data set consists of the price, the volume-based turnover and the number of
ordinary shares in issue, on a daily basis, for seventy stocks that belong to the FTSE100
index during the period that is investigated. The data were obtained from DataStream.
Both the pre-SETS and post-SETS sample periods consist of 1262 trading days.46
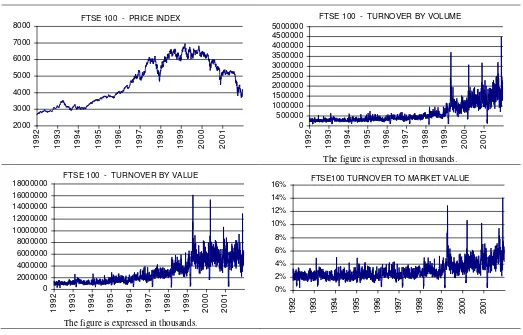
INSERT FIGURE 1 ABOUT HERE
Figure 1 depicts the price index, volume-based turnover, value-based turnover and
the turnover ratio for the FTSE100 index from October 22, 1992 to October 18, 2002.
From a visual inspection, all three measures of trading volume are clearly higher in the
post-SETS period. However, there are two main drawbacks in using the volume-based
turnover and value-based turnover criteria. The number of shares outstanding has an
increasing trend, which drives, by default, volume-based turnover to higher levels.
Moreover, the price levels in the post-SETS period, due to the stock market bubble, are
higher than in the pre-SETS period driving, by default, to higher levels the value-based
turnover. So, it may be proper to devise a measure of trading volume that links, in a
standard form, trading turnover with the total value of the market. Hence, the turnover
46
ratio could be identified as the measure of trading volume that remains resistant to market
changes, namely, changes in the price of relevant stocks and changes in the number of
outstanding shares.
4.2. The Example of SETS
As mentioned above, MiFID’s rules on market transparency have not yet been
implemented. However, we can still draw assumptions as to the possible impact of their
implementation on trading volume by examining the impact of analogous measures
imposed in the past, which changed the way securities markets published order and trade
information. The closest example that can be found is the introduction of increased trade
transparency standards in the LSE as a result of its transition from a dealer (quote-driven
market) to an order driven market on 20 October 1997, when trading of FTSE100 stocks
moved from SEAQ to SETS. Since SETS operated as a central order book, the change
ensured higher levels of both pre-trade and more crucially post-trade transparency.
However, unlike most central order books, on SETS, pre-trade transparency is also high
because the limit orders submitted to the book are visible to all market participants. Thus,
SETS displays the full current depth of the order book. SETS has also increased the level
of post-trade transparency FTSE100 stocks with the exception of trades exceeding eight
times Normal Market Size (NMS), where the trade need not be published until after the
dealer has unwound 80 per cent of the original position.47 This was a major reform, as
such trades remained undisclosed for between thirty minutes and several hours under the
SEAQ regime.
We shall attempt to illustrate below, in a quantitative manner, that if market
developments that are not related to the transition from a dealer to an order driven market
on 20 October 1997 are properly accounted for, then there was not, in fact, a statistically
significant increase in trading volume levels for FTSE100 stocks that is directly related to
changes in the standards of market transparency.
We assume that the variables observed in markets (i.e., equity prices, trading
volume) are priced in continuous time, but the relevant data is sampled discretely in time
with a constant sample frequency. Hence, we define y(m)t,i, for t1m,2 m,..., as a
discrete time positive-valued process at day t, for asset i, with m observations per day.
47
Accordingly, trading volume may be expressed by measuring levels of trading activity,
which are directly observed in discrete points in time. Moreover, we assume a sample
frequency of a daily base, or m1, and we rewrite y(1)t,i yt,i, for reasons of simplicity.
Hence,
yt,i Tt1 refers to the discretely observed series of trading volume of asset i atdays t 1,2,...,T. For the purposes of this paper, we use a sample of data such that the
day n, at which the SEAQ was replaced by SETS, is equal to (T 2)1 and we identify
two sub-groups: (a) 1,...,T 2 and (b) T 21,...,T. Thus, there are 1,2,...,T 2 days prior
to 20th of October 1997 and T 21,T 22,...,T days after the introduction of SETS48.
4.3. Non-parametric Hypothesis Testing
Having already defined the period that will be examined and the stocks that comprise the
tested sample we turn now to offer a method to investigate whether the level of trading
activity differs prior to and after the enactment of the specific rule at day n. Figure 2
presents the frequency distribution histogram of the three measures used here to calculate
trading volume on FTSE100 stocks during the examined period.
INSERT FIGURE 2 ABOUT HERE
In order to test the null hypothesis that the first subgroup median is greater than or equal
to the second subgroup median against the alternative hypothesis that the first subgroup
has a lower median than the second sub-group, we have to apply a non-parametric test,
which does not require the assumption that the differences between the two samples are
normally distributed and the variances are equal:
T
T t i t T
t i
t med y
y med Ho
1 2 / , 2
/ 1 ,
: ,
T
T t i t T
t i
t med y
y med H
1 2 / , 2
/ 1 ,
1: .
The Mann-Whitney test49 is one of the most powerful of the non-parametric tests and it is
considerably more powerful than the usual parametric tests when applied to non-normally
distributed data sets. A rejection of the null hypothesis leads to the conclusion that the
48
Of course, samples of unequal sizes can also be used, as long as there are no major differences in the sample sizes.
49
liquidity levels of SEAQ were lower than those of SETS.50 Of course, we expect a less
frequent rejection of the null hypothesis when the turnover ratio is used as the trading
volume measure. According to the results presented in Table 1, in the case of the
FTSE100 index, the null hypothesis is rejected at any level of significance, indicating that
the median of trading volume is greater in the post-SETS period, irrespectively, of which
measure of trading activity is used.
INSERT TABLE 1 ABOUT HERE
In the sequel, the hypothesis is tested separately for each of the seventy stocks and
the three measures of trading volume. Tables that present the median values of trading
volume measures in the pre-SETS and post-SETS samples, the Mann-Whitney statistics
and the relative p-values for each of the three measures are available upon request by the
authors. In the case of the volume-based turnover, from the total of the seventy stocks,
only in five cases the null hypothesis is not rejected. As regards the BG Group, British
American Tobacco, Foreign and Colonial and Hanson stocks their pre-SETS medians of
trading volume are statistically greater than their post-SETS medians, while in the case of
the Rexam stock the median of turnover volume in the pre-SETS period is not
statistically lower than the median in the post-SETS period.
As regards value-based turnover, in sixty seven of the seventy cases the
post-SETS median of trading volume is greater than the pre-post-SETS median. For any level of
significance, the null hypothesis is rejected for all the cases but for the Hanson, Rexam,
and Tomkins stocks. However, that measure of trading volume suffers from subjectivity
as it is highly related to the current conditions of the market. For example, in the case of a
‘bull’ market, where a sudden increase of stock prices is often observed, the increase in value-based turnover is an immediate consequence. Note that the period of 1998 and
1999 is a period of abrupt increase of market prices.
When the ratio of the value-based turnover to the market value is used to measure
trading volume, the null hypothesis is not rejected at 1% level of significance, for twenty
of the seventy stocks. However, even this measure of trading activity, which is proved
50
robust to market changes, is statistically greater after Monday, October 20, 1997, in the
71% of the cases, at any reasonable level of significance.
4.4. Isolating the Effect of SETS on Trading Volume from Exogenous to Market
Transparency Events
Undoubtedly, overall trading volume is greater in the post-SETS sample. But, is the
observed increase on the level of trading volume attributable to the replacement of the
LSE’s trading system, or was it affected by exogenous to this replacement events? To answer this question we should take into consideration the effect of events that are
independent to the discussed change. For example, during the surveyed period financial
markets experienced the impact of technological revolution which radically transformed
trading infrastructure, especially trade execution mechanisms, the speed of dissemination
and amplification of market information, and investors’ and traders’ access, e.g., trading on the Internet by retail investor. The latter led to a very significant increase in the
number of investors who actively traded on developed securities markets in the post-1997
period. In addition, from 1997 to 1999 securities markets in most of the Western world
experienced one of the strongest bull markets in their history, which resulted in the
creation of multiple ‘stock market bubbles’. This bull market was followed by a bear market, which lasted until the end of the period covered by the sample. Thus, in order to
take into consideration events exogenous to the introduction of SETS, we introduce two
alternative analysis approaches.
4.5. A Deterministic Isolation of Long-Term Trading volume
4.5.1 The First Approach
In the first approach, we use alternative criteria to measure trading volume by subtracting
the long-term trading volume that is present on both sub-samples. Using a regression
model we remove the upward trend, which is present on the whole sample. Thereinafter,
we test whether the remaining trading volume differs prior to and after the introduction of
SETS. Let us consider that trading volume is expressed by a non-linear function of time,
tf , and the unpredictable component, t,i. As the trading volume, as presented in
does not discriminate against either the pre-SETS or the post-SETS period. Based on the
three measures of trading activity, mentioned in the previous section, we define the
de-trended trading volume measures 1,t,i, 2,t,i and 3,t,i, in the following forms:
De-trended volume-based turnover
t f yti it, , ,
1
, (1)
De-trended value-based turnover
t f p yti ti it, , , ,
2
, (2)
De-trended turnover ratio
ytipti
Ytipti
f
ti
t, , , , ,
, 3
. (3)
The parameters a0, a1 and a2 in f
t are estimated by the method of least squares, under the assumption that the component t,i is normally distributed. Hence, for the caseof the de-trended volume-based turnover, the estimated regression model is presented as:
i t i
t a at a t
y, 0 1 2 2 1,, ,
2
, 1 ,
,
1ti ~N 0, i
.
(4)
The estimated process
T t i t, 1 , 1ˆ
is the de-trended volume-based turnover, for
2 2 1 0 , , ,
1 ˆ ˆ ˆ
ˆ ti yti a ata t
, where aˆ0, aˆ1 and aˆ2 are the estimated values of the
parameters in regression model (4). In the sequel, we re-examine the hypothesis that the
level of trading volume changes following the introduction of SETS on 20th October
1997:
T
T t i t T t i t med med Ho 1 2 / , , 1 2 / 1 , , 1 ˆ ˆ : ,
T
T t i t T t i t med med H 1 2 / , , 1 2 / 1 , , 1
1: ˆ ˆ .
(5)
The regression model (4) is also applied for deriving the de-trended trading volume
measures defined in (2) and (3) and the hypothesis test in framework (5) is used for the
de-trended value-based turnover and the de-trended turnover ratio.
The application of the model illustrated in framework (4) on FTSE100 daily
returns yields the estimated parameters that are presented in Table 2. The Newey and
West (1987) heteroskedasticity and autocorrelation consistent (HAC) standard errors are
autocorrelation of unknown form. All the estimated parameters are statistically different
to zero for any reasonable level of significance indicating the appropriateness of the
quadratic form of f
t .51 Figure 3 depicts the plots of the de-trended measures of trading volume, and Figure 4 presents the relative frequency distribution histograms. Theasymmetrical form of the histogram of frequency distribution and the high level of
kurtosis show that the de-trended measures are still non-normally distributed. Thus, the
use of a non-parametric test that is robust to the shortage of the normality assumption is
as apposite here as in the previous section.
INSERT TABLE2 ABOUT HERE
INSERT FIGURE3 ABOUT HERE
INSERT FIGURE4 ABOUT HERE
We apply the hypothesis test in (5) for the
ˆ1,t,FTSE100
,
ˆ2,t,FTSE100
and
ˆ3,t,FTSE100
estimated processes. According to Table 3, for two of the three de-trendedmeasures of trading volume the null hypothesis is strongly rejected, giving support to the
assumption that the observed increase of trading volume is not attributable to the
introduction of SETS. As regards the first of the de-trended measures the 12.356 value of
the Mann-Whitney statistic leaves no room to dispute the lower level of the measure in
the post-SETS period. In the case of the de-trended turnover ratio, the median values of
pre-SETS and post-SETS samples are –0.00679 and –0.13079, respectively and the
Mann-Whitney statistic is 4.756, with a zero p-value. On the other hand, the de-trended
value-based turnover tells us that the introduction of SETS did not influence the levels of
trading volume. Summing up the case for the FTSE100 index, the removal of the upward
trend that is common to both sub-samples permits the use de-trended criteria in the given
measures of trading volume, which lead us to the conclusion that trading volume has not,
in fact, increased due to the introduction of SETS. This conclusion is, of course, subject
to upholding as valid our assumption that the influence of exogenous events - events not
related to the change of trading system and standards of transparency - on trading volume
can be measured and isolated.
51
INSERT TABLE3 ABOUT HERE
For the seventy stocks that comprise our dataset, let us proceed in testing the difference
of median values of the de-trended measures of trading volume before and after the
introduction of SETS. In respect of the trended volume-based turnover and the
de-trended value-based turnover we reach to the same conclusion. The null hypothesis is
rejected for sixty one and sixty seven stocks in the cases of the de-trended volume-based
turnover and the de-trended value-based turnover, respectively, in 5% level of
significance. However, in the case of the de-trended turnover ratio, the hypothesis tests
do not give us a clear view. For thirty nine of the seventy cases the null hypothesis is
rejected in 5% level of significance.
We can also express the dynamic formulation of trading volume by adding a
dummy variable in the model illustrated in framework (4) to express the change of the
trading volume level after the day that SETS was introduced:
t t
t a at a t a d
y 3
2 2 1 0
2
, 0
~
t N
. 2 1
, 1
, 0
else T t if dt
(6)
Framework (6) captures both the long-term upward quadratic trend, f
t a1ta2t2, and the different level of trading volume due to the introduction of SETS, a0 a3dt. Model(6) is applied to all three measures of trading volume. The estimated values of the
parameters, which are presented in Table 4, are in accordance with our findings.
INSERT TABLE4 ABOUT HERE
The estimated values of parameter a3 are negative and statistically different to zero in
two of the three cases, indicating that at the time of the introduction of SETS trading
volume did not shift to a higher level. As regards the case of the measure of value-based
turnover, the positive and statistically significant value of parameter a3 may be
associated with the sudden increase of stock prices rather than with an increase of trading
volume. At this point we should be reminded of the main disadvantage of the turnover by
increase in prices that securities markets experienced during the first three years of the
post-SETS period due to the ‘stock market bubble’ and the increased demand induced by
easy retail investor access. Figure 5 plots the regression lines from the application of
model (6) for the de-trended measures, giving a visual perspective of our arguments. So,
we conclude that a) although trading activity exhibits an upward trend during the full data
set that is examined, b) the introduction of SETS by itself did not increase the level of
trading volume.
INSERT FIGURE5 ABOUT HERE
4.5.2 Simulated Evidence
In order to investigate whether the assumption that a change in the level of trading
volume could be efficiently captured by the non-parametric Mann-Whitney test, we run a
Monte Carlo simulation. We create 10000 series (each series is consisted of 10000 data)
from the data generating processes:
0,1 ~ 2 2 1 0 N t a t a a y iid t t t (7) and
0,1. ~ 1 2 2 1 , 1 , 0 3 2 2 1 0 N T t T if T t if d d a t a t a a y iid t t t t t (8)The parameters are set equal to the values estimated for the FTSE100 turnover ratio,
a0,a1,a2
2.38,0.000877,7.43E07
and
a0,a1,a2,a3
2.308,0.000745,7.97E07,0.28027
. The data generating process in (7) produces samples with a quadratic upward trend, while the data generating process in (8) createsdata samples with a long-term upward trend and a downward shift in the level of yt at
time t T/2. For each simulated series of both data generating process, the innovation
series, ˆt, of the regression model yt aˆ0 aˆ1taˆ2t2ˆt, is estimated. If the data
generating process is (7) then the null hypothesis
T
T t i t T t i t med med Ho 1 2 / , 2 / 1 , ˆ ˆ : ,against the alternative H med
ti Tt
med
ti Tt T
1 2 / , 2 / 1 ,
1a
% of the cases at a% level of significance. Accordingly, if the data generating process is (8) then the null hypothesis should be rejected for the
1a
% of the cases at%
a level of significance. The Mann-Whitney statistic is used for conducting the
hypothesis test. Figure 6 presents the results of the simulation study. If the generating
process (7) derives the data, indeed for the
1a
% of the cases the null hypothesis is not rejected at a% level of significance. On the other hand, for the generated process (8), thetotal of the cases lead to the rejection of the null hypothesis. Hence, according to the
simulated study, the procedure followed in the previous section in order to explore the
relationship between higher standards of trade transparency, introduced as a result of the
operation of SETS, with the observed increase in trading volume, leads to robust results
for the Mann-Whitney hypothesis test. Furthermore, the simulation study was repeated
for various sets of parameter values and we find out that the results were indifferent to the
values of the applied parameters.
INSERT FIGURE6 ABOUT HERE
4.6. A Stochastic Isolation of Long-Term Trading volume
In the previous section, we attempted to answer the question whether the introduction of
SETS had an impact on trading volume levels in the sampled FTSE100 stocks. We used
de-trended measures of liquidity, fitted estimating a quadratic time trend, and concluded
that market developments other than the introduction of SETS were the most important
reasons underlying the observed increase in trading volume. However, the factors that are
not related to the market transparency were considered deterministically. The estimation
of a deterministic time trend may not be robust for the choice of time period. In this case,
had we analyzed a dataset relating to a different time period, we would have assumed
another trend for long-term trading volume. Namely, an extension of the examined
dataset to a more recent time period, when trading volume did not continue to rise
according to a quadratic time trend, would obviously change the form of the long-term
trend.
The method of stochastic time trends as developed by Harvey (1989) provides a
statistical background to model the unobserved components along with the dummy
variable expressing the change in the levels of market transparency. In this section, we
filtering method in a state space form to estimate simultaneously the stochastic movement
of the long-term trading volume and the effect of the change in transparency standards.
Structural time series models provide a framework where the variable under
investigation, yt,i, is modeled as the sum of unobserved, but with a direct interpretation,
components such as trend, t,i, and irregulars, t,i:
. 2 1 , 1 , 0 , 0 ~ , , 0 ~ , , 0 ~ , 2 , , , , 1 , 2 , , , , 1 , 1 , 2 , , , , , else T t if d N N N ad y t i iid i t i t i t i t i iid i t i t i t i t i t i iid i t i t t i t i t (9)In order to focus on the impact of SETS on trading volume, a deterministic dummy, dt,
is introduced and we investigate if it is statistically significant. The stochastic property of
irregulars, level of trend and slope of trend are driven by 2,i, 2,i and 2,i, respectively. If any of these variances is zero, the stochastic component reduces to a deterministic
stationary process.
The structural time series model in (9) is estimated for the three measures of
trading volume. In all the cases, the estimated variance of the slope is close to zero,
indicating that the slope of trend is deterministic. The application of the structural model
illustrated in (9) on FTSE100 daily returns yields the estimated parameters that are
presented in Table 5. Figure 7 depicts the trend, t,FTSE100, and irregular, t,FTSE100,
components. The estimated values of parameter a are not statistically different to zero in
all the cases, indicating that, at the time of the introduction of SETS, trading volume did
not shift to a higher level.
INSERT TABLE5 ABOUT HERE
INSERT FIGURE7 ABOUT HERE
The model framework in (9) is applied for the three measures of trading volume in the
seventy stocks of the sample. In the majority of the cases the null hypothesis that a0 is
not rejected. Specifically, for 10% level of significance, the null hypothesis is rejected in
turnover and turnover ratio, respectively52. Therefore, in general terms the use of the
stochastic method leads to a similar conclusion with that offered in the previous section:
the introduction of SETS was not a significant contributing factor to the observed
increase in trading volume for the stocks under consideration.
5 . C o n c l u s i o n
On the basis of the three benchmarks used in this article to measure trading volume, we
observe a clear increase in the level of trading activity of the sampled FTSE100 stocks in
the post-SETS period. However, this result may be unrelated to any influence that
increased transparency standards had on trading volume following the change of trading
system and the introduction of a central order book for FTSE100 stocks. Thus, a
procedure had to be devised to measure the influence of the introduction of SETS on
trading volume during the examined period in isolation from that of other factors –
factors that do not relate to this change. For this reason, we used two different methods
that permitted us to isolate the trend in trading volume, which is common in both the
pre-SETS and the post-pre-SETS periods. In using the first method, we removed the deterministic
trading volume trend that is shared by both periods. We named the modified measures:
de-trended measures of trading volume. The use of the de-trended measures led us to the
conclusion that the introduction of SETS did not have an appreciable impact on trading
volume for the sampled FTSE100 stocks. In using the second method, we utilized a
stochastic structural time series analysis technique, which allowed us to reach a similar
conclusion: the introduction of SETS did not lead to any appreciable increase in trading
volume for the stocks under study.
The above findings, based on properly adjusted data derived from the operation of
SETS, indicate that the higher transparency standards, which MiFID imposes on equity
securities trading in the EU, are an unlikely means of trading volume enhancement. The
first possibility is that MiFID rules will fail to boost trading volume, an outcome that
would be consistent with the findings of our study. Another possibility is that this will be
followed by lower levels of liquidity in EU equity markets - a field in which further
research is required. A combination of the aforementioned outcomes would harm the
52
depth and efficiency of EU equity markets. Therefore, EU law-makers must consider
seriously the issues of trading volume and liquidity in drafting MiFID’s Level 2 implementing measures, especially when it comes to the proper reach of the Directive’s
rules on the publication of small and medium size trades.
Since this article has only examined the impact of increased transparency rules on
trading volume, further research is required to assess the likely and, once the Directive is
implemented, actual impact of MiFID’s transparency rules on the liquidity of EU equity
markets using as benchmark, inter alia, the depth of the bid-offer spread.
R e f e r e n c e s
Amihud, Y. and Mendelson, H. (1986). Asset pricing and the bid-ask spread,Journal of
Financial Economics,Vol. 17, pp. 223-249.
Andersen, T. (1996). Return volatility and trading volume: an information flow
interpretation, Journal of Finance, Vol. 51, pp. 169-204.
Avgouleas, E. (1998). Market accountability and pre- and post-trade transparency: the
case for the reform of the EU regulatory framework: Part 1, Company Lawyer, Vol.
19, pp. 162-170.
Avgouleas, E. (2005). The new EC financial markets legislation and the emerging
regime for capital markets, in: Eeckhourt, P. and Tridimas, T. (Eds.), Yearbook of
European Law 2004, Oxford, Oxford University Press, pp. 321-361.
Board, J. and Sutcliffe, C. (1995). The effects of trade transparency in the London
Stock Exchange: a summary, LSE-FMG Special Article, 67, London.
Campbell, J., Grossman S. and Wang, J. (1993). Trading volume and serial correlation
in stock returns, Quarterly Journal of Economics, Vol. 108, pp. 905-939.
Cheung, Y.C., Jong, F. de and Rindi, B. (2003). Trading European sovereign bonds:
the microstructure of the MTS trading platforms, EFA 2003 Annual conference
article, Technical Report 245.
Chordia, T., Sarkar, A. and Subrahmanyam, A. (2003). An empirical analysis of stock
and bond market liquidity, Emory University, Atlanta, Working Article.
Coase, R.H. (1974). The lighthouse in economics, Journal of Law and Economics, Vol.
Coffee, J. (1984). Market failure and the economic case for a mandatory disclosure
system, Virginia Law Review, Vol. 70, pp. 717-753.
Conover, W.J. (1980). Practical Nonparametric Statistics, John Wiley & Sons, New
York.
Datar, V.T., Naik, N.Y. and Radcliffe, R. (1998). Liquidity and stock returns: an
alternative test, Journal of Financial Markets,Vol. 1, pp. 203-219.
Fleming, M. (2001). Measuring treasury market liquidity, Federal Reserve Bank of New
York, Working Article.
Gemmill, G. (1994). Transparency and liquidity, a study of large trades on the London
Stock Exchange under different publication rules, Office of Fair Trading, Research
Article 4.
Gilson, R.J. and Kraakman, R. H. (1984). The Mechanisms of market efficiency,
Virginia Law Review, Vol. 70, pp. 549-643.
Glosten, L.R. and Milgrom, P.R. (1985). Bid, ask and transaction prices in a specialist
market with heterogeneously informed traders, Journal of Financial Economics,
Vol. 14, pp. 71-100.
Gallant, R., Rossi, P. and Tauchen, G., (1992). Stock prices and volume, Review of
Financial Studies, Vol. 5, No. 2, pp. 199-242.
Ganley, J., Holland, A., Saporta, V. and Vila, A. (1998). Transparency and the design
of securities markets, Financial Stability Review,Bank of England, Vol. 4, pp. 8-17.
Harris, L. (1993). Consolidation, fragmentation, segmentation and regulation, Financial
Markets, Institutions and Instruments, Vol. 2, No. 5, pp. 1-28.
Harris, L. (1996). Does a large minimum price variation encourage order exposure?,
University of Southern California, Working Article.
Harris, L. (1997). Order exposure and parasitic traders, University of Southern
California, Working Article.
Harvey, A.C. (1989).Forecasting Structural Time Series Models and the Kalman Filter,
Cambridge, Cambridge University Press.
Irvine, P.J., Benston, G. and Kandel, E. (2000). Liquidity beyond the inside spread:
Measuring and using information in the limit order book. Emory University,
Kalman, R.E. (1960). A New approach to linear filtering and prediction problems.
Journal of Basic Engineering, Transactions of the ASME Series D, Vol. 82, pp.
35-45.
Kalman, R.E. (1963). New methods in Wiener filtering theory, in: Bogdanoff, J.L. and
Kozin, F. (Eds.), Proceedings of the First Symposium of Engineering Applications
of Random Function Theory and Probability, pp. 270-388, New York, Wiley.
Karpoff, J. (1987). The relationship between price changes and trading volume: a
survey, Journal of Financial and Quantitative Analysis,Vol. 22, pp. 109-126.
Kini, O. and Mian, S. (1995). Bid-ask spread and ownership structure, Journal of
Financial Research, Vol. 18, No. 4, pp. 401-414.
Lamoureux, C. and Lastrapes, W. (1994). Endogenous trading volume and momentum
in stock-return volatility, Journal of Business and Economic Statistics, Vol. 12, pp.
253-260.
Lo, A.W. and Wang, J. (2000). Trading volume: definitions, data analysis and
implications of portfolio theory. National Bureau of Economic Research, Working
Article, 7625.
Madhavan, A. (1993). Trade disclosure and the integration of international securities
markets, Cornell University, Working Article,
Madhavan, A., Porter, D. and Weaver, D. (2001). Should securities markets be
transparent?, Conference, Financial Market Structure and Dynamics, Bank of
Canada.
Mahoney, P.G. (1995). Mandatory disclosure as a solution to agency problems,
University of Chicago Law Review,Vol. 62, pp. 1047-1112.
Mahoney, P.G. (1997). The exchange as regulator, Virginia Law Review, Vol. 83, pp.
1453-1500.
Mahoney, P.G. (2003). Market microstructure and market efficiency, Iowa Journal of
Corporate Law,Vol. 28, pp. 541.
Mulherin, H., Netter, J.M. and Overdahl, J.A. (1991). Prices are property: the
organisation of financial exchanges from a transaction cost perspective, Journal of