Certification and uncertainty evaluation of flavonoids
certified reference materials
Can Quan*, Huanfang Yao, Caixia Hou
Division of Chemistry, National Institute of Metrology, Beijing 100013, China;
*
Corresponding Aut
Received August 2013
ABSTRACT
Flavonoids are the most widely used in the field of the food, medicine, and cosmetic due to their pharmacological functions and biological activi-ties, such as anti-tumor, anti-inflammatory and antioxidation. This work described the assign-ment of purity values to 3 flavonoids certified reference materials (CRMs) including baicalein, 5,7-dihydoxy flavones and naringenine which were developed in this study according to the ISO Guides 34 and 35. The qualitative analysis was performed by liquid chromatography-mass spectrometry (LC-MS) and infrared spectrosco-py (IR). The CRMs’ purity values were assigned based on the weighted average of quantitative nuclear magnetic resonance method and mass balance approach with high resolution liquid chromatography-VWD. All the three CRMs with following value mass fractions: baicalein at a certified purity P ± U (k = 2) of 98.8% ± 0.8%; 5,7-dihydoxy flavones of 99.1% ± 0.7% and na-ringenine of 99.5% ± 1.0% respectively. The homogeneity of the CRMs was determined by an in-house validated liquid chromatographic me-thod. Potential degradation during storage was also investigated and a shelf-life based on this value was established.
Keywords:Flavonoids; Certified Reference Material (CRM); Quantitative Nuclear Magnetic Resonance (QNMR); Mass balance approach; Uncertainty
1. INTRODUCTION
A certified reference material (CRM) is a material or substance whose one or more property values are suffi-ciently homogeneous, stable, and well established to be used for the calibration of an apparatus, the assessment of a measurement method, or for assigning values to ma-
terials [1].
Flavonoids are increasingly in demand in the field of the food, medicine, and cosmetic [2] due to their phar-macological functions and biological activities, such as anti-tumor, anti-inflammatory and antioxidation [3-5]. The qualities of flavonoids products will have analytical challenges. The flavonoids CRMs have been determined by at least two independent analytical methods. The fla-vonoids CRMs could be used to ensure the accuracy, traceability and comparability of the related products test results.
This paper describes the development of three flavo-noids CRMs including baicalein, 5,7-dihydoxy flavones and naringenine. Qualitative analysis was carried out by infrared spectrometry (IR) and liquid chromatography- mass spectrometry (LC-MS). The moisture content and inorganic elements content were determined by Karl Fisch-er titration, inductively coupled plasma mass spectrome-try (ICP-MS), respectively. Homogeneity study was eva-luated by F-test and t-test both for between vials and within vial. The uncertainties of CRMs were evaluated extensively.
2. EXPERIMENTAL
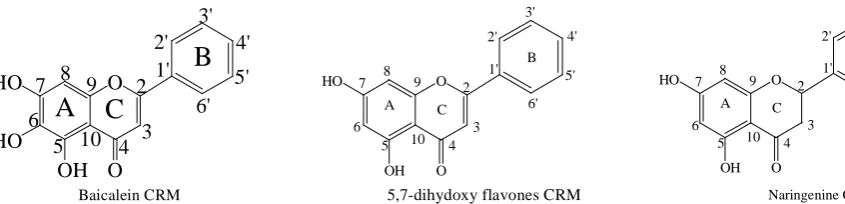
2.1. MaterialsThe chemical structure of flavonoid compounds stu-died including baicalein, 5,7-dihydoxy flavones and na-ringenine were shown in Figure 1, all were purchased from Sigma-Aldrich (USA). Benzoic acid certified ref-erence material (99.9% ± 0.1% purity) used as QNMR internal standard was obtained from NIST, China.
HPLC grade Acetonitrile and methanol were bought from Merck (HPLC, Germany). Dimethyl sulfoxide-d6
solvent was purchased from Cambridge Laboratoties
(USA). Distilled deionized water (18.2 MΩ∙cm) was ob-tained with Milli-Q water system and filtered through 0.22 μm membrane.
2.2. Instrument
Figure 1. Structure of the studied flavonoids CRMs.
Thermo Nicolet IS10 spectrophotometers. All the flavo-noids reference material solutions, diluted to
concentra-tion of 10 μg∙mL−1 in methanol for LC/MS Analysis were quantified at flow injection analysis mode with an Agilent 6410 triple quad system with electro-spray ioni-zation source (ESI). The QNMR measurements were performed with a Bruker AV600 spectrometer (Bruker, Billerica, MA). The Agilent 7500CE ICP-MS was used for the analysis of trace metal residues in all the samples. A Mettler Tolerdo DL39 Karl Fischer titrator was used for water measurement of all the samples.
2.3. Qualitative Analysis Methods
2.3.1. LC-MS Method
The flavonoids CRMs in methanol with concentration
of 10 μg∙mL−1 were used to LC-MS analysis. The ion spray voltage was set at 4.0 kV. Drying gas temperature was maintained at 350˚C with flow rate of 9.0 mL∙min−1. Nebulizer pressure was set at 40 psi. The fragmentor energy was set at 135 V. The collision energy respective-ly were optimized at 30 V for baicalein and 5,7-dihydoxy flavones, and 16 V for naringenine. The analysis the mass spectrum peak molecular weight in an ESI positive ion mode at specified MS scan range of 60 - 300.
2.3.2. IR Method
Infrared spectra were collected with FT-IR spectrome-ter Thermo Nicolet IS10 spectrophotomespectrome-ters via KBr pellets technique. Specimens were ground with dried spectroscopic grade KBr powder and the mixture was compressed to pellets for FT-IR measurements. The sample to KBr mass ratio was optimized as 1:100. All the spectra were collected in the 4000 - 400 cm−1 range at 4 cm−1 resolution.
2.4. Quantitative Analysis Methods
2.4.1. Mass Balance Approach
The flavonoids were quantified by HPLC equipped with an ZORBAX Eclipse XDB-C18(460 mm × 250 mm
× 5 μm, Agilent ) column with VWD detector. The chromatography conditions are detailed in Table 1. The purity values of flavonoids CRMs were calculated using
the peak area normalization method. Following subtract the moisture and inorganic elements impurities which not measured by HPLC from 100%, as follows [6,7]:
(
m a)
HPLCPurity= −1 P −P ∗P (1) Where, PHPLC is the percentage area of main
com-pound acquired by HPLC-VWD, Pm is the moisture
con-tent measured by Karl Fisher method, and Pa is the
inor-ganic elements content measured by ICP-MS.
2.4.2. QNMR Method
The QNMR method is based on the directly propor-tional relationship between the signal response (inte-grated signal area, Ix) and the number of nuclei
generat-ing the correspondgenerat-ing resonance line, which is represented by Eq.1 as [8].
std S std std x x std std x S x x P m m M M N N I I m m
P = = ⋅ ⋅ ⋅ ⋅ (2)
Where Px is purity of analyte; Ix and Istd are the
inte-grated signal areas of analyte and internal standard, re-spectively; Nx and Nstd are the spin numbers of the
ana-lyte and internal standard, respectively; Mx and Mstd are
molar mass of analyte and internal standard, respectively;
m and mstd are the mass of analyte and internal standard,
respectively; Pstd is the purity of the internal standard.
The QNMR measurements were performed with a Bruker AV600 spectrometer (Bruker, Billerica, MA). Spec-tra were run with the following optimized parameters: probe size, 5 mm; probe temperature, was 23.0˚C; exci-tation pulse angle, 45˚; 32 K time domain points; 16 K
spectral data points; pulse delay, 4.15 μs; relaxation delay,
32 s and number of scans, 32. A sample solution con-taining about 10 mg benzoic acid, 70 mg of carbohydrate samples diluted in 0.5 mL DMSO was analyzed by QNMR. The total mass of analyte in the sample solution was determined using Eq.1.
2.5. Homogeneity Study and Stability Study
According to the Technical Norm of Primary Refer-ence Material of China [9], the homogeneity study and the stability study were carried out by HPLC-VWD me-thod. 15 bottles, were randomly selected and assayed for O O OH HO HO 7 6
5 10 4 3
2 9 8 1' 4' 5' 6' 2' 3'
A
C
B
Baicalein CRM O O OH HO 7 65 10 4
3 2 9 8 1' 4' 5' 6' 2' 3' A C B
5,7-dihydoxy flavones CRM
O
O OH
HO 7
6
5 10 4
Tab le 1. The chromatography conditions of the studied flavonoids CRMs.
CRMs Mobile phase
(Acetonitrile:0.1% phosphoric acid) Wavelength (nm) Injection volume (μL) Flow (mL/min) Concentration (mg/mL)
Baicalein 35:65 275 5 1 0.5
5,7-dihydoxy flavones 43:57 268 5 1 0.3
Naringenine 35:65 288 2 1 1
homogeneity between bottles, and 7 portions from each bottle were assayed for homogeneity within bottle. The results were examined via F-test and t-test. In F-test, standard deviations were used to examine whether the deviation between bottles was significantly greater than the deviation within bottle. In t-test, means were used to examine whether the mean between bottles was signifi-cantly different from that of within bottle [10].
A stability study monitored a significant change in value of the flavonoids CRMs was performed over one year.
A study of long-term stability for storage at 4˚C was carried out by HPLC-VWD method [11] in which ma-terial was determined at 1, 3, 6 and 12 months. For each condition, two solutions were prepared and analyzed in duplicate. A comparison was made between the purity determined by HPLC-VWD for different storage time. A freshly prepared control sample was analyzed at each time. All the samples were randomized for analysis.
2.6. Uncertainty Evaluation
The uncertainty evaluation for the flavonoids CRMs derived from the certified value, homogeneity and stabil-ity study. The expanded uncertainty was calculated as follows:
2 2 2
c uv uh us
U= ⋅k U = ⋅k + + (3) where, k is the coverage factor, Uc is the combined
un-certainty of the sample, uv, uh, us are the uncertainty
components of the assigned value, homogeneity and sta-bility study.
3. RESULTS AND DISCUSSION
3.1. Qualitative Analysis Methods3.1.1. LC-MS Method
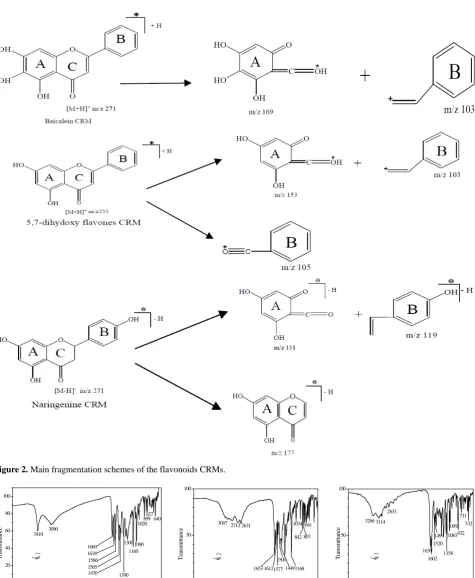
The experiment obtained the molecular weight of the flavonoids CRMs by full scan mass spectra. The results indicted the molecular ion peak (M + H)+ of mass charge ratio m/z of baicalein and 5,7-dihydoxy flavones was the molecular weight plus the atomic weight of hydrogen (1.0), the molecular ion peak (M − H)− of mass charge ratio m/z of naringenine was the molecular weight sub-tract the atomic weight of hydrogen (1.0). Ion fragments by product ion scan are detailed in Figure 2. The results showed the flavonoids mainly fractured in 1,2 C-Ochem-
ical bond and 3,4 C-C chemical bond.
3.1.2. IR Method
The Infrared spectrum of the flavonoids CRMs were shown in Figure 3. The results revealed the peaks at 3090, 3097, and 3114 cm−1 belong to hydroxide peaks, 1660, 1653, and 1630 cm−1 belong to associated carbonyl peaks, 1449 ~ 1618 cm−1 belong to benzene ring skeleton of C = C peaks of the flavonoids CRMs. The Infrared spectrums of the flavonoids CRMs were consistent with those spectrums from literature [13-15] and can be used for quantification.
3.2. Quantitative Analysis Methods
3.2.1. Mass Balance Approach
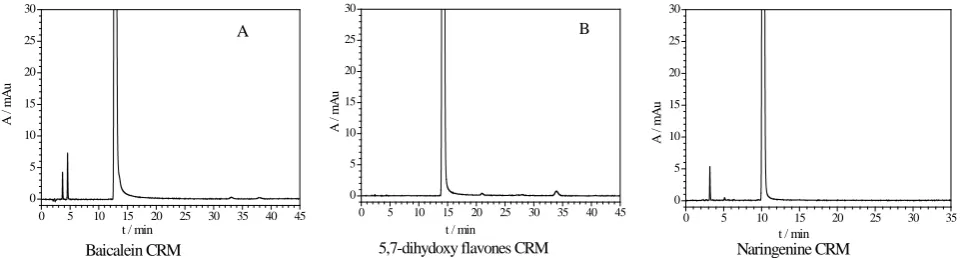
The HPLC chromatogram of the flavonoids CRMs were shown in Figure 4. The results of the moisture content and the inorganic elements contents were listed in Table 2, as indicated, The water content for Baicalein, 5,7-dihydoxy flavones, and naringenine were 0.538%, 0.150%, 0.098% and 0.115%, respectively, all were less than 0.1%, while the inorganic content all warless than 0.00002% at the studied conditions.
3.2.2. QNMR Method
QNMR was also used to determinate purity values flavonoids CRMs. The NMR spectrums were shown in
Figure 5. The C3-H peak areas of baicalein, C8-H peak
areas of 5,7-dihydoxy flavones, C4,-OH peak areas of
naringenine, C2,2-2H peak areas of the benzoic acid
in-ternal standard were selected for integration.
3.2.3. Purity Values of the Flavonoids CRMs
The purity values of flavonoids CRMs were calculated with the average of mass balance approach and QNMR method. The results are listed in Table 2.
3.3. Homogeneity Study and Stability Study
The F-Test and t-test results of all the studied were summarized in Table 3. No significant differences were found for all the studied compounds in homogeneity test as the calculated F-values were less than the critical
[image:3.595.57.546.104.164.2]Figure 2. Main fragmentation schemes of the flavonoids CRMs.
Figure 3. The infrared spectrums of the studied flavonoids CRMs.
The flavonoids CRMs stored at 4˚C were used to test stability. The testing data of stability study are showed in
Table 4. The results in different times were consistent with the standard value through the t-test analysis. There
4000 3500 3000 2500 2000 1500 1000 500
0 20 40 60 80 100
1470
640 827 899
1090 1160 1618
3090 3410
Wavenumbers(cm-1)
T
ra
n
sm
it
ta
n
ce
( %)
1300
1586 1660
1505 1390
1020
Baicalein CRM
4000 3500 3000 2500 2000 1500 1000 500
0 50 100
641
807 842
1168 1500
1577 1034
1449 1612 1653 2712 2631
T
ra
n
sm
it
ta
n
ce
( %)
Wavenumbers(cm-1) 3097
5,7-dihydoxy flavones CRM
4000 3500 3000 2500 2000 1500 1000 500
0 50 100
1083
1065 532
731
832
1520 1499
1158 1602 1630 2833
3114
T
ra
n
sm
it
ta
n
ce
( %)
Wavenumbers(cm-1) 3286
Figure 4. Purity determination HPLC chromatogram of the flavonoids CRMs.
Tab le 2. The purity values results of flavonoids CRMs.
CRMs HPLC (%) QNMR (%) Average (%)
Baicalein 98.78 98.88 98.8
5,7-dihydoxy flavones 99.40 98.84 99.1
Naringenine 99.47 99.46 99.5
were no obvious changes in purity values monitored of the flavonoids CRMs over one year. The results mean that they were stable.
3.4. Uncertainty Evaluation
The uncertainty for the flavonoids CRMs is composed of the uncertainty from the certified value, homogeneity and stability study.
3.4.1. Uncertainty of Certified Value
1) Uncertainty from HPLC measurement [16]. a) u1 (type A uncertainty) is the uncertainty from
re-peatability of HPLC measurement.
b) u2 (type B uncertainty) is the uncertainty from
dif-ferent responses from flavonoids CRMs and impurities at different wavelengths of HPLC measurement.
The combined uncertainty is as follow:
2 2
HPLC 1 2
u = u +u
2) Uncertainty of the QNMR measurement
a) u3 (type A uncertainty) is the uncertainty from
re-peatability of QNMR measurement.
b) u4 is the uncertainty from relative molar masses of
flavonoids CRMs and benzoic acid internal standard CRM. The value of u4 calculated is less than 0.1%. In
this case, u4 is ignored.
c) u5 is the uncertainty from benzoic acid CRM. The
uncertainty of benzoic acid CRM was 0.1%, according to the uniform distribution, u5 = 0.1%/31/2 = 0.06%.
d) u6 is the uncertainty from balance weighing. The
balance (Max = 2.1 g, d = 0.1 μg) was used to weigh the flavonoids CRMs and benzoic acid internal standard CRM. Balance changing and test error estimate for the 0.5 μg, therefore u6 is estimated 0.01%.
The combined uncertainty is as follow:
2 2 2 2
QNMR 3 4 5 6
u = u +u +u +u
3.4.2. The Combined Uncertainty
The combined uncertainty for the flavonoids CRMs is composed of the uncertainty from the certified value, homogeneity and stability study. The results of homo-geneity and stability study completely conformed to the requirement of homogeneity and stability in the regula-tion of the CRMs. The homogeneity and stability of the flavonoids CRMs both are good. Therefore the uncer-tainty of homogeneity (uh) and stability (us) is neglected.
2 2 2 2 2 2 2
C v h s HPLC QNMR h s
2 2 2 2 2 2 2 2
1 2 3 4 5 6 h s
2 2 2 2 2 2
1 2 3 4 5 6
U u u u u u u u
u u u u u u u u
u u u u u u
= + + = + + +
= + + + + + + +
≈ + + + + +
3.4.3. The Expanded Uncertainty
The expanded uncertainty (U) for this flavonoids CRMs was calculated by multiplying the combined un-certainty by a coverage factor of k = 2. The uncertainty evaluation for flavonoids CRMs were listed in Table 5.
4. CONCLUSION
The three flavonoids CRMs were developed with the procedures of sample preparation, certified value, homo-geneity study, and stability study and uncertainty evalua-tion. The three flavonoids CRMs can not only meet the requirement of quantitative detection of food, medicine and related materials, but also provide a more quickly and accurately experimental methods for the research and development of related products.
5. ACKNOWLEDGEMENTS
The authors acknowledge Special Program for Key Basic Research
of the Ministry of Science and Technology, China (Grant No. 2011FY130100) and the National Natural Science Foundation of China (Grant No 21275134/B0505) for financing this work.
0 5 10 15 20 25 30 35 40 45 0 5 10 15 20 25 30 A / m Au
t / min
A
Baicalein CRM
0 5 10 15 20 25 30 35 40 45 0 5 10 15 20 25 30
t / min
A /
m
Au
B
5,7-dihydoxy flavones CRM
0 5 10 15 20 25 30 35
0 5 10 15 20 25 30 A / m Au
t / min
[image:5.595.57.289.256.310.2]Tab le 3. Homogeneity results for the contents, the within-bottle, and between-bottle and homogeneity test of flavonoids CRMs.
Homogeneity test Baicalein CRM 5,7-dihydoxy flavones CRM Naringenine CRM
X between-bottle (s1,%) 99.31 ± 0.018 99.58 ± 0.013 99.58 ± 0.015 within-bottle (s2,%) 99.31 ± 0.011 99.58 ± 0.010 99.58 ± 0.010
F-test
2 2
1 / 2
F=s s 2.63 1.86 2.60
0.05
F (14,6) 3.96 3.96 3.96
0.05
F<F Y Y Y
t-test
1 2
t=x −x 0.0010% 0.0011% 0.0022%
1
2 2 2
1 2
α
1 2
s s
t 2
n n
= +
0.0064% 0.0049% 0.0053%
t≤tα Y Y Y
Tab le 4. The results of stability of flavonoids CRMs.
Time interval Baicalein 5,7-dihydoxy flavones Naringenine
Zero month 99.27 99.50 99.53
One month 99.37 99.56 99.57
Three months 99.31 99.54 99.58
Six months 99.31 99.52 99.50
Twelve months 99.35 99.46 99.55
Average (%) 99.32 99.52 99.55
RSD (%) 0.04 0.04 0.03
Tab le 5. The results of uncertainty evaluation of flavonoids CRMs.
Uncertainty Baicalein CRM 5,7-dihydoxy flavones CRM Naringenine CRM
u1/% 0.01 0.02 0.03
u2/% 0.04 0.04 0.01
u3/% 0.36 0.33 0.50
u4/% 0 0 0
u5/% 0.06 0.06 0.06
u6/% 0.01 0.01 0.01
uc/% 0.37 0.34 0.50
k 2 2 2
U/% 0.8 0.7 1.0
Purity value/% 98.8 99.1 99.5
REFERENCES
[1] Arunachalama, J., Bleiseb, A., Mahwar, R.S., etal. (2006) The natural matrix reference material database of the In- ternational Atomic Energy Agency: Reference materials in support of dietary investigations. Journal of Food Composition and Analysis, 19, 241-249.
[2] Sander, L.C., Sharpless, K.E. and Wise, S.A. (2006) Die- tary supplement standard reference materials. Life Sciences,
78, 2044-2048.
[3] Chen, C.H., Huang, T.S., Wong, C.H., etal. (2009) Syn- ergistic anti-cancer effect of baicalein and silymarin on human hepatoma HepG2 Cells. Food and Chemical Tox- icology, 47, 638-644.
[4] Middleton Jr., E. and Kandaswami, C. (1992) Effects of flavonoids on immune and inflammatory cell functions.
Biochemical Pharmacology, 43, 1167-1179.
[5] Heim, K.E., Tagliaferro, A.R. and Bobilya, D.J. (2002) Flavonoid antioxidants: Chemistry, metabolism and struc- ture-activity relationships. Journal of Nutritional Bio- chemistry, 13, 572-584.
[6] The Directorate for the Quality of Medicines of the Council of Europe (2007) Establishment of reference standards, in European Pharmacopoeia. 5th Edition, Sup-plement 5.6, General texts 5.12.4, Council of Europe, Strasbourg.
[image:7.595.54.541.100.251.2] [image:7.595.55.542.278.380.2] [image:7.595.59.541.406.557.2]chemi-cal reference substance. In: International Pharmacopoeia, 3rd Editon, Vol . 5, Supplementary Information, Part A, 3.3, World Health Organization, Geneva.
[8] Liu, S.Y. and Hu, C.Q. (2007) A comparative uncertainty study of the calibration of macrolide antibiotic reference standards using quantitative nuclear magnetic resonance and mass balance methods. Analytica Chimica Acta, 602,
114-
[9] JJG1006-1994 (1994) Technical norm of primary refer-ence material of china. Beijing.
[10] Quan, H. (2002) Reference material and its application technology. China Standard Press, Beijing. (in Chinese) [11] Dai, X.H., Fang, X., Shao, M.W., Li, M., et al. (2011)
Certified reference materials (GBW09170 and 09171) of creatinine in human serum. Journal of Chromatography B,
879, 429-435.
[12] EURACHEM/CITAC Guide CG4 (2000) Quantifying uncertainty in analytical measurement. Seconded.
[13] Li, Y.X., Suo, Q.L., He, W.Z., et al. (2008) Separation and Purification and Structural Characterization of Bai-calein. Spectroscopy and Spectral Analysis, 28, 1895- 1899.
[14] NIST, NIST Chemistry WebBook.
[15] Wang, Y.G., Xie, S.W. and Su, W.W. (2005) Study on the chemical constituents of Polygonum chinese L. Journal of Chinese Medicinal Materials, 28, 1000-1001.
[16] Quan, C., Su, F.H., Wang, H.F., et al. (2011) Develop- ment of anabolic-androgenic steroids purity certified ref- erence materials for anti-doping. Steroids, 76, 1527-1534.