_ u .
mm
I
« IV.«¡!
»il«?.
VIIKW
Ρ!' l4Vil
S' Λ·'· ÌW4!».,
»ii
if EURATC l-ffllΙ-ΊΙ" :rt
SB
M
PHASE AND VELOCITY
'Affi
ι
h
' i j R t t m f i
mml
m
! < ■ · ■
DISTRIBUTION IN TWOPHASE ADIABA!
ANNULAR DISPERSED FLOW
Is
M
täta
sas
Wfl
IM
3".?W
P. ALIA, L. CRAVAROLO, HASSID and E. PEDROCCHI
/ (CISE)
K
¡**1<¡,Μ,
Äfft
t!!
m
k·* ·ΊΊ< ι■tin''
Μ·#Τί
Wir"*
»
fri»«
Hij ι:';«1»
;É
¡•«•IH
tai
1968
! **å"
I
■
m
■m
•yr·!1,
m<
filmm
itï'jÇbaiÎlies
¡ J "1* » LΓι* 'hi'iniiii
:·«!»»
i
SifiMHBiftffi^ïEURATOM/US Agreement for Cooperation » sfyj {jr ■■ · Λ jW l i wf I E t j f e f , ^■i'Hf'iji τ r Ι y f . fl ' M * J*JìT
EURAEC Report No. 1091 prepared by CISE
Centro Informazioni Studi Esperienze, Segrate (Milan) Italy Euratom Contract No. 060617 RDI
"uJüÍKb
This document was prepared under the sponsorship of the Commission of the European Communities in pursuance of the joint programme laid down by the Agreement for Cooperation signed on 8 November 1958 between the Government of the United States of America and the European Communiti
nor the Government of the United States, their contractors or any person acting on their behalf :
ake any warranty or representation, express or implied, with respect to the accuracy, completeness, or usefulness of the information con-tained in this document, or that the use of any information, apparatus, method, or process disclosed in this document may not infringe privately owned rights; or
Assume any liability with respect to the use of, or for damages resulting from the use of any information, apparatus, method or process disclosed in this document
This report is on sale at the addresses Usted on cover page 4
.vipftJ'r l'Itaci
DM 10. Lit. 1560
When ordering, please quote the EUR number and which are indicated on the cover of each report. eport.
y Guyot, s.a. Brussels, March 1968
EUR 3759 e
PHASE AND VELOCITY DISTRIBUTION IN TWO-PHASE ADIABATIC ANNULAR DISPERSED FLOW
by P. ALIA, L. CRAVARÓLO, A. HASSID and E. PEDROCCHI (CISE) European Atomic Energy Community - EURATOM
EURATOM/US Agreement for Cooperation EURAEC Report No. 1091 prepared by CISE
Centro Informazioni Studi Esperienze, Segrate (Milan) - Italy Euratom Contract No. 060-61-7 RDI
Brussels, March 1968 - 86 Pages - 35 Figures - FB 125
In the so-called annular-dispersed regime, the two-phase (gas + liquid) flow can be characterized by two main regions. In the first region (called "core"), located in the central part of the duct, the gas is the continuous phase while the liquid flows in the form of small droplets. In the second region, located close to the wall of the duct, the liquid is the continuous phase.
This report presents and discusses the phase distribution and velocity profiles in this regime, as they have been measured at CISE.
EUR 3759 e
PHASE AND VELOCITY DISTRIBUTION IN TWO-PHASE ADIABATIC ANNULAR DISPERSED FLOW
by P. ALIA, L. CRA VARÓLO, A. HASSID and E. PEDROCCHI (CISE) European Atomic Energy Community - EURATOM
EURATOM/US Agreement for Cooperation EURAEC Report No. 1091 prepared by CISE
Centro Informazioni Studi Esperienze, Segrate (Milan) - Italy Euratom Contract No. 060-61-7 RDI
Brussels, March 1968 - 86 Pages - 35 Figures - FB 125
In the so-called annular-dispersed regime, the two-phase (gas + liquid) flow can be characterized by two main regions. In the first region (called "core"), located in the central part of the duct, the gas is the continuous phase while the liquid flows in the form of small droplets. In the second region, located close to the wall of the duct, the liquid is the continuous phase.
Phase and velocity distribution in the core was determined by means of a probe which could operate either as a Pitot probe or as an isokinetic sampling probe. In the region close to the wall, the flow rates distribution was determined by means of a suitably-shaped isokinetic sampling probe. Thickness data of the "film region" have been also taken through an electrical method.
The experiments were carried out at high pressure (up to ~ 22 kg/cm2 abs.)
and room temperature with argon-water and argon-ethyl alcohol mixtures in adiabatic vertical upward flow in circular tubes (1.5 and 2.5 cm I.D.). The measurements were performed in a position 3.5 m far from the mixing section. At this position, the flow was found to be fully (or almost fully, in the case of the highest flow rates) developed.
Phase and velocity distribution in the core was determined by means of a probe which could operate either as a Pitot probe or as an isokinetic sampling probe. In the region close to the wall, the flow rates distribution was determined by means of a suitably-shaped isokinetic sampling probe. Thickness data of the "film region" have been also taken through an electrical method.
The experiments were carried out at high pressure (up to ~ 22 kg/cm2 abs.)
EUR 1 7 5 9
e
EUROPEAN ATOMIC ENERGY COMMUNITY - EURATOM
PHASE AND VELOCITY
DISTRIBUTION IN TWO-PHASE ADIABATIC
ANNULAR DISPERSED FLOW
by
P. ALIA, L. CRA VARÓLO, A. HASSID and E. PEDROCCHI
(CISE)
1968
EURATOM/US Agreement for Cooperation
EURAEC Report No. 1091 prepared by CISE
Centro Informazioni Studi Esperienze, Segrate (Milan) - Italy
SUMMARY
In the so-called annular-dispersed regime, the two-phase (gas I- liquid) flow can be characterized by two main regions. In the first region (called "core"), located in the central part of the duct, the gas is the continuous phase while the liquid flows in the form of small droplets. In the second region, located close to the wall of the duct, the liquid is the continuous phase.
This report presents and discusses the phase distribution and velocity profiles in this regime, as they have been measured at CISE.
Phase and velocity distribution in the core was determined by means of a probe which could operate either as a Pitot probe or as an isokinetic sampling probe. In the region close to the wall, the flow rates distribution was determined by means of a suitably-shaped isokinetic sampling probe. Thickness data of the "film region" have been also taken through an electrical method.
The experiments were carried out at high pressure (up to ~ 22 kg/cm2 abs.)
and room temperature with argon-water and argon-ethyl alcohol mixtures in adiabatic vertical upward flow in circular tubes (1.5 and 2.5 cm I.D.). The measurements were performed in a position 3.5 m far from the mixing section. At this position, the flow was found to be fully (or almost fully, in the case of the highest flow rates) developed.
KEYWORDS
TWO-PHASE FLOW GAS FLOW
LIQUID FLOW TUBES
DROPLETS VELOCITY CONFIGURATION PITOT TUBES INSTRUMENTS PRESSURE ARGON WATER ETHANOL
TABLE OF CONTENTS
Page
Abstract V Foreword V Acknowledgements VI
1. INTRODUCTION 1
2. EXPERIMENTAL It
3. GENERAL RESULTS 9
h. PHASE AND VELOCITY DISTRIBUTION CLOSE TO THE WALL 13
5. PHASE AND VELOCITY DISTRIBUTION IN THE "CORE" REGION l8
Nomenclature 21
References 23
Tables 25
Foreword
This i s the eleventh technical report issued by CISE and devoted to the experimental work performed under the CAN-2 Research Program on the hydrody-namics of two-phase adiabatic flow. I t presents and discusses the r e s u l t s of the experiments on phase and velocity d i s t r i b u t i o n in two-phase adiabatic annular dispersed flow.
The reports so far issued were devoted respectively to the following subjects:
- CISE R-59: design and construction of a high pressure gas c i r c u l a t o r for the new experimental f a c i l i t y .
- CISE R-53: pressure drop and film thickness data obtained with different channel geometries.
- CISE R-73: influence of some physical properties on pressure drop and film thickness.
- CISE R-75: design, construction and assembly of a high pressure experimen t a l f a c i l i t y .
- CISE R-89: development of a new instrument for the investigation of the phase and velocity d i s t r i b u t i o n in the region close to the wall.
- CISE R-82: development of a new instrument for the measurement of shear stress on the wall of a conduit and i t s application in mean density determination in two-phase flow.
- CISE R-92: development of a method for the measurement of the liquid volume fraction of two-phase two-component mixtures.
- CISE R-93: effect of entrance conditions and length on some hydrodynamics parameters.
- CISE R-IO5: l i q u i d volume fraction in two-phase adiabatic flow.
- CISE R-110: some spacer effects in annular and c l u s t e r geometries in annular dispersed flow.
Work on the hydrodynamics of two-phase flow was also carried out under the previous Research Program CAN-1: the r e s u l t s were presented and discussed in four t o p i c a l reports (CISE R-26, R-35, R-itl and R-U3) and in a special CISE Report ("A Research Program in Two-Phase Flow").
Acknowledgements
The authors wish to thank Prof. M. Silvestri for his useful criticism. They are also indebted to Mr. A. Colombo for his substantial contribution throughout the experimental work.
1 . INTRODUCTION
1.1. I t i s well known that many more flow patterns exist in two-phase flow than in single-phase flow. Without attempting here to distinguish and de scribe these various p a t t e r n s (which however may be quite vaguely defined) we shall limit our attention t o only one of them, the so-called
annular-dispersed flow.
For t h i s type of flow pattern a definition s l i g h t l y different from that commonly used up to now i s necessary. We shall s t a t e that annular-dispersed flow is characterized by a continuous gas phase and a discontinuous liquid phase in the central region of the duct, which w i l l be called "core", while j u s t the opposite condition exists in the so called "film" region, close to the wall. In f a c t , as explained below, recent experiments showed t h a t the gas volume fraction in the region where the l i q u i d is the continuous phase may be quite large and therefore the assumption t h a t the film region is e n t i r e l y occupied by the liquid phase i s no longer v a l i d .
The most important quantities characterizing the hydrodynamics of an nular dispersed flow, in fully developed conditions, a r e : l i n e a r gas and liquid velocity (U and U ) d i s t r i b u t i o n , l i q u i d (or gas) volume fraction (l->> or t) d i s t r i b u t i o n . Other i n t e r e s t i n g quantities of an i n t e g r a l nature are: pressure drop (ap/.iiZ), shear s t r e s s on the wall (τ ) , overall density (Γ), overall s l i p r a t i o (S) or overall l i q u i d volume fraction ( l - α ) . In addition, the knowledge of the amount of l i q u i d which i s flowing in the "film" region may be quite useful for i t s implication in the understanding of heat t r a n s f e r phenomena. All these q u a n t i t i e s depend on flowrates, on the physical properties of both phases and on geometry.
1.2. The experimental study presented here was carried out under the CAN-2 Research Program on the hydrodynamics of two-phase (gas-liquid) flow and was aimed at measuring the velocity and phase d i s t r i b u t i o n p r o f i l e s over a
cross section in annular-dispersed flow.
Work on the same subject was undertaken previously under the CAN-1 Program and the main r e s u l t s of t h i s investigation were presented in a
spe-Manuscript r e c e i v e d on January 22, I968
-ciai CISE Report . The experiments were performed in adiabatic conditions with a two-phase (argon + water) mixture flowing v e r t i c a l l y upwards in a
o
circular tube 2.5 cm I . D . ; the operating pressure (~22 kg/cm abs) was sele£ ted in such a way that the gas density was equal to that of saturated steam
2 . . .
at 70 kg/cm abs. The measured quantities were phase and velocity d i s t r i b u -tion in the core region of annular dispersed flow and the measurements were carried out by means of an isokinetic sampling probe moveable along a diame t e r which could be operated also as a Pitot probe; the probe was located ap_ proximately 1 m from the mixing section and the resulting velocity and phase distribution profiles were found to be strongly assymetrical. Iri addition, measurements have been taken of the thickness of the liquid film climbing over the wall.
The experimental study described in the present report i s the natural development of the work undertaken previously under the CAN-1 Program: i t s aim was to get a set of systematic experiments over a cross section where the flow configuration could be assumed as t h a t corresponding t o fully
de-• (2)
velopmed flow. For t h i s purpose an investigation has been made on the behaviour along length on a longer t e s t section than that available under
( o )
the CAN-1 Program (3-5 m against 1.5 m) .
The aim of the present investigation was· also to get a b e t t e r knowledge of the phase and velocity d i s t r i b u t i o n in the "film region" and in p a r t i -cular to determine the liquid flow rate in t h a t region, a parameter of primary importance for the understanding of heat t r a n s f e r in annular-di-spersed flow. A special probe was therefore devised for t h i s purpose.
1.3· The experimental studies described here were i n i t i a t e d at the beganning of 19Ô2 and were continued at intervals during a period of about l 8 months.
At the beginning very few similar studies could be found. Extensive investigations were available with air-water mixtures at atmospheric pressure
; since then, however extensive investigations have been published on phase and velocity d i s t r i b u t i o n both in the film and in the
( ° ) "core" region
F) .
An exhaustive review on the subject has recently been made by Collier • (9)
and HewittK y'.
-However, even at present, the available data with two-phase miwtures are very limited (at high pressure): this is due to the difficulties and
the time needed for carrying out such measurements, which is very large. Perform ing experiments at high pressure is of the utmost importance: gas density
in fact plays quite an important role on the hydrodynamics behaviour (12)
of the two phase flow (see for example where the influence of gas density on the "thickness" of the film region has been brought out).
Simultaneously with the present experiments and on the basis of the results of the present investigation, measurements have been made with steam-water mixtures both in adiabatic conditions and with heat addition The results of these experiments are in good agreement with those obtained with two component mixtures in the present investigation.
-2. EXPERIMENTAL
2 . 1 , The experiments were c a r r i e d out with the experimental f a c i l i t y already
i n s t a l l e d at CISE for studying the hydrodynami<■·? of twophase (gas+liquid) mixtures in adiabatic flow. A schematic flow sheet of the c i r c u i t , which has
(3) · ·
been described in d e t a i l in ref. , JLS given in f i g . 1.
The twophase miwture i s formed in a teemixer with the gas entering
the run s i d e ; the l i q u i d i s injected through an annular s l o t with an adju
s t a b l e aperture . After passing through a calming section (50 cm long)
the mixture enters the v e r t i c a l t e s t s e c t i o n . At the t o p , the t e s t section
leads i n t o a high efficiency s e p a r a t o r , c o n s i s t i n g of t h r e e d i f f e r e n t devices
in s e r i e s , from which each separated phase r e t u r n s to i t s own c i r b u i t .
2 . 2 . As s t a t e d , the measured q u a n t i t i e s are:
thickness (s) of the film adhering to the wall over a given length of the
t e s t s e c t i o n ;
phase and v e l o c i t y d i s t r i b u t i o n p r o f i l e along a cross section diameter.
The value of the thickness (the s o c a l l e d " e l e c t r i c film t h i c k n e s s " )
has benn derived from the measurement of the e l e c t r i c a l r e s i s t a n c e of the
l i q u i d l a y e r over a given length of the t e s t section (made of an i n s u l a t i n g
m a t e r i a l ) as well as of the r e s i s t i v i t y of the c i r c u l a t i n g l i q u i d .
The phase and velocity d i s t r i b u t i o n was measured by means of two d i f f e r e n t
sampling probes. In the c e n t r a l region (up^to 2 mm from the wall) a small
c y l i n d r i c a l sampling probe was used : i t was operated in turn as an i s o ( ° )
k i n e t i c probe (thus giving the local s p e c i f i c mass flow r a t e of both
phases G, and G ) and as a P i t o t tube (thus giving the impact p r e s s u r e _P ) .
L R "D
The aperture was fixed at 2.77 mm for all the experiments.
(°)
.
.
.
Making c e r t a i n assumptions on t h e behaviour of a P i t o t tube i n two-phase flow, t h e following e q u a t i o n was d e r i v e d for t h e l o c a l value of 1 - <*:
1 - α =
2 ΛΡ o. G 2 .% 2 VG ; r
<ζ 1 g
where ΛΡ is the impact pressure. Local velocity of the two phases and local liquid (or gas) volume fraction, may thus be computed from the measured quan tities by utilizing the above relationship.
The sampling probe used in the present experiments is similar to the probe N. 2 employed previously : a schematic drawing, showing the main
dimensions, is reported in fig. 2. The device for the introduction and pos_i tioning of the probe was completely re-designed with respect to that used in
: the new device (figs. 3 and it) gives a much higher accuracy in the radial position and considerably reduces the time needed for the measurements.
In the region close to the wall (from 0.13 mm up to 2 mm from the wall) a suitably shaped (figs. 5>6,7) sampling probe was used, which has been
. (It) . ' . . .
exhaustively described in ; it was always operated as an isokinetic probe (see footnote page It ). This probe gives the integrated flow rate between the wall and a distance variable at will: in this region the local slip ra-
• (°)
tio was always supposed to be unity and therefore the local volume fraction may be strainght-forwardly computed from the local flow rates.The errors inherent in the measurement methods have been discussed in detail in and . As far as the phase distribution and velocity profiles are concerned the following remarks can be made:
- The reliability of the two probes and of the measurement procedure was checked by performing special experiments with single phase (gas) flow.
Vn .
This appeared reasonable in view of the small size of the gas bubbles likely to be present in the film region (3.2) and also because in bubble flow the slip ratio is very close to unity.
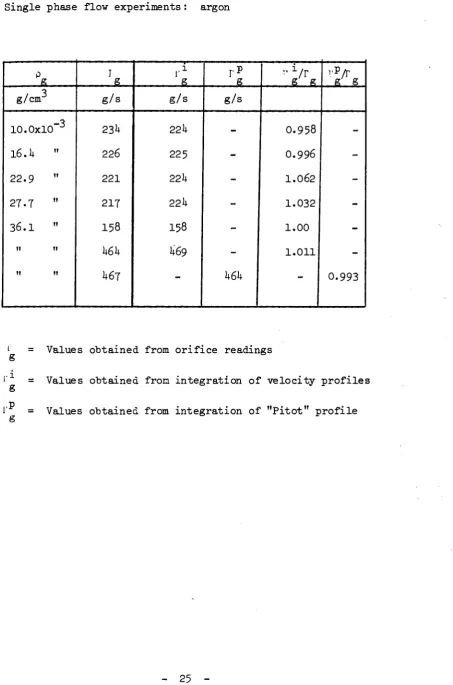
-The total flow rates obtained through an integration process from the ve
locity profiles r are compared to the orifice readings Γ in table I. As
g ë
shown, the maximum deviation from the orifice reading for the experiments with isokinetic sampling probe is 6$ while must of the results lie within + 2$, which is the orifice accuracy. As for the experiments with the Pitot probe, at least for one point for each profile a check was made that the reading was equal, within the experimental inaccuracy, with the isokinetic sampling datum; moreover for one profile a check was made that the inte grated mass flow rate would agree with the orifice reading (Table I ) .
An idea of the accuracy of the local values of liquid., and gas specific mass flow rates with twophase flow can be given, as in the single phase flow case, by a comparison between the integrated values of both flow rate di stributions and the orifice readings. Such a comparison is made in table II. Although the agreement between the two sets of values (on the average _+ 10$ for both phases) is worse than in the case of single phase flow,
it can be considered still satisfactory.
From this comparison the conclusion can be inferred that, at least the G and G distribution profiles are accurate within +_ 10$ on the average. The local values of liquid volume fraction (and any related quantity) are affected by the inherent unknown inaccuracy of the relationship linking 1α to ΔΡ , Gn and G · Ref. (l) has demonstrated that the error inherent
Ρ 1 g
in the 1α values can be quite large (10 to 50$)). To get a rough idea of this error a comparison was also made between the values integrated from the Iα profiles, and the experimental values of Iα obtained directly
• · (Ik)
from the liquid level method . As shown in table III the agreement be
tween the two sets of values is on the average within 10$ (in general the l_a values derived from the integration of the profiles are slightly lower than the other ones; this might be due to the fact the local slip ratios derived from the said relationship are actually relatively larger or that the 1α values obtained with the liquid level method are higher; this could be possible since these data are overall data relevant to the whole test section and it has been observed that Iα undergoes a decrease along
flow direction (ll).
2 . 3 . The experiments were performed with argonwater and argonethyl alcohol mixtures at various gas d e n s i t i e s in order t o i n v e s t i g a t e the influence
( ° )
of the two physical p r o p e r t i e s (gas density and surface tension ) which (32) have been observed to have most influence on the twophase flow behaviour " .
The physical p r o p e r t i e s of these mixtures are i n d i c a t e d in t a b l e IV.
Temperature of the t e s t section was between 18 and 20 °C.
Two c i r c u l a r conduits were experimented, 2.5 cm I . D . and 1.5 cm I.D.
(with 1.5cm I.D. element only film thickness measurement have been made).
The i n v e s t i ^ i t e d range of flowrates i s reported in t a b l e V.
Assuming a symmetry around the axis of the duct, the problem s t i l l
remains of determining whether the flow i s fully developed, t h a t i s the
measured q u a n t i t i e s are independent of the a x i a l coordinate. This aspect was (2)
throughtly i n v e s t i g a t e d under previous s p e c i a l t e s t s : the systematic meas urements described here were always performed so far from the two phase mixer ("'35m)that a x i a l (or memory) e f f e c t s were e i t h e r n e g l i g i b l e or minimized, as the t e s t s have shown.
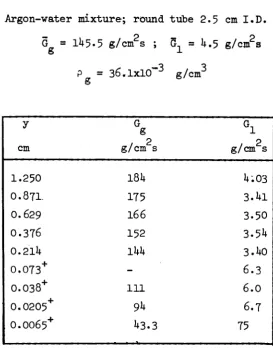
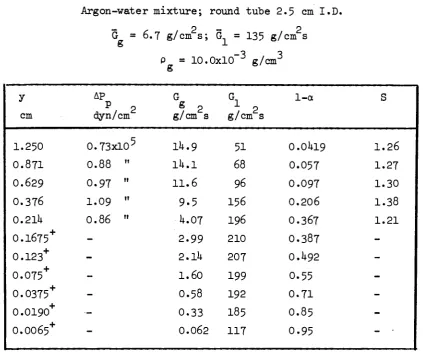
2.k. The experimental r e s u l t s are given in t a b l e s VI, VII, VIII for the film thickness experiments and in the t a b l e IX t o XXV as far as phase d i s t r i b u t i o n
and v e l o c i t y p r o f i l e s are concerned.
In t a b l e s VI, VII and VII"thè following q u a n t i t i e s have been r e p o r t e d :
G average gas s p e c i f i c mæs flowrate (= gas flowrate divided by the
o
tube cross section area) (g/cm s)
G : average l i q u i d specific mass flow r a t e (= l i q u i d flowrate divided by
the tube cross section area) (g/cm s)
s : e l e c t r i c a l film thickness (cm)
In t a b l e s IX to XXV the following q u a n t i t i e s have been r e p o r t e d :
"ΠΤ
(°)
The experiments at various gas d e n s i t i e s were c a r r i e d out a t the same volume flow r a t e due t o the blower c h a r a c t e r i s t i c s ^ ; which do not allow operation a t constant mass flow r a t e .
With argonethyl alcohol mixtures film thickness could not be measured due t o the l i q u i d conductivity being too low.
-y : distance from the conduit wall (cm). For the experimental points ob tained with the film sampling probe (signed with in the y column) the distance y corresponds to the average between two adjacent values of the probe position. For the core sampling probe experiments y in dicates the distance from the wall of the centre of the probe
y' : distance from the conduit wall (cm) "(only for the film sampling probe position
2 VP : impact pressure (as from Pitot probe readings) (dyn/cm )
G : local gas specific mass flowrate (= gas sampling flowrate divided by
g 2 the probe cross section area) (g/cm s)
G, : local liquid specific mass flowrate (= liquid sampling flowrate divi_d 2
ed by the probe cross section area) (g/cm s) 1-ra : local liquid volume fraction
S : slip ratio (only for the measurements with the core sampling probe) Γ : liquid flowrate in the annular area comprised between the conduit
wall and the circumference having a radius = R - y'
^ : gas flowrate in the annular area comprised between the conduit wall and the circumference having a radius = R - y'.
The experimental results are also given in the form of diagrams: film thickness measurements are reported in figs. 8,9 and 10 while phase distri bution and velocity profiles are given in figs. 11 to 27·
-3. GENERAL RESULTS
A typical diagram of the local values of some measured quantities over
a cross section as a function of the radial coordinate is shown in fig. 28,
to which reference is made throughout this paragraph unless otherwise
stated.
3.1. The liquid volume fraction distribution has a minimum in the center
of the duct: this was found over the whole range of flow rates and physical
properties investigated, provided the flow pattern is annulardispersed.
From this minimum the value of 1'' increases going toward the wall and
reaches unity in a region comprised between y = 0 and y = 0.13 mm, which is
our instrument limitation. No discontinuity is revealed along the radial
coordinate even at the core film interface. Flattening of the Iα profile,
with which à higher degree of dispersion is believed to be associated',
depends on the magnitude of the flow rates and on the physical properties of
both phases.
3.2. As expected from the shape of the 1 » profile the local value of the
liquid specific mass flow rate G also has a minimum on the conduit axis
and increases toward the wall. The trend however is not always monotonous
and a relative minimum may exist not far from the "film" region. The maximum
value of G is always very close to the wall and well inside the "film"
region. At the wall G is always supposed to be zero.
Similar qualitative results were observed by authors, at least in the
core region . The British team at Harwell , however, operating
with airwater mixtures at nearly atmospheric pressure, found that the G,
profile given flatter and flatter when increasing the distance from the
entrance until an inversion appeared with a relative maximum on the con
duit axis. The consequence in this case is that the 1α profile is almost
flat in the whole core region.
As stated, all the present measurements were performed at 35 m from
the entrance. At this distance the Harwell experiments already show a
convexity in the G profile. As has already been examined by Hewitt and
(2) . .
discussed in a previous CISE Report , a number of reasons explaining such a discrepancy can be invoked, for example:
1) difference in gas velocity: the average gas velocity (20-30 m/s) beyond which the Harwell team found a change in concavity i s in general higher than the average gas velocity of the present experiments. This, however, i s in contrast with the profile reported in f i g . l 6 , which has been taken at 3·5 m from the entrance and to which a gas velocity equal to 37 m/s corresponds.
2) difference in gas density: the different gas density (and gas compressi b i l i t y ) in the two sets of experiments could play an important role e i t h e r because the rate of progress towards equilibrium is different or because i t i s p r a c t i c a l l y impossible, as s t a t e d , to distinguish the effect i n t r i n s i c to the mixture from the effect due to the gas density variation along flow direction. The effect of gas density has been investigated, at l e a s t to
a certain extent, with argon-water mixture (par. 3>h) at a gas density
-3 3
equal to Ρ = 10.0x10 g/cm and with the following flow rate combination: — 2 — 2
G = 2 2 . 6 g/cm s G = 91 g/cm s
g 1
As shown in Fig. 21, the results are almost identical (at the same gas -3 3
velocity approximately) to that obtained at Ρ = 36.1x10 g/cm , i.e. the G profile has a concavity that is always directed upwards.
This, however, is not enough to exclude the difference in gas density as the reason for the discrepancy, since (1) the gas density investigated is still much larger than that of air at atmospheric pressure, (ii) the gas velocity is lower than the aforesaid limit of 20-30 m/s, and (iii) the
pressure drop is still negligible in comparison with the operating pressure. 3) difference in length: the available length of the Harwell test element is
about 30$ larger than the one available in the facility referred to in this report. This however should be only a minor effect since the change in concavity is much lower than the length investigated here.
In addition to these remarks it must be observed that the liquid flow rates covered in our experiments are larger than those experience at Harwell ' . According to the observations of that Laboratory, the change
in shape of the G.. profile is the more pronounced the larger G . In our case therefore, there is more reason to observe such a change.
In conclusion, since, as stated previously, the experiments reported here indicate that at the top of the test section, the flow configuration is quite close to the fully developed one, the discrepancy between the two results should be ascribed mainly to the different operating pressure and, therefore, to the gas density. In any case the question still remains open: in order to get a definite answer, it would be necessary to carry out experiments with longer test sections, varying the inlet conditions so drastically as to
rea-lize at the entrpnce, for a given flow rate combination, quite different
flow configurations. The experiments should be of course carried out at high pressure so as to minimize the gas density variations along flow direction
3.3· Gas velocity profiles (U ) are similar to those found in single phase flow: usually, however, they are steeper, depending on the value of flow rates and physical properties of both phases. Both roughness due to the irregularities at the core-film interface and damping of turbulence by liquid droplets could contribute to this phenomenon.
3·^· Local values of the slip ratio were measured only in the core region·: they range between 1 and 1.6 with a slight tendency to increase toward the wall. If the hypothesis is made that S is unity very close to the wall (see 1.1), its value must go through a maximum at the liquid gas interface.
The local values of slip ratio in the central region decreases with increasing gas density (at constant volume flow rate) as well as with de-creasing surface tension, i.e. the flow has a tendency to become locally more homogeneous.
TT
Another interesting difference between the results obtained at CISE andHarwell is that, while in our case the whole flow pattern is involved in the variation along flow direction (both liquid film thickness and en-trained liquid profiles change along the flow direction), in the Harwell experiments each of the two regions seems to behave on its own. Film thickness in fact does not vary, while, inside the core, the entrained liquid increases in the centre to the detriment of the region of the core close to the film region.
-On the whole, it can be inferred from the low values of slip ratio which have been measured, that the assumption of a locally homogeneous flow is not unreasonable.
-lt. PHASE AND VELOCITY DISTRIBUTION CLOSE TO THE WALL
l t . l . Reference i s made t o f i g . 29 where t h e l o c a l v a l u e s of t h e r a t i o — *E ♦ ""* /"■ —
U /U = G /G* = G /ale /a f o r a s i n g l e t y p i c a l case i s r e p o r t e d , g g g g g / g
From t h i s diagram i t a p p e a r s t h a t t h e curve has somewhat a r e g u l a r t r e n d on b o t h s i d e s of a r e g i o n l o c a t e d around t h e e l e c t r i c a l f i l m t h i c k n e s s b o t h i n t h e c o r e and i n t h e f i l m r e g i o n . I n q u a n t i t a t i v e terms thi?3 a p p e a r s t o be
"" * —ál·
t r u e f o r y < s / 2 and y > 2 s ; w h i l e f o r s / 2 < y < 2 s , U /U p r e s e n t s an g g
ambigous t r e n d . A c t u a l l y t h i s might c o r r e s p o n d t o an ambigous t r e n d a i t h e r
J¿
of U /U , or of the slip ratio which, in this region, ought to be assumed g 6
to be equal to one (see 2.1.). This setup, which is evident in most cases,
disappears for low mass flow rates and gas density; moreover, with liquids
having low surface tension (ethyl alcohol), for some unknown reason, the
inflection region appears further inside the electrical film.
Another phenomenon, which was always observed, was a maximum in the
G /G diagram (fig. 29), approximately at a distance from the wall corre
sponding to s/2. This maximum, the shape of which depends on the physical
conditions (flow rates and physical properties), is believed to be related
to a steep increase of the gas volume fraction at a distance larger then
s/2.
This fact, together with what was said above the U /U trend between
g g
s/2 and 2 s, seems to confirm the assumption that in this region a tran
sition takes place between the "film" and the "core" regions. Moreover, it
is reasonable to presume that most of the waves which set up at the film
core interface (which have been extensively investigated by other resear
chers) are confined in this region: this is not in contrast with what has
been observed elsewhere it.2. The value of 1 α in the region close to the wall (derived through the
assumption that the local slip ratio is equal to one (par. 22), decreases,
monotonously from unity at the wall (or, at least, in the uninvestigated
region where y <_ 0.13 mm) to about 0.6 + 0.8 in correspondence with the maximum of G and 0.3 + 0.5 at the electrical film thickness. Then, the
liquid volume fraction decreases toward the center (with water always and
with alcohol at low G values), or, for alcohol at high G values, reaches
g g
a relative maximum before decreasing again towards the center.
As a consequence, the overall gas volume fraction in the "film" region
can be rather high: up to y = s this value ranges between 0.2 and 0.55
with a tendency to increase with increasing flow rates. The assumption that
1 α= 1 up to y = s in order to evaluate the density of the mixture (1.2)
from the values of s and the phase distribution in the core can therefore
largely overstimate (about 10+20$) this quantity.
The large values of α that are found well inside the film region, cannot
be explained merely by the wavy nature of the filmcore interface, but it
must be imagined that in this region the gas phase is present in the form
of small bubbles. In the light of this consideration, also taking into ac
count the fact that a profile configuration and not just a number would be
necessary to individuate the corefilm interface, the realtionship between
the electrical film thickness and the actual extension of the region in
which the liquid is the continuous phase cannot be established. The useful
ness of the determination of s, however, does not lose all its value, in our
opinion, since it still gives an idea of the extension of the film region.
it.3. A parameter of interest, also for its connection with the heat tran
sfer capability of two phase flow, is the amount of liquid which flows
along the wall in the "film" region (which has been investigated with the
film probe).
In single phase flow the ratio Γ /π D μ, where Γ is the mass flow
rate up to the distance y from the wall, in circular conduits, is given by:
r
■ Ï - = f (y+. *e+) (D π D μ
where
+ y
y = * τ ρ u w
-Κ
e μ ρ
In plane geometry, or in c i r c u l a r geometry when *-<< 1, —£— becomes + R D a function of y only, so t h a t :
Γ = TD μ f(y+) (2)
•J
To check the v a l i d i t y of t h i s formula in two-phase flow, the r a t i o Γ
—^— was p l o t t e d (fig. 30) against y (where y = ^ UT ρ,) for a l l the
τ D μ-ι μ-j ™ W 1
p r o f i l e investigated, i . e . for argon-water and argon-alcohol mixtures at two + +
gas d e n s i t i e s . Apparently, also m two-phase flow up to y - s the r a t i o
riy · +
i s a function of y only, although different from single-phase flow.
η D •Ί
Beyoijd t h i s value ;, n , has in general a tendency to be lower than the
value expected following the correlation valid for y <_ s .
Since, for the reasons stated above, a t r u e film region cannot be well Γ
defined from our experimental r e s u l t s , the correlation between ly ■* D μ
and y i s not enough to give the "film" flow r a t e . However, as a f i r s t
approximation, j u s t t o have an idea of the magnitude of t h i s quantity and
of i t s dependence on the physical p r o p e r t i e s and flow r a t e s , one can assume
as "film" flow r a t e the l i q u i d flow r a t e (Γ ) measured up t o y = s. In the
l i g h t of previous c o n s i d e r a t i o n s (4.2), t h i s value should not be very dif
ferent from the a c t u a l "film" flow r a t e . The r e s u l t s , for a l l the i n v e s t i
Γ
gated c o n d i t i o n s , a r e presented in f i g . 31 where the r a t i o F " D u
+ Ξ I
•is reported against s = π— VI τ 0 on a loglog c h a r t . This r a t i o seems
• , · W l
-f. _(.
to be well correlated to s (for 30 < s < 300) through the equation:
=
5.3
(sV'
1(3)
D 1
The constant 5·3 and the exponent 1.1 seem t o be independent of the
flowrates and the physical p r o p e r t i e s i n v e s t i g a t e d (gas d e n s i t y , surface
tension and, t o a c e r t a i n e x t e n t , l i q u i d density and v i s c o s i t y ) .
Equation (3) is quite a simple relationship which allows, within the
approximation of the above assumption, the determination of Γ once s
and τ are known. It must be kept in mind, however, that nothing can be
w
said about the influence of the diameter of the conduit on the film flow
rate since this variable was not investigated. The presence of D in eq.
(3) could not therefore represent the actual dependence on D.
For the abovestated reasons, the corefilm interface should be com
prised between s/2 and -2 s. If the same plot of fig. 31 is made for these two values, the experimental points become more scattered but the
overall trend versus 1/2 s 'or 2 s , that is, the value of the exponent
(l.l), is preserved. It may be inferred, therefore, that the dependence
of '_ on flow rates and physical properties is well represented through
the parameter s . Of course, this is true only if the ratio between the
electrical film thickness and that distance from the wall where Γ ¿s
iy equal to the actual "film" liquid flow rate does not depend largely on
these parameters. |.
F For purposes of comparison, the same figure shows the quantity ^—^
-1
t -, o \
as evaluated (i) according to the Dukler analysis modified by Hewitt
and (ii) assuming as still valid in the film region the velocity profile
proposed by von Karman in single phase flow. Since, according to these theories
lF . . + '
the ratio ——— is not a function of y only^ two curves are reported
" 1
which represent the extreme limits within the range investigated. As an average
value, the value predicted by these theories are overstimated (ItO + 60$)
in comparison with the experimental values (for 30.1 s £ 300).
3.6. The dependence of the "film" flow rate (r„), as defined above, on the forced flow rates and on physical properties has been determined from
the experimental values of s and τ by evaluating this quantity through w
equation (3)·
The r a t i o Γ/Ι' with argonwafer mixtures at Ρ = 36.1 χ 10 g/cm
t l g
i s presented in f i g . 32 as a function of the mass q u a l i t y (X) and with
the t o t a l s p e c i f i c mass flow as a parameter. This r a t i o , which varies from
0.1 t o O.U, decreases with increases in both G and X.
Since, at constant mass flow r a t e , the shear s t r e s s on the wall was found proportional t o "JT" a n d t h e e l e c t r i c a l film thickness t o .
r.' , the influence of gas density on s , hence on film flow r a t e , g
i s n e g l i g i b l e .
Surface t e n s i o n , on the contrary, influences t h i s quantity because, as (19) (12)
shown by our experimental r e s u l t s , both τ and s decrease with +
V
i t as do s and "_. This effect i s more pronounced at high values of mass
Γ
quality and flowrate.
-5· PHASE AND VELOCITY DISTRIBUTION IN THE "CORE" REGION
5.1. In the whole range investigated, the liquid volume fraction in the "core" region always has a minimum in the center of the duct. An analytical expression, however, cannot easily be found and monomial expressions, as that proposed by Bankoff , are not satisfactory. A general observation is that the (l- a) profile tends to flatten with:
a) increasing flow rates;
b) increasing gas density at constant volume flow rate; c) decreasing surface tension.
As the (l- α ) profile becomes more flattened, the absolute value in the "core" region increases, which is indirect evidence of a more "disperjs ed" pattern.
The upward concavity of the (l-α) profile as a function of y still shows that, provided fully-developed flow is established, droplet diffusion is not the predominating mechanism for liquid distribution in the "coré" region. Other mechanisms should therefore be called upon and their concepts analytically assessed.
S. Levy, for example, described the phase and velocity distribution analytically, treating the two-phase system as a continuous medium and applying to it the mixing length model widely accepted in single-phase
(21)
turbulent flow . Although some assumptions made during the development of this theory do not correspond in our cases to the experimental evidence, the predicted values both of the density (or l-α) profiles and of the mean density are in rather good agreement with the experimental values, especial ly at the high gas flow rates. As an example, fig. 33 shows the experimen tal profile of Ρ compared with that computed from the Levy mixing length model, assuming as inlet parameters the values of liquid and gas flow rates
and of shear stress on the wall.
Another process which might explain the trend of l-α is that of droplet coalescence, that is of capture of the droplets among themselves, which was proposed previously . The analytical treatment presents, however,
serious difficulties.
-5.2. As s t a t e d e a r l i e r , the gas velocity p r o f i l e s are always less flattened than in single-phase flow, the gas Reynolds number being equal. The higher the gas flow r a t e s the greater the flattening while there i s a certain degree of independence on the l i q u i d flow r a t e . Physical p r o p e r t i e s , t o o , have an influence on the shape of the U /U p r o f i l e : as shown in f i g . 39
g g
flattening increases with increasing gas density (at constant volume flow r a t e ) and with decreasing surface tension.
The experimental r e s u l t s show t h a t there i s a close r e l a t i o n s h i p be tween the shape of the gas velocity p r o f i l e and the value of the film thick ness, whatever the gas flow r a t e , gas density and surface tension: film
thickness i s l a r g e r for the steeper p r o f i l e s . On the other hand, larger (17)
film thicknesses would be associated with l a r g e r surface waves at the core-film interface corresponding t o a greater apparent roughness of the duct in which the gas i s flowing. This apparent roughness can therefore be taken to be p a r t l y responsible for t h i s effect in single phase flow where a higher degree of roughening i s associated, at the same Reynolds number, with steeper velocity p r o f i l e s .
The assumption t h a t the larger steepness of the gas velocity profiles in two-phase flow i s due to the presence of l i q u i d in the "core" region, in the form of small droplets damping the turbulence of the gas flow, seems to be in contrast with the experimental evidence: in fact i t was always ob served (with varying G , ρ , γ) t h a t the steeper the p r o f i l e , the smaller
g g
the value of l-α in the central region. However, since an increase of film
thickness i s always associated with a decrease of l - ati n the core, the assuimo
tion cannot be excluded a p r i o r i .
5.3. In single phase flow, a law representing the velocity p r o f i l e in the central region of the duct f a i r l y well i s the so-called "velocity deficiency law" :
Uo - U (°)
-~=r = f (y/R)1 ' (H)
T
5! — :
U is the velocity at the center of the conduit.
-A suitable expression of f(y/R), valid both for smooth and rough ducts is the following:
f (y/R) = 1/k In |
where k, the von Karman constant, is-equal to O.k.
Almost a l l the gas velocity p r o f i l e s determined in two-phase flow obey the same law, as shown in f i g . 35 for five p a r t i c u l a r cases. The nu merical values of k i s , however, lower ^ 0 . 2 7 for argon-water mixtures and *v 0.31 for argon-alcohol mixtures) in agreement with the experimental r e s u l t s
obtained elsewhere with air-water mixtures at atmospheric pressure . As a consequence, the mixing length which, as defined in single phase flow,
i s proportional to k, i s also lower: t h i s could be i n t e r p r e t e d as a lower degree of turbulence in the "core" region of two-phase dispersed flow.
TT
The value of ρ in eq. k was put equal to ρ .-Nomenclature
Latin symbols
A cross sectional area of the t e s t section D diameter of the t e s t section
G* local mass velocity (G* = jJLS ; G* = ^
i
^ ) =T T ^
G local specific mass flowrate (G = —*— ; Gn = /
g σ 1 σ
Γ Γ,
_ jfc f - & S — iL, ι
G^ average mass velocity IG = d » G, = )
g αΑ (lã)A
Γ Γ
G average specific mass flowrate (G = —* ; G = — r )
Q
υ
g
Γ '■'
volume flowrate (Q = S. ; o = — )
R radius of the test section
s electrical film thickness
S local slip ratio (S = U /Un) g_ 1_
S overall slip ratio (S = 0 /0 )
(Γ ) (Γ )
U local linear velocity (Ug = ^ _ ; ϋχ = ^ 5 ^ )
(Γ ) (Γ )
U*' local superficial velocity (U* = σ f S ; U * = ~,S
g g 1 Pi
U average linear velocity (U = —û ; U = _—
g «Α Χ (la)A
S.
-
Ql
average superficial velocity (U = —r ; 0. = r ) X mass flow rate quality (or mass quality) (X = r ' ξ r
g 1
0.
X volume flow rate quality (X = 7:—f■ Λ )
ν ν fcj.. + ti
1 g
y distance from the wall of the conduit
Greek symbols
α local gas volume fraction α overall gas volume fraction Y surface tension
Γ mass flow rate U viscosity Ρ local density
cross sectional area of extraction probe inlet
σ
τ shear stress of the wall of the conduit w
Subscript
F film g gas 1 liquid s probe
tot total (gas+liquid)
-References
1. "A research program i n twophase flow" CISE Report (January 1963 ) ·
2 . L. Cravarolo, A. Hassid, E. Pedrocchi: "Further i n v e s t i g a t i o n on
twophase a d i a b a t i c annulardispersed flow: e f f e c t of length and of
some i n l e t conditions on flow parameters". CISE Report R 93 (196I1).
3. N. Adorni, L. Cravarolo, A. G i o r g i n i , A. Hassid, E. Pedrocchi:
"Design and construction of a high p r e s s u r e f a c i l i t y for hydrodynamics
experiments on two phase flow. Instrumentation. Preliminary t e s t s in
single and twophase flow". CISE Report R 75 ( I 9 6 3 ) .
It. N. Adorni, P. A l i a , L. Cravarolo, A. Hassid, Ë. Pedrocchi: "An i s o k i
n e t i c sampling probe for phase and v e l o c i t y d i s t r i b u t i o n measurements
i n twophase flow near t h e wall of t h e conduit". CISE Report R 89
(1963).
5· J.G. C o l l i e r , G.F. Hewitt: "Data on the v e r t i c a l flow of a i r w a t e r
mixtures i n t h e annular and dispersed flow r e g i o n s . Part I I : Film
t h i c k n e s s and entrainment data and analysis of pressure drop measure
ments". .Trans. I n s t . Chem. Engrs. 39, 127 ( l 9 6 l ) .
6. M. Wicks, A.E. Dukler: "Entrainment and p r e s s u r e drop i n concurrent
g a s l i q u i d flow". A.I.Ch.E. J . _6, k63 ( i 9 6 0 ) .
7· P.G. Magiros, A.E. Dukler: "Entrainment and p r e s s u r e drop i n con
current g a s l i q u i d flow. I I : l i q u i d property and momentum e f f e c t s " .
Developments in Mechanics Vol. I , Plenum P r e s s , New York (1961).
8. G.H. Anderson, B.G. Mantzouranis: "Twophase (gas+liquid) flow pheno
mena. Liquid entrainment". Chem. Eng. S c i . J+, 12, 233 ( i 9 6 0 ) .
9· J.G. C o l l i e r , G.F. Hewitt: "Measurement of l i q u i d entrainment"
B r i t i s h Chem. Eng. IL, 1 1 , 1375 (1966).
10. Ν. Adorni, G. Peteriongo, R. Ravetta, F.A. Tacconi: "Large s c a l e ex
periments on heat t r a n s f e r and hydrodynamics with steamwater mix
t u r e s : phase and v e l o c i t y d i s t r i b u t i o n measurements in a round v e r t i c a l
tube" CISE R 91 (196U).
11. P. A l i a , L. Cravarolo, A. Hassid, E. Pedrocchi: "Liquid volume f r a c t i o n
i n a d i a b a t i c twophase v e r t i c a l upflowround conduit" CISE R 105 (I965)·
12. L. Casagrande, L. Cravarolo, A. Hassid, E. Pedrocchi: "Adiabatic d i -spersed two-phase flow: further r e s u l t s on the influence of physical properties on pressure drop and film thickness. CISE R 73 (1963)· 13. P. Alia, L. Cravarolo, A. Hassid, E. Pedrocchi, M. S i l v e s t r i : "A
volume displacement method for measurements on the l i q u i d volume fraction in two-phase adiabatic flow". CISE R 92 (I96U).
lit. L. Cravarolo, A. Hassid: "Phase and velocity d i s t r i b u t i o n in two-phase adiabatic dispersed flow". Presented at the European Atomic Energy Society Symposium on two-phase flow, steady s t a t e burnout and hydro-dynamic i n s t a b i l i t y . Studsvik, Sweden, l s t - 3 r d October, I963, CISE Report N. 98.
15. L.E. G i l l , G.F. Hewitt and J.W. Hitchon: "Sampling probe studies of the gas core in annular two-phase flow". Part I , "The effect of length on phase and velocity distribution" AERE R 395k (1962).
16. G.E. Hewitt: "Heat transfer and fluid flow in two-phase systems". AERE R it586 (196IO.
17· G.F. Hewitt, R.D. King, P.C. Lovegrove: "Techiniques for l i q u i d film and pressure drop studies in annular two-phase flow" AERE R 3921
(1962).·
l 8 . G.F. Hewitt: "Analysis of annular two-phase flow: application of the Dukler analysis to v e r t i c a l upward flow in a tube" AERE R 368O (1961). 19· L. Cravarolo, A. Giorgini, A. Hassid, E. Pedrocchi: "A device for the
measurement of shear stress on t h e ' w a l l of a conduit. I t s application in the mean density determination in two-phase flow. Shear s t r e s s data in two-phase adiabatic v e r t i c a l flow". CISE R 82 (196U).
20. S.G. Bankoff: "A variable density single-fluid model for two-phase flow with p a r t i c u l a r reference to steam-water flow". Trans. ASME, Journal of Heat Transfer, Nov. i960.
21. S. Levy: "Prediction of two-phase pressure drop and density d i s t r i b u t i o n from mixing length theory". Trans. ASME, Journal of Heat Transfer, May 1963.
-TABLE
Single phase flow experiments : argon
Ρ g
g/cm
lO.OxlO"3
l 6 . i t "
22.9 "
27.7 "
3 6 . I "
Il tl
It It
I g g / s
231+
226
221
217
158
k6k
lt67
l ·1
g
g / s
22 lt
225
22U
22U
I58
lt69
-g
g / s
-k6k
g g
0.958
0.996
1.062
1.032
1.00
1.011
g' g
-0.993
L = Values obtained from orifice readings
l' = Values obtained from integration of velocity profiles
g
1' = Values obtained from integration of "Pitot" profile
-TABLE I I Two phase flow e x p e r i m e n t s ; round t u b e 2.5 cm I . D .
ΟΛ
MIXTURES
A r g o n w a t e r It tl
tt It
II II
tt tl
II II
II It
It II
It II
A r g o n A l c o h o l It II
It tl
II tl
tt II
tt II
D e n s i t y g / c m
1 0 . 0 x 1 0 ~3 tt
II
II
3 6 l x l O 3 It
tl
II
II
3 6 l x l O "3 II
II
It
2 5 1 + x l O "3 tl
G g / 2 g/cm s
6 . 7 II
2 0 . 1 II
2 U . 0 It 7 3 tl 82 2lt.O II 7 3 It 2lt.O 7 3
~Gi
ι 2 g / c m s
2 5 5 1 3 5 2 5 5 1 3 5 2 5 5 1 3 5 2 5 5 1 3 5 20 6 2 5 5 135 2 5 5 1 3 5 1 3 5 1 3 5
Γ g g / s
3 3 3 3 3 . 3 99 9 9 119 1 1 9 357 360 399 1 1 9 120 359 3 6 1 1 1 9 357
r "1 g / s
1 2 6 6 6 7 1 2 6 667 1 2 6 667 126 667 1018 1 2 6 6 6 7 1 2 6 667 6 6 7 667
r
1 g g / s2 U . 9 37 92 96 120 1 2 0 359 359 ItOl 112 1 1 9 3 6 1 359 116 357
A
g / s
129 7 0 2 133 7 1 1 13U 685 \3k 722 107U 139 695 1I+7 7 2 3 695 7 5 8
r
x/r
g g0 . 7 5 1 . 1 1 0 . 9 3 0 . 9 7 1 . 0 1 1 . 0 Í 1 . 0 0 6 0 . 9 9 8 1 . 0 0 5 0.91+1 0 . 9 9 2 1 . 0 0 6 0 . 9 9 7 0 . 9 7 5 1 . 0 0
Γ 1
Λ
1 . 0 2 5 1 . 0 3 6 1 . 0 5 6 1 . 0 6 6 1 . 0 6 3 1 . 0 2 7 1 . 0 6 3 1 . 0 6 6 1 . 0 5 5 1 . 1 0 1 1.01+2 1 . 1 6 5 1 . 0 8 5 1.01+2 1.11+
Γ Ί = Values o b t a i n e d from o r i f i c e r e a d i n g s
g j l
r'i · ·
TABLE I I I
- g
MIXTURES
A r g o n w a t e r tl
tl
tt
tl
A r g o n e t h y l a l c o h o l II
tl
II
GEOMETRY: ROUND TUBE 2 . 5 cm I . D .
GAS DENSITY
0
g / c mJ 3 6 . 1 x l O ~3
G g ζ 2 g/cm s
2I+.O tl 73 tl 82 2Ì+.0 tl 73 tt Gn 1 / 2 g/cm s
2 5 . 5 135
255 135 206
2 5 . 5 135
255 135
( l a )1
0 . 1 1 5 0.277 0 . 0 3 0 1 0.102 0.127 0.108 0 . 2 8 0 0.0303 0 . 0 9 8
( l α )
0 . 1 1 5 0 . 2 8 0 0.0375 0 . 1 1 7 0.121+ 0 . 1 1 5 0 . 2 8 9 0 . 0 1 8 3 0.098
( l α ) V (lα·)
1.00 0 . 9 9 0 . 8 0 0 . 8 7 1.02 0 . 9 ^ O.97 1.66 1.00
(1 α )1 Values obtained from integration of phase distribution profiles
TABLE IV PHYSICAL PROPERTIES FLUID Water tl (°) E t h y l Alcoholv ; Argon tt It Steam Ρ °C 18 285.5 20 18 18 18 285.5 P kg/cm (a)
up t o 22 70 up t o 22
21.8 1 1 . 5 6 . 1 5 70
Ρ o g / c n r 1.00 0.lk2{k)
0 . 7 8 9( 6 ) 3 6 . 1 x l O 3 ( l ) I 8 . 8 x l 0 "3 ( l ) 3 ( 1 ) 10.0x10 3K '
3(1+) 359x10 ■5V ;
μ
p o i s e
1 . 0 6 x l 0 "2 ( 2 ) 9.5 « 1 < Γ ^ > 1 . 2 0 x l 0 2 ( 6 )
i+(3) 2.27x10 V J' -k(3) 2.25x10 V J ;
It 2.21+xlO 1+ 2.05x10 Y dyn/cm
T3.0<2><+> 1 8 . 2( 5 ) 2 2. 5< 6>
(+)
(°)
(1) (2) (3) (k) (5) (6)At atmospheric pressure
Alcohol A e t h y l i c u s a n h y d r i c u s 9 9 · 9 $ by v o l . Carlo Erba Milano
Tables of thermodynamic and T r a s p o r t P r o p e r t i e s by S. H i l s e n r a t h e t a l . Pergamon P r e s s i 9 6 0 .
Handbook of Chemistry and P h y s i c s C D . Hodgman ed. l+0th, 1 9 5 8 5 9 . Nuclear Enginnering Handbook H. E t h e r i n g t o n Ed. 1 s t , 1 9 5 8 .
VDI Wasserdamptafeln by E. Schmidt VDI 6 t h E d i t i o n ( K c a l ; a t ; ) S p r i n g e r V e r l a g , R. Odernburg, I 9 6 3 .
S . S . K u t a t e l a d z e Heat T r a s f e r i n c o n d e n s a t i o n and b o i l i n g AECTR 3770 Appendix I .
I n t e r n a t i o n a l C r i t i c a l Tables Mc Graw H i l l Book Company New York 1 9 3 3 .
[image:38.595.71.561.147.392.2]-TABLE V
ro
VO
MIXTURES
Argon-water
tl tl
Argon-alcohol
tl tl
Argon-water
Geometry : Round Tube
2.5 cm I . D .
It
It
tl
1.5 cm I . D .
Gas d e n s i t y
0 g/cm
lO.OxlO- 3
36.1xlO~3
3 6 - l x l O "3
25.1+xio"3
3 6 . 1 x 1 0 "3
PHASE DISTRIBUTION
G g
g/cm s
6 + 20
2I+ + 82
2lt + 73
2lt + 73
-h
, 2
g/cm s
25 + 135
25 -» 206
25 * 135
135
-FILM THICKNESS
G g
, 2 g/cm s
1+ * 26
l 6 + 200
-16 -f 82
\
g/cm s
22 + 119
18 + 206
TABLE VI
Argonwater mixture; round tube 2,5 cm I.D.
3 3 = 36.1 x 10 g/cm
G g
, 2 g / c m s
I 6 . O II II II II II II II 11 II
2 1 . 3 II II II II tt II II II II
2 7 . 7
tt II II tl It δ
ι
, 2 g / c m s
1 0 . 1 2 2 . 1 2 8 . 5 3 8 . 2 51 66 9 1 119 157 206
1 8 . 1 2 2 . 1 2 8 . 5 3 8 . 2 5 1 66
91 119 157 2 θ 6
I 8 . I 2 2 . 1 2 8 . 5 3 8 . 2 5 1
66
s cm
5 . 6 x l O 2 6 . 2 " 7.1+ " 9 . 2 " 1 1 . 0 " 1 2 . 7 " 1 5 . 5 " 1 6 . 5 " 17.1* " 1 8 . 8 " 1+.30 " 1+.93 " 5 . 7 " 7 . 3 " 9 . 2 " 1 1 . 3 " 1 2 . 2 " 1 3 . 3 " I 5 . O " I 6 . I " 3.Ì+3 " 3.9I+ " I+.76 " 6 . 1 " 7.I+ " 8 . 9 "
G g , 2 g / c m s
2 7 7 II
II
II
3 5 . 0 II II II II II II II II II 1+7 II II II II II II tl II II 62 tl \ . , 2 g/cm s
9 1 119 157 2 0 6
1 8 . 1 2 2 . 1 2 8 . 5 3 8 . 2 51 66 91 119 157 206
1 8 . 1 2 2 . 1 2 8 . 5 3 8 . 2 51 66 91 119 157 2 0 6
2 2 . 1 3 8 . 2
s cm
1 0 . 0 x 1 0~2
I O . 7 I I . 7 1 3 . 0 2 . 7 6
3 . 2 1 3 7 7 i t . 6 7 58 7 3 5 8 . 0 8 . 5 9 3 1 0 . 7 2 . l i t 2.1t5 2 . 9 6 3 7 2 lt.lt7 52 59 6 . 2 6 . 9 5 7 7 1 . 8 8 2 . 5 5
II II II II II II II 11 II u II M II II II II II II II II II II II II II G g , 2 g/cm s
62 II II II II II 82 II II II II II II II II 95 II II II It II II II II
h
, 2
g / c m s
5 1 66 91 119 157 2 0 6
2 2 . 1 2 8 . 5 3 8 . 2 51 66 91 119 157 2 0 6
2 2 . 1 2 8 . 5 3 8 . 2 5 1 66 91 1 1 9 157 206
s cm
2.90X10""2 3 . 3 8 3 . 9 6 U.35 1+.86 51+5 1 . 2 6 1.1+9 1 . 7 1 1 . 9 1 2 . 2 0 2 . 5 3 2 . 9 3 3 . 3 9 3.9U 0 . 9 2 1 . 0 5 1 . 2 5 1 . 5 1 1 . 6 8 1.91+ 2.21+ 2 . 6 7 3 . 2 7
II II II II II II II II II IT It II 11 II II II II îl II II II II II
TABLE VI ( c o n t . )
G ,g2
g/cm s 127 tl tl II II II II II 172 II II II II II II II 200 II II II II % g/cm s
2 2 . 1
2 8 . 5 38.2 51 66 91 119 157
2 2 . 1
2 8 . 5 38.2 51 66 91 119 157
2 2 . 1 28.5 38.2 51 66 s cm 0.56x1ο""2
o. 6ι "
0.69 " 0.78 " 0.83 " 1.00 " 1.12 " 1.35 " 0.36ο " 0.377 " 0.395 " 0.1+17 " 0.1+50 " 0.1t60 " 0.57 " 0.66 " 0.286 " Ο.309 " 0.31Ι+ " Ο.325 " 0.31+3 "
-TABLE VII
Argonwater m i x t u r e ; round t u b e 2 . 5 cm I . D . Ρ = lO.OxlO"3 g/cm3
G g , 2 g/cm s
1+.52 II
II
II
II
7 . 6 tl
II
II
II
1 2 . 9 II
It
tl
II
2 2 . 6 It
tl
II
II
2 6 . 3 II II II II δ
ι
2 g/cm s2 2 . 1 38.2 66 91 119
2 2 . 1 38.2 66 91 119
2 2 . 1 38.2 66 91 119
2 2 . 1 38.2 66 91 119
2 2 . 1 38.2 66 91 119 s cm 8 . 9 x l 0 "2 1 1 . 6 1I+.7 1 7 . 5 1 8 . 6 5.8 8.2 1 0 . 8 12. i+. 1 3 . 0
3.70 53 6.8 8 . 1 8.1t 2.28 3.37 1+.Ì+8 1+.66 5.0 I . 8 9 2.7Ì+ 3.78 1+.12 1+.51* It tt II tl II II II It It tl It II II II It II tt tl tl II tl II tt It
-TABLE VIII
Argon-water mixture; round tube 1.5 cm I.D.
ρ = 36.1 χ 10~3 g/cm3
g
G G s g 1
' M Ι Ι ι . n | « . , || n , |i . , 2 2
g/cm s g/cm s cm
16.0 22.1 38.2 II tl 91 206 27.8 22.1 38.2 91 206 1+7 22.1 tt II tt 38.2 91 206 82 22.1 38.2 91 206 3.78xlO~2 5 9-2 2 3. 6 8 1 2 k. 5 .6 2 .1+ 57 79 6 1 .63 1+7 22 0 0.87 1. 1 2. 23 .88 63 tl II It I I II tl I I I I II I I tl It tt tt II
-TABLE IX
Argonwater m i x t u r e ; round t u b e 2 . 5 cm I . D .
? 2
G s 2I+.O g/cm s ; G = 25·5 g/cm s
g -*■
Ρ = 36.1xlO~3 g/cm3 g y cm I.25O O.87I O.629 O.376 O.21I+ 0 . 1 2 0+ 0 . 0 6 9 5+ 0 . 0 3 9 5+ 0 . 0 2 5 0+ 0 . 0 l 6 5+ 0 . 0 0 6 5+
ΔΡ Ρ 2 dyn /cm It 2.05x10 1.81+ »' 1.57 " 1.25 " 1.21 "
G g , 2 g/cm s
3I+.7 33.2 298 2 3 . 0 I 6 . 5 1 1 . 3 6.2 2.71+ Ο.96 0.1+2 Ο.Ο68 Gi / 2 g/cm s
3.2 3.1+2 1+. 28 9 . 3 2 3 . Il· 57 91+ 128 130 117 61
l α
Ο.ΟΟ285 Ο.ΟΟ382 Ο.ΟΟ53 0.0161+ Ο.Ο63 0.157 0.355 Ο.62 Ο.83 O.9I 0 . 9 7
S
0.81l· 1.03 1.03 1.15 I . 3 2
Note; the points signed with + in the "y" column were obtained with "the film sampling probe"(1+). The corresponding lα values were derived with the assumption S = 1.
Integral values obtained with "the film sampling probe":
y ' cm 0 . 0 1 3 0.020 0.030 0.01+9 0.090 O.I5O ri g / s
6 . 1 1 2 . 5 2 2 . 5 1+0.8 70 93
Γ g g / s
Ό.ΟΟ68 0.029 0.103 0.50 2.1+0 7.3