IJPSR (2013), Vol. 4, Issue 10 (Research Article)
Received on 25 May, 2013; received in revised form, 30 June, 2013; accepted, 26 September, 2013; published 01 October, 2013
DEVELOPMENT AND VALIDATION OF STABILITY INDICATING SPECTRO-PHOTOMETRIC METHOD FOR THE ESTIMATION OF RIZATRIPTAN BENZOATE IN BULK AND PHARMACEUTICAL DOSAGE FORM
Uttam Prasad Panigrahy* and M. Divya Swetha
Department of Pharmaceutical Analysis and Quality Assurance, Malla Reddy College of Pharmacy, Secunderabad, Andhra Pradesh, India
ABSTRACT: A simple, accurate and rugged stability indicating UV Spectrophotometric method was developed using methanol as the solvent to determine Rizatriptan Benzoate content in pharmaceutical dosage forms. The UV Spectrophotometric method for Rizatriptan Benzoate was determined at λmax 278nm and the drug proved linear in
the range of 10-80μg/ml, with a good correlation coefficient of 0.9997. Percentage purity was found to be 99.94% and an excellent mean recovery (98.65%-100.7%). The method was validated statistically and it can be employed for the routine analysis of Rizatriptan benzoate in marketed formulations.
INTRODUCTION: Rizatriptan benzoate (Fig. 1) is an Antimigraine drug that binds with high affinity to human cloned 5-HT1B/1D receptors and exerts its therapeutic effects in the treatment of migraine headache by binding to 5-HT1B/1D receptors located on intracranial blood vessels and sensory nerves of the trigeminal system causing vasoconstriction and reducing transmission along pain pathways. Literature survey 1, 2, 3 reveals that several analytical methods like HPLC, HPTLC few Spectrophotometric methods 4, 5, 6 have been reported using 0.1N NaOH and Acetonitrile as solvents, but to date no stability indicating spectrophotometric method was reported.
QUICK RESPONSE CODE
DOI:
10.13040/IJPSR.0975-8232.4(10).4046-50
Article can be accessed online on: www.ijpsr.com
[image:1.612.49.299.655.741.2]DOI link: http://dx.doi.org/10.13040/IJPSR.0975-8232.4(10).4046-50
FIG. 1: RIZATRIPTAN BENZOATE 7
The method developed is simple, accurate, rugged and can be used for the routine analysis of Rizatriptan in dosage forms.
MATERIALS AND METHODOLOGY:
Instrumentation and chemicals: UV studies were performed on Lab-India Double-beam UV-Visible spectrophotometer with UV-Win 5 software. Absorbance of the sample and standard solutions were scanned at λmax 278nm using a pair of glass
cuvettes of path length1cm. Rizatriptan benzoate API was obtained as a gift sample from Matrix laboratories, Hyderabad.
Keywords:
UV Spectrophotometric, Rizatriptan Benzoate, Correlation coefficient
Correspondence to Author: Uttam Prasad Panigrahy Department of Pharmaceutical Analysis and Quality Assurance, Malla Reddy College of Pharmacy, Secunderabad, Andhra Pradesh, India
Laboratory grade methanol was purchased from Finar reagents. Sodium hydroxide, Hydrochloric acid and hydrogen peroxide were purchased from Merck (India) Ltd.
Preparation of the standard solution: Standard stock solution of Rizatriptan benzoate was prepared by transferring 10 mg of Rizatriptan benzoate into10ml volumetric flasks separately; it was dissolved and diluted to the mark with methanol to obtain standard solutions containing 1000µg/ml. From this solution, further dilutions were made using laboratory grade methanol as the diluent.
Assay: Twenty tablets (Ritza- Brand name of Natco Pharma) were weighed individually and powdered. Drug powder equivalent to 10 mg was weighed and transferred to 100ml volumetric flask. Drug was dissolved by adding diluent and volume was made up using the diluent. The solution was further diluted to get final concentration of 10µg/ml. Similarly solution containing 10µg/ml was prepared using the working standard.
Absorbance of sample and standard preparations were scanned at 278nm using methanol as the blank. A spectrum of standard and sample preparation was recorded. Fig. 2 shows the spectrum of sample and standard preparation. The percentage of drug content was calculated using the formula and reported (Table 1).
METHOD VALIDATION:
Linearity: Solutions with the concentration from 10-80µg/ml were prepared using the working standard and their absorbances were scanned at 278nm using methanol as the blank (Table 2). Calibration curve (Fig. 3) was plotted with concentration versus absorbance and correlation coefficient was determined.
Accuracy: Percentage recovery of the drug was determined by adding the standard drug at 80%, 100%, and 120% of the label claim to the sample of constant concentration.
Dilutions at each level were carried out as three replicates and absorbance of all the nine solutions was measured at 278nm. Mean recovery and %R.S.D was calculated and reported (Table 3).
Precision: Intraday and inter day precision studies were carried out by scanning the sample solution as nine replicates at a specified concentration. Mean, Standard deviation and % R.S.D were calculated and reported (Table 4, 5).
Ruggedness: The ruggedness of the method was determined by scanning the sample on different UV-Visible spectrophotometers, by scanning at room temperature and cooling the sample solution to 18oC. % R.S.D was calculated and reported (Table 7).
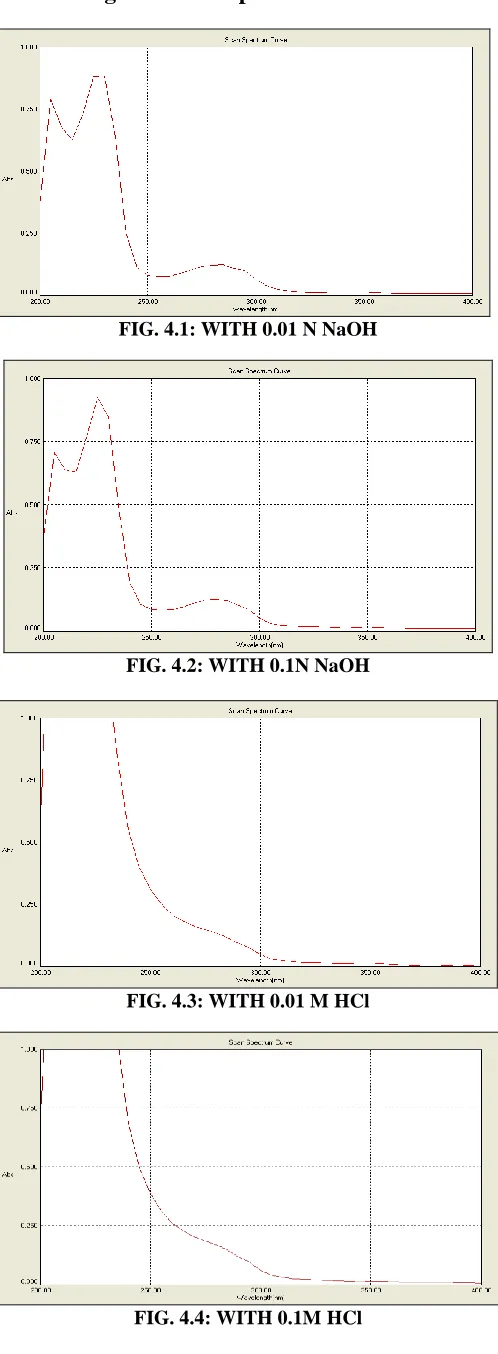
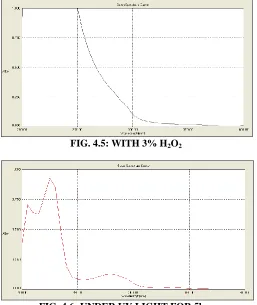
FORCED DEGRADATION STUDIES: Forced degradation studies were performed to evaluate the stability of formulation and specificity of the method. Acid degradation and alkaline degradation were carried out by refluxing the sample solution with 0.01N NaOH (Fig. 4.1), 0.1N NaOH (Fig. 4.2) and 0.01M HCl (Fig. 4.3), 0.1M HCl (Fig. 4.4) for 30min. For oxidative degradation, 1ml of 3%H2O2 was added to the sample dilution and
allowed to react for 30 minutes (Fig. 4.5). For photolytic stability, sample was exposed to UV light for 5hrs (Fig. 4.6).
All the Samples were scanned and spectrum was recorded to check out for any degradation.
RESULTS AND DISCUSSION:
FIG. 2: SPECTRUM OF SAMPLE AND STANDARD PREPARATION
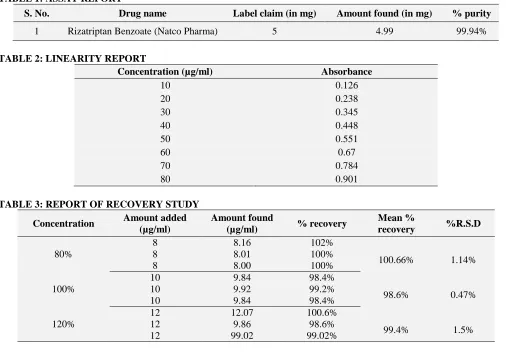
TABLE 1: ASSAY REPORT
S. No. Drug name Label claim (in mg) Amount found (in mg) % purity
1 Rizatriptan Benzoate (Natco Pharma) 5 4.99 99.94%
TABLE 2: LINEARITY REPORT
Concentration (µg/ml) Absorbance
10 0.126
20 0.238
30 0.345
40 0.448
50 0.551
60 0.67
70 0.784
80 0.901
TABLE 3: REPORT OF RECOVERY STUDY Concentration Amount added
(µg/ml)
Amount found
(µg/ml) % recovery
Mean %
recovery %R.S.D 80%
8 8.16 102%
100.66% 1.14%
8 8.01 100%
8 8.00 100%
100%
10 9.84 98.4%
98.6% 0.47%
10 9.92 99.2%
10 9.84 98.4%
120%
12 12.07 100.6%
99.4% 1.5%
12 9.86 98.6%
12 99.02 99.02%
TABLE 4: INTERDAY PRECISION
Sample Absorbance
1 0.127
2 0.126
3 0.126
4 0.121
5 0.126
6 0.126
7 0.124
8 0.123
9 0.124
Mean 0.125
Standard deviation 0.00213
%R.S.D 1%
TABLE 5: INTRADAY PRECISION
Sample Absorbance
1 0.125
2 0.125
3 0.126
4 0.121
5 0.124
6 0.124
7 0.125
8 0.126
9 0.126
Mean 0.125
Standard deviation 0.0022
%R.S.D 0.99%
TABLE 6: METHOD VALIDATION PARAMETERS
Parameters Results
λmax 278 nm
Beer’s law limit 10-80 μg/ml
Regression equation (Y = mx + c) Y=0.011x+0.003
Slope (m) 0.011
Correlation coefficient (r) 0.997
Precision (%RSD) Intra-day precision 0.99%
Inter-day precision 1.0%
Accuracy(%recovery) 100.66%,98.6%,99.4%
LOD Value μg /mL 0.66μg /ml
[image:3.612.50.556.52.406.2]TABLE 7: RUGGEDNESS Instrument- 1
Sample Absorbance
1 0.127
2 0.126
3 0.124
4 0.124
5 0.126
6 0.125
Mean 0.125
Standard deviation 0.0021
%R.S.D 1.0%
Instrument- 2
Sample Absorbance
1 0.116
2 0.119
3 0.118
4 0.119
5 0.119
6 0.116
Mean 0.118
Standard deviation 0.0014
% R.S.D 1.25%
Room temperature
Sample Absorbance
1 0.116
2 0.119
3 0.118
4 0.119
5 0.117
6 0.116
Mean 0.118
Standard deviation 0.0014
%R.S.D 1.25%
Cooling temperature -18oC
Sample Absorbance
1 0.127
2 0.126
3 0.124
4 0.124
5 0.125
6 0.126
Mean 0.125
Standard deviation 0.00126
%R.S.D 1.01%
Forced Degradation Report:
FIG. 4.1: WITH 0.01 N NaOH
[image:4.612.50.292.70.214.2]FIG. 4.2: WITH 0.1N NaOH
FIG. 4.3: WITH 0.01 M HCl
[image:4.612.50.291.241.559.2]FIG. 4.5: WITH 3% H2O2
FIG. 4.6: UNDER UV LIGHT FOR 5hrs
CONCLUSION: No stability indicating UV Spectrophotometric method was reported to date for the quantitative estimation of Rizatriptan Benzoate. The proposed UV method allows rapid and accurate quantization of Rizatriptan benzoate in its dosage form. The Wavelength selected for analysis is 278nm.
Beer’s law was obeyed the concentration range of 10-80µg/ml and the coefficient of correlation was found to be nearer to 1 (Table 6). Assay for the content of drug showed 99.94% (Table 1). Drug was found to be unstable on treatment with 0.01M HCl, 0.1M HCl and 3% H2O2 by forced
degradation studies.
REFERENCES:
1. Devprakash, Sumalatha B.V, Suhas Gurav. Prithviraj S. Yadav, Senthilkumar G.P.Estimation of Rizatriptan benzoate by RP-HPLC method in bulk and dosage form. Journal of Pharmacy Research 2012; Vol 5, No 1.
2. B. Syama Sundar and A. Suneetha.Development and
Validation of HPTLC Method for the estimation of Rizatriptan Benzoate in Bulk and Tablets.Indian J Pharm Sci. 2010; Nov-Dec; 72(6): 798–801.
3. Kudige.N.Prashanth, k.Basavaiah. Utility of P-Chloro anilic acid and 2, 3-dichloro-5, 6-dicyano-p-benzoquinone for the determination of rizatriptan benzoate. ISSN Analytical chemistry 2012.
4. Acharjya Sasmita Kumari, Sahoo Subhasish, M.M.
Annapurna.UV Spectrophotometric method for the estimation of rizatriptan benzoate in pharmaceutical dosage form.IJP 2008.
5. Effat Souri Abbas Kaboodari and Massoud Amanlou. A
New extractive Spectrophotometric method for
determination of rizatriptan dosage forms using bromocresol green. Daru 2013; 21(1).
6. Avula Prameela Rani, Telu Visalakshi, Namasani
Santhosh Kumar and Chandra BalaSekaran. Determination of Rizatriptan Benzoate in Bulk and Tablets by Visible
Spectrophotometry. International Journal of
Pharmaceutical Sciences 2012; Vol. 1 (4). 7. http://www.en.wikipedia.org/wiki/rizatriptan
All © 2013 are reserved by International Journal of Pharmaceutical Sciences and Research. This Journal licensed under a Creative Commons Attribution-NonCommercial-ShareAlike 3.0 Unported License.
This article can be downloaded to ANDROID OS based mobile. Scan QR Code using Code/Bar Scanner from your mobile. (Scanners are available on Google Playstore)
How to cite this article: