Prakashet al., (2010), Vol. 1 (9):115-119 ISSN: 0975-8232
Available online on www.ijpsr.com 115
IJPSR (2010), Vol. 1, Issue 9 (Research Article)
Received on 23 May, 2010; received in revised form 14 June, 2010; accepted 21 June, 2010
ANALYTICAL METHOD DEVELOPMENT AND ITS VALIDATION FOR THE ESTIMATIONOF THYMOL IN TACHYSPERMUM AMMI MILL FRUIT BY GAS LIQUID CHROMATOGRAPHY
Chander Prakash*1, S H Ansari 1,Gurpreet Kaur2, Ilyas U K 1, Ishal M P 1, Nopa Ram 3 and Gagan Deep Singh 4
Department of Pharmaceutical Sciences, Jamia Hamdard University 1, New Delhi, India Department of Pharmaceutical Sciences, Hindu College of Pharmacy 2, Sonipat, Haryana, India Department of Pharmaceutical Sciences, Manipal University 3, Manipal, Karnataka, India Panacea Biotech 4, New Delhi, India
ABSTRACT
Thymol is the main volatile compound extracted from dried fruits of Tachyspermum ammi Mill. The compound serves as a biological marker because of its interesting biological activities and is used in traditional medicine, as a bactericide, fungicide, Gastro-intestinal disorders, Bronchitis and asthma, and others. A GC method for the determination of thymol was developed. Chromatographic analysis was carried out on - stainless steel 30m×0.25m×0.25mm packed with polysiloxane column with flow rate 1.0 ml per minute of the carrier gas. Quantification was performed using a FID. The method was validated for specificity, precision, Linearity, accuracy and robustness. The method was found to be precise for different concentrations of thymol. Accuracy was checked by conducting recovery at different level of thymol and the average percentage and recovery was found to be in the range 90%-110%. The Linearity was established over a range of seven different concentrations of the analyte (70%, 80%, 90%, 100%, 110%, 120% and 130% of test concentration) with correlation coefficients of 0.9997 for thymol.
Keywords:
Tachyspermum ammi Mill (ajwain), Herbals, Thymol, HPLC, Fingerprint,
Validation
Correspondence to Author:
Chander Prakash
Department of Pharmaceutical Sciences, Jamia Hamdard University1, New Delhi, India
Available online on www.ijpsr.com 116
INTRODUCTION: Herbal medicines or
phytomedicines are medicinal products containing the active ingredients of exclusively plant origin have been used in medical practices since antiquity as the major remedy in traditional system of medicine 1. The history of herbal medicines is as old as human civilization. The practices continue even today, because of there is much disillusionment of public with the conventional medicines due to its biomedical benefits as well as in culture beliefs that the herbal remedies are safer “more natural” and have made a great contribution towards maintaining human health 9.
Quality assurance is thrust area for the evaluation of traditional used medicinal plants and herbal formulations. Hence, it has become necessary tool to standardize the safety and quality assurance measures as to ensure the supply of medicinal plant materials of good quality. However, it may not be possible to apply the standardization parameters for herbal medicines as applicable to the modern synthetic drugs due to the complexity in their chemical composition. However, recent advances in analytical tool may be helpful to assure the safety, quality and efficacy of herbal drugs 9.
There is also a primary need to increase the product quality by using the validated test methods. Analytical method development and validation play important role in discovery, development and manufacture of herbal medicinal products. The results from the validated test methods are used to ensure identity, purity, potency and performance of drug products. Healing power & curative properties6,
Gastro-intestinal disorders 8, the oil extracted from seeds is beneficial in the treatment of rheumatic and neuralgic pains. It should be applied on the affected parts 7.The fruits are oval-oblong, greenish brown to yellowish brown in
color. They have an aromatic characteristic odor and the taste is sweet aromatic. The fruit consists of two portions each called mericarp and connected by central stalk (carpophore). A single seed is seen in each mericarp. Fruit surface is glabrous and the five primary ridges of each mericarp are prominent, straight and pale straw coloured 4.Ajwain essential oil showed the presence of 26 identified components which account for 96.3% of the total amount. Thymol (39.1%) was found as a major component along with p-cymene (30.8%), γ-terpinene (23.2%), β-pinene (1.7%), terβ-pinene-4-ol (0.8%) whereas acetone extract of ajwain showed the presence of 18 identified components which account for 68.8% of the total amount followed by oleic acid (10.4%), linoleic acid (9.6%), palmitic acid (1.6%), and xylene (0.1%) 4.
THYMOL CAMPHENE
DIPENTENE -PINENE
MATERIAL AND METHODS:
Instrumentation & Chromatographic conditions:
Experiments were performed on a GC system (Agilant) equipped with FID detector. The separations were performed on column a stainless steel 30m×0.25m×0.25mm packed with polysiloxane column. column Temperature of 70ºC for 1minute, then increased to 100º at a
CH3
C
International Journal of Pharmaceutical Sciences and Research ISSN: 0975-8232
Available online on www.ijpsr.com 117
rate of 10º per minute, then increased to 200º at a rate of 20º per minute and maintained at this temperature for 2 minutes, inlet port temprature of 220ºC and flow rate 1.0 ml per minute of the carrier gas (hydrogen, nitrogen and inert gas) and Sample volume of 1µl2.
Herbs, Chemicals and Reagents: Crude drugs were procured from local market and identification was confirmed by macroscopic and microscopic characters. All the herbs procured from the local market. All the chemicals and solvents used were of AR grade; Standard Thymol (99.5%) of Merck grade and acetone of HPLC grade was procured used for the sample preparation.
Preparation of the formulations:
Preparation of reference solution of thymol:
Accurately weighed thymol (30 mg) was transferred in 100 ml volumetric flask and dissolved in and diluted to 100 ml with acetone. The final solution contained 300 g of the Thymol per ml of the solution 2.
Sample preparation: Accurately weighed 2 gm of powdered Tachyspermum ammi Mill was taken and refluxed with 100 ml of Acetone for 1 hour. The extract was filtered and made up the volume up to 100 ml with acetone and sample was taken after filtered through Teflon filters of 0.45µ using 5ml syringe. Each of the solutions was subjected to GC and the area under the peak of thymol was recorded. The amount of thymol was calculated in the test material using the formula as
%Thymol =
Potency sample
of Conc. x std of area Average
standard of
Conc. x sample of
area
Average
RESULTS AND DISCUSSION:
[image:3.612.315.562.295.442.2]Optimization of GC Condition: For giving the most chemical information and better separation in the chromatograms, the column, mobile phase, detection wavelength and conditions for gradient elution were investigated in this study. Two kinds columns as a stainless steel 30m×0.25m×0.25mm packed with polysiloxane column and a stainless steel 30m×0.53mm capillary column was investigated then stainless steel 30m×0.25m×0.25mm packed with polysiloxane column was found to be more suitable and gave good peak separation and sharp peaks (Fig. 1).
FIG. 1: GC CHROMATOGRAM OF STANDARD THYMOL
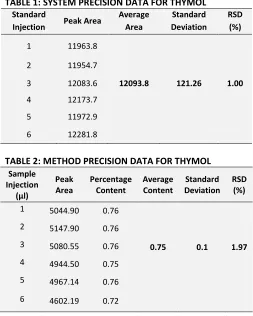
Method validation of quantitative analysis: The method was validated in terms of system precision, method precision linearity, repeatability and recovery test.
Available online on www.ijpsr.com 118 TABLE 1: SYSTEM PRECISION DATA FOR THYMOL
Standard
Injection Peak Area
Average Area
Standard Deviation
RSD (%)
1 11963.8
2 11954.7
3 12083.6 12093.8 121.26 1.00
4 12173.7
5 11972.9
6 12281.8
TABLE 2: METHOD PRECISION DATA FOR THYMOL Sample
Injection (µl)
Peak Area
Percentage Content
Average Content
Standard Deviation
RSD (%)
1 5044.90 0.76
2 5147.90 0.76
3 5080.55 0.76 0.75 0.1 1.97
4 4944.50 0.75
5 4967.14 0.76
6 4602.19 0.72
Calibration curve and Linearity: Good linearity response for thymol was obtained with the developed method within the range of
93.67-133.8 ppm as shown in fig. 2. Linear plot represented graphically indicated that the response is linear over the specified range and the value of correlation coefficient was found to be equal to 0.993. The quantification of thymol undertaken by the proposed method was proved to be simple, sensitive and reproducible.
Chart Title
y = 68.831x - 204.01 R2 = 0.993
0.000 1000.000 2000.000 3000.000 4000.000 5000.000 6000.000 7000.000 8000.000 9000.000 10000.000
0 50 100 150
[image:4.612.317.555.188.351.2]linearity Linear (linearity)
FIGURE 2: CALIBRATION CURVE OF STANDARD THYMOL
Recovery Studies: The results displayed in Table 3 shows that the used extraction method allowed the recovery of thymol b/w 90%-110%, indicating that both accuracy and recovery was satisfactory.
TABLE 3: ACCURACY/RECOVERY OF THYMOL
Recovery level
Sample Weight (mg)
Standard Weight
mg
Average Area
Theoretical value (in ppm)
Actual Value (in ppm)
Recovery%
80% 1024.6000 13.21 9739.61 257.47 231.89 90.07
100% 1041.8000 16.52 10685.83 241.22 254.42 105.47
120% 1018.2000 26.43 13455.90 339.82 320.38 94.28
CONCLUSION: The method was found to be precise for different concentrations of thymol. Accuracy was checked by conducting recovery at different level of thymol and the average percentage and recovery was found to be in the range 90%-110%. The Linearity was established over a range of seven different concentrations of
International Journal of Pharmaceutical Sciences and Research ISSN: 0975-8232
Available online on www.ijpsr.com 119
REFERENCES:
1. WHO. Guidelines for the Assessment of Herbal Medicine, Munich,World Health Organization 1991. 2. Indian pharmacopoeia edition-1997,
(2467-2468,2343)
3. Ayurvedic pharmacopoeia edition- pg no-170-171 4. Quality standard of Indian medicinal plants-vol 3
:349-350.
5. Ramesh S., Internet journal of food safety vol-5,2006 :56-60
6. Jenner PM: Food flavouring and compounds of related structure-I. Acute oral toxicity. Food and cosmetics toxicology 1964, 2: 327.
7. Singh AK, Dikshit A, Sharma ML, Dixit SN: fungotoxic activity of some essential oils. Economic botony 1980, 34(2):186.
8. Nagalakshmi S, Shankaracharya NB, Naik JP, Jagan Mohan rao L Studies on Chemical and Technological aspects of ajwain (tachyspermum ammi linn) seeds . Journal of food science and technology 2000, 37(3):277.
9. Quality control methods for Medicinal Plant Material by WHO Geneva:34
10. Prajapati, Purohit, Sharma, Kumar: A Handbook of Medicinal plants ,2003 ,403,518.