IJPSR (2015), Vol. 6, Issue 8 (Research Article)
Received on 20 December, 2014; received in revised form, 13 February, 2015; accepted, 05 May, 2015; published 01 August, 2015
EFFECT OF PROCESS PARAMETERS OF MICROWAVE ASSISTED EXTRACTION (MAE) ON NATURAL PRODUCT YIELD FROM ONION PEEL
Shaileyee Das* and Subhash C Mandal
Division of Pharmacognosy, Department of Pharmaceutical Technology, Jadavpur University, Kolkata, West Bengal, India
ABSTRACT: Globally, more than 30 % of the onion peels arises at the retail and purchaser levels, of which the post-harvest and dealing out level wastages report for the major share. So, studies on the characterization of unutilized fractions of the onion peels specify their potential candidature for reprocessing. Maximum preservation of these phytochemicals during extraction requires optimised process parameter conditions. A microwave-assisted extraction (MAE) method was considered for extraction of total phenolics, total flavonoids and DPPH scavenging activity from onion peels. The total phenolic capacity (TPC), total flavonoids content (TFC) and antioxidant activity percentage of extracts at optimised MAE conditions. The influence of six main extraction parameters on the extraction was modelled by using a second-order regression equation. The optimal MAE conditions were 210W microwave power, 15min irradiation time and 40 mL/g solvent to material ratio. Under the MAE optimised conditions, the recovery of TPC was 94.34 mg gallic acid equivalent/g dry weight (DW), TFC was 45.61(mg/g) and free radical scavenging activity 92.25%.When bioactive phytochemicals extracted from onion skin using MAE compared with UAE and CSE, it was also observed that the yield values in MAE extracts were higher than the other two extracts.
INTRODUCTION: Onions (Allium cepa L.) are the second most important horticultural crop worldwide, subsequent to tomatoes with present annual production around 66 million tonnes large amount of onion peels are produced by consumption of onion both domestically and industrially, making it necessary to search for their utilization. The major onion peels contain onion skins, two outer fleshy scales and roots generated during industrial peeling and undersized malformed or damaged bulbs. More than 500,000 tonnes of onion peels are thrown away in the European Union each year.
QUICK RESPONSE CODE
DOI:
10.13040/IJPSR.0975-8232.6(8).3260-75
Article can be accessed online on: www.ijpsr.com
DOI link: http://dx.doi.org/10.13040/IJPSR.0975-8232.6(8).3260-75
Every day, our country India produces between 300kg and 500kg of onion peel. These peels get decayed and add themselves to the soil causing odour and in some cases causing harm to the environment.
The objective of this work is to optimize the extraction from these parts of onions that constitute for their phenolics, flavonoids and antioxidant component isolation.
Traditionally, for the extraction, heat reflux and Soxhlet extraction techniques have been the first line of choice, but they are often detrimental owing to the time taken and the organic solvent consumed. In contrast, microwave-assisted extraction (MAE) is known for its high extraction efficiency, and low consumption of organic solvent and time. In the MAE procedure, many extraction Keywords:
Onion peel, Plackett–Burman design, Box–Behnken design
Correspondence to Author: Shaileyee Das,
Division of Pharmacognosy, Department of Pharmaceutical Technology, Jadavpur University, Kolkata – 700 032, India
variables and the interactions among them are known to involve the final yield or outcome 1. When such circumstances are look forward to, response surface methodology (RSM) is a useful tool for optimising the process, which was described originally 2. Moreover RSM has been applied productively to various optimisation procedures in extraction processes and pharmaceutical research. The main intention of RSM is to use a series of designed experiments to obtain an optimal outcome or response. In RSM, an approximate relation between a single response and multiple variables is modelled as a polynomial (quadratic) equation obtained through regression analysis. The equation is called a response surface
3, 4, 5
.
As a part of the preliminary experimental trial, single factor analysis of different ranges of microwave power, irradiation time, sample: solvent ratio, pre-leaching time, particle size of the raw material and various solvent concentration with the aid of a Plackett–Burman design were performed to find the most significant extraction variable(s), which were further optimised by Box–Behnken design by using their higher ranges.
It is scientifically confirmed that onion peels are rich in flavonoid glycosides. But most important material that is found in onion peels is Quercetin (flavonoid) as huge quantities. The onion peels under a microscope Quercetin is observed as sharp, needle –like crystals. In this type of Quercetin is the most valuable substance 6, 7, 8. So, onion peels can reduce blood pressure and prevent arteries from clogging according to weight loss. It has also anti-inflammatory, anticancer and cardiovascular effects
9
.
Experimental methods:
Sample material and chemicals: Chemicals:
Methanol, Acetone, ethyl acetate and hexane used in the experimental work was analytical reagent grade chemical (Merck, Germany). Folin–Ciocalteu phenol reagent was purchased from Loba Chemie (Mumbai, India) and 2,2-diphenyl-1-picrylhydrazyl (DPPH) was purchased from Loba Chemie (Mumbai, India).
MATERIALS:
The outer dry and semi-dry layers and the apical
trimmings of brown-skin onion bulbs (Allium cepa)
were collected immediately after processing from household cooking (Kolkata, India). The tissues were dried in hot air oven and ground with a mixture grinder. The ground tissue was sieved by 10, 20, 30, 40, 60, 80,100mm mesh sized sieve and stored before the analysis.
Apparatus and condition:
The extraction system is a microwave extractor (CATA R) manufactured by Catalyst Systems (Pune, India) equipped with a magatron of 2450MHz with a maximum power of 700W (100%), a reflux unit, 10 power levels (140W (20%) to 700W (100%)), time controller, temperature sensor, exhaust system, beam reflector and a stirring device.
Experimental procedures: Extraction process:
At the start as a part of initial experimental trials using a Plackett–Burman design, an amount of 1 g
ground waste sample was placed into a 250mL
flask and then extraction was carried out by using different ranges of microwave power (20–50% of 700 W), extraction or irradiation time (1–3min), solvent: sample ratio loading (10:1–60:1mL/g), pre-leaching time (5–10 min), particle size of the sample (10–100 mesh) and methanol concentration (10–100% v/v). After extraction, all the extracts were centrifuged for 15 min at 4˚C and 4000 rpm (R-8C, REMI, Mumbai, India) and the supernatants were evaporated under reduced pressure. Then the extracts are used for analysis the responses total polyphenols contents, total flavonoid contents and antioxidant activity. All experiments were conducted in duplicate and the average value was used for statistical analysis. From Plackett–Burman design analysis, we were got the significant parameters for this experiment.
through a Box–Behnken design RSM to predict and locate regions with optimum yield.
Experimental design:
A Plackett–Burman experiment design was used to identify the relationship existing between the response functions and process parameters as well as to determine those conditions that optimised the extraction process 10, 11. The six independent
variables or factors studied were microwave power
(X1, varying between 20–50% of 700 W), extraction or irradiation time (X2, varying between 1–3min), solvent: sample ratio loading (X3, varying between 10:1–60:1ml/g), pre-leaching time (X4, varying between 5–10 min), particle size of the sample (X5, varying between 10–100 mesh) and methanol concentration (X6, varying between 10–100% v/v).
TABLE 1: INITIAL LEVEL OF THE EXTRACTION VARIABLES FOR EXTRACTION ONION WASTE SAMPLE BY USING PLACKETT–BURMAN DESIGN CRITERION
Extraction code Extraction condition Low level (-) High level (+)
X1 microwave power 20% (of 700 W) 50% (of 700 W)
X2 extraction or irradiation time 1 min 3 min
X3 solvent: sample ratio loading 10:1 60:1
X4 pre-leaching time 5 min 10 min
X5 particle size of the sample 10 mesh 100 mesh
X6 methanol concentration 10% v/v 100% v/v
After the identification of significant extraction parameter from Plackett–Burman experiment design based on P values, higher values of the significant variables indentified were further explored to confirm whether any high ranges of the selected parameters showed an increasing trend of polyphenols, flavonoids and antioxidant yield or
[image:3.612.80.537.209.293.2]not and if found statistically significant then those higher ranges of the significant variables would be further optimised through a Box–Behnken design RSM to predict and locate regions with optimum yield. The steps of the design are shown at Fig.2 by a detail flowchart.
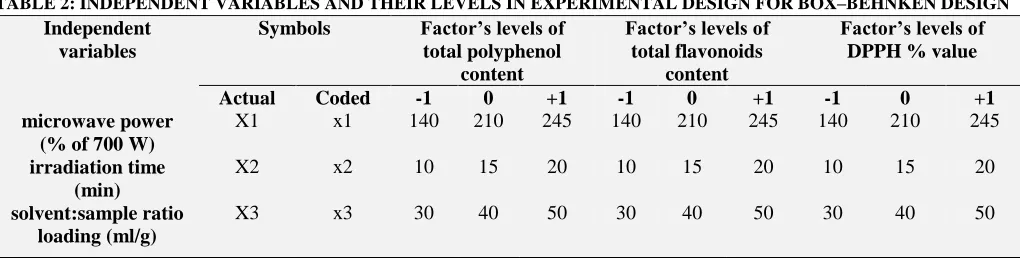
TABLE 2: INDEPENDENT VARIABLES AND THEIR LEVELS IN EXPERIMENTAL DESIGN FOR BOX–BEHNKEN DESIGN
Data analysis:
The design of experiment procedure of Design-expert software (dx9-trial) and Matlab version 6.5 was used to design and analyse both the Plackett- Burman design and BBD. Minitab Pro version 16.1.0.0 (trial version) was used to generate interaction plots. Graph Pad Prism 5 (trial version) was applied for determining the level of significance of various factors involved by using one-way ANOVA test. P values<0.05 were considered significant.
Analytical methods: Total polyphenol content, total flavonoids content and antioxidant activity of
the extracts were determined for every sample
12,13,14
.
Determination of total polyphenol content:
The Folin–Ciocalteu method with a slight modification was used to determine the total polyphenol content. Briefly, 100 ml of extract with concentration of 1 mg/ml was stirred in the test tube together with 500 ml of Folin–Ciocalteu reagent and 6 ml of distilled water. The contents of the test tubes were strongly mixed and after that 2 ml of 15% Na2CO3 solution and 1.4 ml of distilled
water was added. Absorbance was measured at 750 nm after 2 h with blank which was prepared in the same way at the same time only with distilled water Independent
variables
Symbols Factor’s levels of total polyphenol
content
Factor’s levels of total flavonoids
content
Factor’s levels of DPPH % value
Actual Coded -1 0 +1 -1 0 +1 -1 0 +1
microwave power (% of 700 W)
X1 x1 140 210 245 140 210 245 140 210 245
irradiation time (min)
X2 x2 10 15 20 10 15 20 10 15 20
solvent:sample ratio loading (ml/g)
[image:3.612.51.561.416.545.2]instead extract sample. The results were expressed as Gallic acid equivalents (mg Gallic acid/g of
extract dry matter) through the calibration curve of Gallic acid (1–1500 mg/ml).
FIG.2: DESIGN OF EXPERIMENT APPROACH DEPICTING THE PROCEDURE OF EXPERIMENTAL DESIGN.
Parameter selection for the design
Microwave power range (W)
20%-50%
Extraction or irradiation time 1 min-3
min
Solvent: sample ratio
loading 10:1- 60:1
Pre-leaching time 5 min-
10 min
Particle size of the sample 10 mesh - 100
mesh
Methanol concentra
tion10% v/v- 100% v/v
Plackett-Burman design
Identification of significant extraction parameter on the basis
of P value
Identification of higher value of the yield from significant parameter
Microwave power (W) -1 0 +1 140 210 245
Irradiation time (min)
-1 0 +1
10 15 20
Solvent: sample ratio -1 0 +1
30 40 50
17 run Box– Behnken design
Determination of total flavonoids content:
The total flavonoid content of onion was estimated by aluminium chloride (AlCl3) colorimetric method 15, 16, 17
.
a) Preparation of Standards:
To quantify the total flavonoid content, Quercetin was used as the standard, which was expressed as Quercetin equivalent (QE). A standard curve of known concentrations of Quercetin was produced by preparing and testing five concentrations of Quercetin standard solution, which were 0, 25, 50, 75, and 100 mg/L. A stock Quercetin solution was prepared by dissolving 25 mg of Quercetin in 100ml of 80% methanol. Then, the standard working solutions were made up by pipetting 0, 1, 2, 3, 4 and 5ml aliquots of the stock solution (250 mg/L) into 10ml-volumetric flasks and adjusting the volume with 80% methanol. By using test tubes, 1ml of each standard solution was reacted with 1ml of 2% ethanolic dilution of AlCl3 reagent.
The mixture was mixed thoroughly by vortex mixer for about 30s. It was allowed standing at incubator for 30-60 min. Absorbance readings were taken by a UV/Visible Spectrophotometer at 415 nm.
Preparation of Samples:
The content of flavonoids in the examined each
plant extract was determined using
spectrophotometric method. The sample contained 1 ml of methanol solution of the extract in the concentration of 1 mg/ml and 1 ml of 2% AlCl3
solution dissolved in ethanol. The samples were incubated for an hour at room temperature. The
absorbance was determined using
spectrophotometer at λmax = 415 nm. The samples were prepared in triplicate for each analysis and the mean value of absorbance was obtained.
Based on the measured absorbance, the concentration of flavonoids was read (mg/ml) on the calibration line; then, the content of flavonoids in extracts was expressed in terms of Quercetin equivalent (mg/g of extract).
DPPH Free Radical Scavenging Activity:
The anti-oxidant potential of any compound can be determined on the basis of its scavenging activity of the stable 1, 1 –diphenyl-2-picrylhydrazyl (DPPH) free radical. DPPH is a stable free radical containing an odd electron in its structure and
usually make use of detection of the radical scavenging activity in chemical analysis. Stable DPPH radical in methanol is at 517nm 14, 15, 16. The decrease in absorbance of DPPH radical caused by antioxidants, because of the reaction between antioxidant molecules anti radical progresses, which outcomes in the scavenging of the radical by hydrogen donation 18, 19, 20, 21, 22.
Preparation of DPPH solution:
Solution of DPPH (0.1 mM) in methanol is prepared by dissolving 1.9mg of DPPH in methanol and volume is made up to 100ml with methanol. The solution is kept in darkness for 30 minutes to complete the reaction. After that the solution is kept in refrigerator at 4°C for further work.
Protocol for estimation of DPPH scavenging activity:
Different concentrations of test sample are taken at 3 ml each. Mixed with 5 ml of methanolic solution of DPPH (0.1mM) and allowed to stand at room temperature for 30mins. After 30mins, the absorbance is recorded at 517nm. Similarly 3 ml of different concentration of L-ascorbic acid are added to 5 ml of DPPH solution and the absorbance is measured at same nm in a spectrophotometer. Decrease in the absorbance in the presence of test sample solution and standard at different concentration is noted. A blank reading is taken using methanol instead of test sample solution. Lower the absorbance of the reaction mixture indicates higher free radical scavenging activity. The capability to scavenge the DPPH radical is calculated using the following equation:
DPPH scavenged (%) = Acontrol – Asample x 100
Asample
Where;
Acontrol = absorbance of DPPH along with
L-ascorbic acid,
Asample = Absorbance of DPPH along with different
concentrations of test samples.
RESULTS AND DISCUSSION: Fitting the process variables:
coded variables were listed in Table 3. The adequacy of the model was calculated, and the variables showing statistically significant effects were screened via regression analysis. Among six extraction variables (microwave power, irradiation/extraction time, solvent: sample ratio
loading, particle size, solvent concentration and pre-leaching time) studied, three variables (microwave power, irradiation/extraction time and solvent: sample ratio loading) were found to have significant influence on phenols, flavonoids and antioxidants extraction in three cases combination.
TABLE 3: YIELD OF TOTAL POLYPHENOLS, TOTAL FLAVONOIDS AND ANTIOXIDANT ACTIVITY FROM SOLID WASTES ONION PEELS USING THE DIFFERENT LEVELS OF EXTRACTION VARIABLES OF THE PLACKETT–BURMAN DESIGN CRITERION
The significance of each coefficient was determined using the F-test and p-values (Table 4, 5 and 6) of each response. The corresponding variables are more significant if the absolute F -value becomes greater and the p-value becomes smaller. It can be seen that the variables with the largest effect were the linear terms of microwave
power (x1), extraction time (x2) and the quadratic term of liquid: solid ratio (x3). The results suggest that the change of microwave power, extraction time and liquid: solid ratio had highly significant effects on the yield of polyphenols, flavonoids and antioxidants (p < 0.0001) from the onion peels.
Design-Expert® Software TPC
Shapiro-Wilk test W-value = 0.880 p-value = 0.269 A: microwave power B: irradiation time C: solvent ratio D: particle size E: methanol cons F: pre-leaching time G: G H: H J: J K: K L: L
Positive Effects Negative Effects
-0.08 0.02 0.12 0.22 0.32 0.42 0.52
1 5 10 20 30 50 70 80 90 95 99
Normal Plot
X1: Standardized Effect X2: Normal % Probability
A-microwave power
B-irradiation time C-solvent ratio
D-particle size
F-pre-leaching time
FIG. 3: NORMAL PLOT OF POLYPHENOLS SHOWING SIGNIFICANT VARIABLES OBTAINED IN PLACKETT–BURMAN DESIGN (MICROWAVE POWER (%), P=0.0016; SOLVENT: SAMPLE RATIO, P = 0.0029 AND IRRADIATION TIME, P = 0.0005 WERE SIGNIFICANT EXTRACTION VARIABLES).
Standard order
Run order
Point type
Block X1 X2 X3 X4 X5 X6 TPC TFC DPPH %
5 1 1 1 140 1 60 10 100 10 87.59 35.87 88.96
8 2 1 1 455 3 10 10 10 10 88.12 36.34 89.38
6 3 1 1 140 1 10 100 10 10 87.09 35.48 88.30
2 4 1 1 140 3 60 10 100 10 87.65 35.89 88.98
4 5 1 1 140 3 10 100 100 5 87.71 35.95 88.07
10 6 1 1 140 3 60 100 10 5 87.88 36.1 89.13
12 7 1 1 140 1 10 10 10 5 87.14 35.52 88.37
1 8 1 1 455 3 10 100 100 10 88.01 36.31 89.46
3 9 1 1 455 1 60 100 10 10 88.03 36.32 89.40
9 10 1 1 455 3 60 10 10 5 88.38 36.65 89.65
7 11 1 1 455 1 10 10 100 5 87.54 35.79 88.90
[image:6.612.59.556.180.347.2] [image:6.612.78.535.463.710.2]TABLE 4: ANOVA AND REGRESSION ANALYSIS OF PLACKETT–BURMAN DESIGN CRITERION DATA FOR THE PREDICTION OF SIGNIFICANT EXTRACTION VARIABLES
Design-Expert® Software TFC
Shapiro-Wilk test W-value = 0.829 p-value = 0.079 A: microwave power B: irradiation time C: solvent ratio D: particle size E: methanol cons F: pre-leaching time G: G H: H J: J K: K L: L
Positive Effects Negative Effects
-0.09 0.01 0.11 0.21 0.31 0.41 0.51
1 5 10 20 30 50 70 80 90 95 99
Normal Plot
X1: Standardized Effect X2: Normal % Probability
A-microwave power
B-irradiation time C-solvent ratio
D-particle size
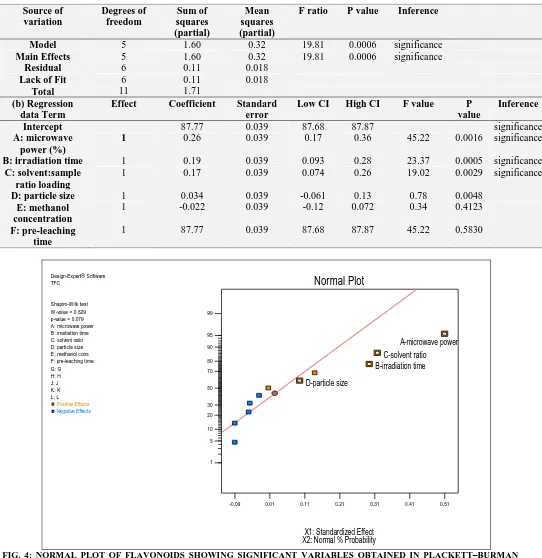
[image:7.612.46.588.77.635.2]FIG. 4: NORMAL PLOT OF FLAVONOIDS SHOWING SIGNIFICANT VARIABLES OBTAINED IN PLACKETT–BURMAN DESIGN (MICROWAVE POWER (%), P=0.0016; SOLVENT: SAMPLE RATIO, P = 0.0029 AND IRRADIATION TIME, P = 0.0005 WERE SIGNIFICANT EXTRACTION VARIABLES).
TABLE 5: ANOVA AND REGRESSION ANALYSIS OF PLACKETT–BURMAN DESIGN CRITERION DATA FOR THE PREDICTION OF SIGNIFICANT EXTRACTION VARIABLES
Source of variation Degrees of freedom
Sum of squares (partial)
Mean squares (partial)
F ratio P value
Inference
Model 4 1.39 0.35 19.81 0.0006 significance
Main Effects 4 1.39 0.35 19.81 0.0006 significance
Source of variation
Degrees of freedom
Sum of squares (partial)
Mean squares (partial)
F ratio P value Inference
Model 5 1.60 0.32 19.81 0.0006 significance
Main Effects 5 1.60 0.32 19.81 0.0006 significance
Residual 6 0.11 0.018
Lack of Fit 6 0.11 0.018
Total 11 1.71
(b) Regression data Term
Effect Coefficient Standard error
Low CI High CI F value P
value
Inference
Intercept 87.77 0.039 87.68 87.87 significance
A: microwave power (%)
1 0.26 0.039 0.17 0.36 45.22 0.0016 significance
B: irradiation time 1 0.19 0.039 0.093 0.28 23.37 0.0005 significance
C: solvent:sample ratio loading
1 0.17 0.039 0.074 0.26 19.02 0.0029 significance
D: particle size 1 0.034 0.039 -0.061 0.13 0.78 0.0048
E: methanol concentration
1 -0.022 0.039 -0.12 0.072 0.34 0.4123
F: pre-leaching time
[image:7.612.43.590.78.626.2]Residual 5 0.12 0.023
Lack of Fit 5 0.12 0.023
Total 9 1.51 0.373
(b) Regression data Term
Effect Coefficient Standard error
Low CI
High CI
F value
P value
Inference
Intercept 36.06 0.044 35.95 36.17 significance
A: microwave power (%)
1 0.26 0.044 0.14 0.37 34.36 0.0020 significance
B: irradiation time 1 0.15 0.044 0.036 0.26 11.48 0.0195 significance
C: solvent:sample ratio loading
1 0.16 0.044 0.047 0.27 13.35 0.0147 significance
D: particle size 1 0.048 0.044 -0.064 0.16 1.22 0.3199
E: methanol concentration
1 -0.010 0.044 -0.12 0.10 0.052 0.8284
F: pre-leaching time
1 -0.023 0.044 -0.14 0.089 0.28 0.6169
Design-Expert® Software DPPH assay
Shapiro-Wilk test W-value = 0.942 p-value = 0.683 A: microwave power B: irradiation time C: solvent ratio D: particle size E: methanol cons F: pre-leaching time G: G H: H J: J K: K L: L
Positive Effects Negative Effects
0.00 0.10 0.19 0.29 0.38 0.48 0.57 0.67 0.76 0
10 20 30 50 70 80 90 95 99
Half-Normal Plot
X1: |Standardized Effect| X2: Half-Normal % Probability
A-microwave power
B-irradiation time
C-solvent ratio
D-particle size E-methanol cons
F-pre-leaching time
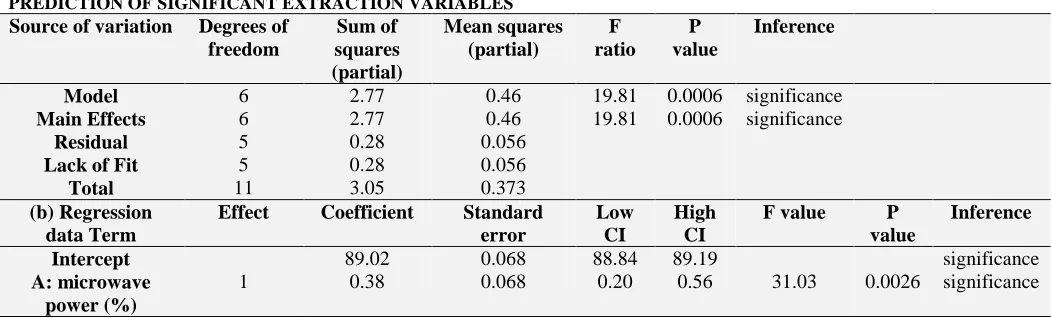
FIG. 5: HALF NORMAL PLOT OF DPPH ASSAY SHOWING SIGNIFICANT VARIABLES OBTAINED IN PLACKETT– BURMAN DESIGN (MICROWAVE POWER (%), P=0.0016; SOLVENT: SAMPLE RATIO, P = 0.0029 AND IRRADIATION TIME, P = 0.0005 WERE SIGNIFICANT EXTRACTION VARIABLES).
TABLE 6: ANOVA AND REGRESSION ANALYSIS OF PLACKETT–BURMAN DESIGN CRITERION DATA FOR THE PREDICTION OF SIGNIFICANT EXTRACTION VARIABLES
Source of variation Degrees of freedom
Sum of squares (partial)
Mean squares (partial)
F ratio
P value
Inference
Model 6 2.77 0.46 19.81 0.0006 significance
Main Effects 6 2.77 0.46 19.81 0.0006 significance
Residual 5 0.28 0.056
Lack of Fit 5 0.28 0.056
Total 11 3.05 0.373
(b) Regression data Term
Effect Coefficient Standard error
Low CI
High CI
F value P
value
Inference
Intercept 89.02 0.068 88.84 89.19 significance
A: microwave power (%)
[image:8.612.48.561.55.530.2] [image:8.612.44.570.588.747.2]B: irradiation time 1 0.097 0.068 -0.079 0.27 2.01 0.2156 significance C: solvent:sample
ratio loading
1 0.27 0.068 0.093 0.44 15.47 0.0110 significance
D: particle size 1 -0.025 0.068 -0.20 0.15 0.13 0.7290
E: methanol concentration
1 -0.023 0.068 -0.20 0.15 0.12 0.7462
F: pre-leaching time
1 0.065 0.068 -0.11 0.24 0.91 0.3844
Level determination for the three selected significant extraction variables to be used for optimization:
The three significant parameters microwave power (X1), irradiation time (X2) and solvent sample ratio (X3) was analysed further for getting the higher values of yield.
Effect of microwave power on the yield of TFC, TPC and DPPH %
Fig.6 highlights the typical yield – microwave power plot for the extraction of TFC, TPC and DPPH %. All the experiments were carried out in duplicate and the mean value of yields were taken for statistical analysis.In general it was noticed that there was a significant improvement in extraction yield with increase in microwave power from 140 to 245 W (P<0.05) when the extraction was carried out with 10min, 15 min and 20min initially. A significant change (P<0.05) in the extraction yield plot was not observed between 280 to 455 W microwave power, when compared with lower microwave powers, as shown in Fig. 6.
FIG.6: MICROWAVE POWER VSTFC, TPC AND DPPH %YIELD
Therefore a microwave power range of 140-245 (of 700 W) was selected for the optimisation study. It can be assumed that more microwave energy was
transferred to the extraction system quickly. The process improved the extraction efficiency when the microwave power increased from 140W to 245W.
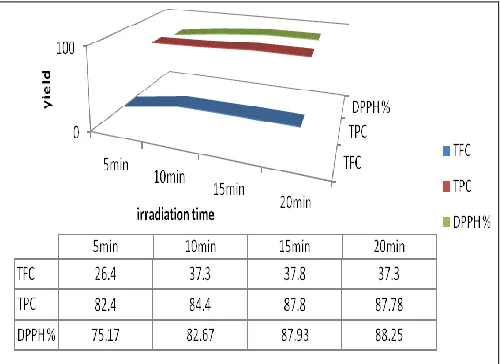
Effect of irradiation (extraction) time on TFC, TPC and DPPH %:
Figure 7 highlights the effect of irradiation time of 5, 10, 15 and 20min at 210W microwave power on the extraction yield of poly-phenols, flavonoids and antioxidants. All the experiments were carried out in duplicate and the mean value of poly-phenols, flavonoids and DPPH %yield was taken for statistical analysis. Therefore an irradiation time range of 10min to 20min was considered for the optimisation study as an obvious increase in yield was noticed within this range. Other extraction conditions were preliminary loading ratio of 30:1ml/g, 10min pre-leaching time for each run and particles were screened through sieve number 40.
FIG.7: IRRADIATION TIME VS TFC TPC AND DPPH% YIELD
Effect of solvent: sample ratio loading on TFC, TPC and DPPH %:
[image:9.612.315.565.446.628.2] [image:9.612.48.300.489.668.2]flavonoids and DPPH % is shown in Fig. 8. All the experiments were carried out in duplicate and the mean value of poly-phenols, flavonoids and DPPH % yield was taken. The results show that a significant extraction yield (P<0.05) was seen in the range of 30:1 ml/g to 50:1 ml/g. However, the increase in yield was not found to be significant at loading ratios lower 30:1 ml/g and above 50:1 ml/g, which were also considered costlier in terms of energy and money.
[image:10.612.49.300.315.489.2]This is because, as the loading ratio decreases, the solvent volume is increased. Moreover, a large volume of solvent causes more absorption of microwave energy and thus sufficient microwave energy may not be available for cell breakage, which is considered important for effective leaching out of the target analytes.
FIG.8: SOLVENT RATIO VS TFC TPC AND DPPH% YIELD
BBD model fitting and statistical analysis:
Fitting the model and checking model adequacy:
So, from figure 6, 7 and 8 we got the highest yield value condition using three significant parameters. Those are: microwave power [140, 210 and 245], irradiation time [10, 15, and 20] and solvent ratio [1:30, 1:40 and 1:50]. It’s shown at Table 2. By this higher value Box–Behnken design was carried out. The whole design consisted of 17 experimental runs carried out in random order to minimise the
effects of uncontrolled factors (instrumental and operative errors) that could have introduced bias into the measurements.
Five replicates (run numbers 1, 5, 7, 14 and 17) at the centre of the design were used to allow for estimation of a pure error sum of squares. Data from the Box–Behnken design (BBD) were analysed by multiple regressions to fit into the following non-linear computer generated quadratic (second order) polynomial model:
2
1 1 2
n n n
ii ij i j
i i i
i i i j
X b b X b X b X X E
Where X is yield, b0, bi, bii, and bij are the
regression coefficients for intercept, linear, quadratic and interaction terms respectively, and Yi, and Yj are the independent variables. The regression coefficients of individual linear, quadratic and interaction terms were determined according to the analysis of variance (ANOVA). The regression coefficients were then used to make statistical calculation to generate three-dimensional and two-dimensional contour maps from the regression model.
The P values of<0.05 were considered to be statistically significant at Table 7. All the experiments were carried out in duplicate and the mean value of TFC, TPC and DPPH % yield was taken for statistical analysis. It can also be seen that the variables having significant contribution were the linear terms of microwave power (X1),irradiation time (X2), solvent: sample/loading ratio (X3) and the quadratic term of irradiation time (X2 2 ), microwave power (X1 2 ), solvent: sample/loading ratio(X32) and followed by the interaction effects of microwave power (X1) irradiation time (X2), irradiation time (X2)
solvent: sample ratio loading (X3), microwave power (X1) solvent: sample ratio loading (X3).
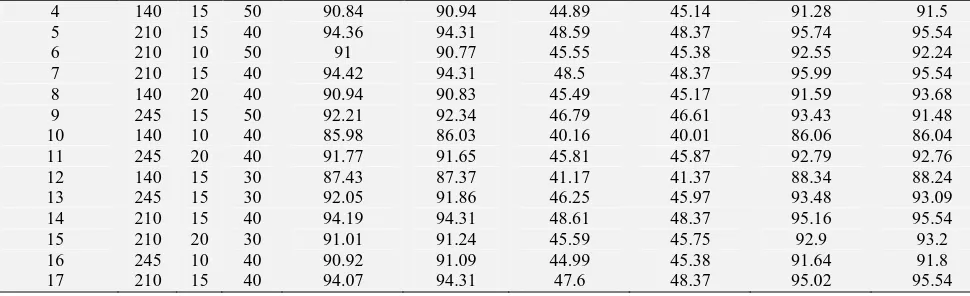
TABLE 7: BOX–BEHNKEN EXPERIMENTAL DESIGN MATRIX WITH OBSERVED RESPONSES AND PREDICTED VALUES FOR MAE YIELD OF TPC, TFC AND DPPH %
Experiment number
actual Observed
yield TPC
Software predicted yield
Observed yield TFC
Software predicted yield
Observed yield DPPH
%
Software predicted yield
-1 0 1
1 210 15 40 94.51 94.31 48.55 48.37 95.8 95.54
2 210 10 30 87.74 87.74 41.99 41.90 88.16 88.32
[image:10.612.52.559.680.749.2]4 140 15 50 90.84 90.94 44.89 45.14 91.28 91.5
5 210 15 40 94.36 94.31 48.59 48.37 95.74 95.54
6 210 10 50 91 90.77 45.55 45.38 92.55 92.24
7 210 15 40 94.42 94.31 48.5 48.37 95.99 95.54
8 140 20 40 90.94 90.83 45.49 45.17 91.59 93.68
9 245 15 50 92.21 92.34 46.79 46.61 93.43 91.48
10 140 10 40 85.98 86.03 40.16 40.01 86.06 86.04
11 245 20 40 91.77 91.65 45.81 45.87 92.79 92.76
12 140 15 30 87.43 87.37 41.17 41.37 88.34 88.24
13 245 15 30 92.05 91.86 46.25 45.97 93.48 93.09
14 210 15 40 94.19 94.31 48.61 48.37 95.16 95.54
15 210 20 30 91.01 91.24 45.59 45.75 92.9 93.2
16 245 10 40 90.92 91.09 44.99 45.38 91.64 91.8
17 210 15 40 94.07 94.31 47.6 48.37 95.02 95.54
TABLE 8: ANALYSES OF VARIANCE OF THE EXPERIMENTAL RESULTS FOR 17 RUN BOX–BEHNKEN DESIGN
Source
Sum of Squares
df Mean
Square
F Value
p-value Prob > F
Interference
Model 102.79 9 11.42 61.09 < 0.0001 significant
X1-microwave power
18.39 1 18.39 98.38 < 0.0001 significant
X2-irradiation time
15.19 1 15.19 81.23 < 0.0001 significant
X3-solvent sample ratio
9.24 1 9.24 49.45 0.0002 significant
X1X2 5.77 1 5.77 30.85 0.0009 significant
X1X3 2.58 1 2.58 13.82 0.0075 significant
X2X3 3.24 1 3.24 17.33 0.0042 significant
X1^2 9.82 1 9.82 52.50 0.0002 significant
X2^2 20.03 1 20.03 107.16 < 0.0001 significant
X3^2 9.71 1 9.71 51.95 0.0002 significant
Residual 1.31 7 0.19
Lack of Fit 0.56 3 0.19 1.00 0.4794 not significant
Pure Error 0.75 4 0.19
[image:11.612.60.545.56.204.2]Cor Total 104.09 16
TABLE 9: ANOVA OF THE FITTED QUADRATIC REGRESSION MODEL Item Standard
deviation
Mean CV (%) PRESS R2 R2
adj
Adequate precision
Predicted R2
value 0.43 45.65 0.95 11.86 0.9874 0.9713 25.198 0.8860
Analysis of response surface generated:
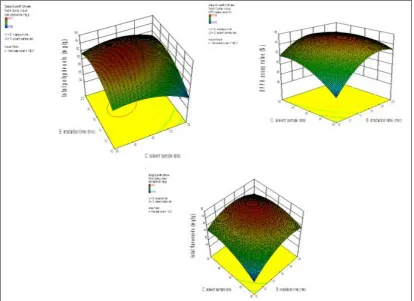
The regression equation was graphically represented by a three-dimensional response surface and two-dimensional contour plots. From the three-dimensional response surface and normal plots shown in Fig. 9–11, the effect of the independent variables and their mutual interaction on yield from onion peels can be seen.
Fig. 9 shows the interaction between microwave power (W; X1) and irradiation time (X2) on the yield of TPC, TFC and DPPH % activity. An increase in microwave power from 140 to 245 W with irradiation time from 10 to 20 min depicts an
enhanced extraction yield, but with an increase in microwave power and irradiation time to approximately over 245W and 20min respectively, there was a gradual decline in the response with no obvious effect on the extraction yield. This could be explained by the fact that increased extraction time caused chemical decomposition resulting in a diminished or lower extraction yield.
[image:11.612.44.574.256.499.2]ratio from 30:1 to 50:1ml/g, the extraction yield of TPC, TFC and DPPH % activity increased. With an increase in microwave power and loading ratio over 245W and 50:1ml/g respectively, the response decreased gradually and did not show any prominent effect on TPC, TFC and DPPH % activity yield.
[image:12.612.106.506.155.426.2]As seen from Table 8, the interactive effect of microwave power and loading ratio on the TPC, TFC and DPPH % activity yield was not highly significant (model F value = 13.82, P = 0.0075) compared to the interactive effect of microwave power and irradiation time(model F value = 30.85, P = 0.0009).
FIG. 9: 3D GRAPH PLOTS FOR THE EFFECT OF MICROWAVE POWER (W), IRRADIATION TIME (MIN) ON THE TOTAL PHENOLIC CONTENT, TOTAL FLAVONOIDS CONTENT AND DPPH SCAVENGING ACTIVITY IN ONION WASTE MATERIAL.
[image:12.612.105.507.472.719.2]As shown in Fig. 11 and Table 8, the interaction of irradiation time and solvent: sample ratio loading had a significant effect on the extraction yield (model F value= 17.33, P = 0.0042). Fig. 11 shows that the highest extraction yield was achieved when irradiation time and loading ratio was slightly above 20min and 40ml/g respectively. However, the extraction yield gradually became decreased at a loading ratio above 50ml/g. This is because, as the loading ratio proceeds above 50mL/g, the
solvent volume increases. The lacks of significant increase in yields were probably due to inadequate stirring of the solvent when microwaves were applied at larger solvent volumes. Moreover, large solvent volume might have caused more absorption of microwave energy and thus sufficient microwave energy was not available for cell rupture, which is considered important for effective leaching out of yields.
FIG. 11: 3D GRAPH PLOTS FOR THE EFFECT OF IRRADIATION TIME (MIN) AND LOADING RATIO ON THE TOTAL PHENOLIC CONTENT, TOTAL FLAVONOIDS CONTENT AND DPPH SCAVENGING ACTIVITY IN ONION WASTE MATERIAL.
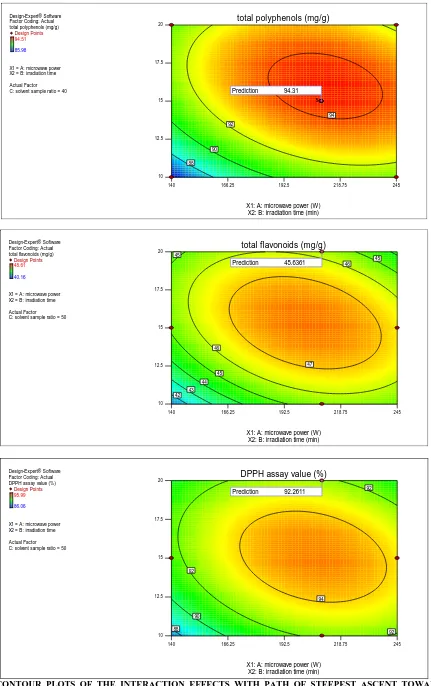
Optimisation of the MAE process by RSM:
The aim of our optimisation study using various phases of RSM was to find the conditions that would produce the maximum extraction yield. The software predicted that the optimum microwave power, irradiation time and loading ratio to be 210W, 15min and 40mL/g respectively, and the theoretical polyphenols yield that was predicted by the software under the aforesaid conditions was 94.31 mg/g, flavonoids yield that was predicted by the software under the aforesaid conditions was 45.63 mg/g and antioxidant activity that was predicted by the software under the aforesaid conditions was 92.26% of dried peels. It was
observed that a number of different variable combinations are possible that could give a maximum yield.
[image:13.612.100.514.204.505.2]Design-Expert® Software Factor Coding: Actual total polyphenols (mg/g)
Design Points
94.51
85.98
X1 = A: microwave power X2 = B: irradiation time
Actual Factor C: solvent sample ratio = 40
140 166.25 192.5 218.75 245 10
12.5 15 17.5
20 total polyphenols (mg/g)
X1: A: microwave power (W) X2: B: irradiation time (min)
88 90
92
94
5
Prediction 94.31
Design-Expert® Software Factor Coding: Actual total flavonoids (mg/g)
Design Points
48.61
40.16
X1 = A: microwave power X2 = B: irradiation time
Actual Factor C: solvent sample ratio = 50
140 166.25 192.5 218.75 245 10
12.5 15 17.5
20 total flavonoids (mg/g)
X1: A: microwave power (W) X2: B: irradiation time (min)
42 43
44 45
45 45
46
46
47
Prediction 45.6361
Design-Expert® Software Factor Coding: Actual DPPH assay value (%)
Design Points
95.99
86.06
X1 = A: microwave power X2 = B: irradiation time
Actual Factor C: solvent sample ratio = 50
140 166.25 192.5 218.75 245 10
12.5 15 17.5
20 DPPH assay value (%)
X1: A: microwave power (W) X2: B: irradiation time (min)
88 90 92
92 92
94
Prediction 92.2611
[image:14.612.92.523.53.739.2]Validation of the microwave assisted extraction process:
Reproducibility of the MAE process:
To determine the reproducibility of the novel extraction strategy of the MAE process, five samples of the same weight (1 g) were processed under the same optimum extraction conditions as obtained from the Box–Behnken design. The mean extraction of yield obtained under the optimised conditions was found to be polyphenols 94.34 (mg/g), flavonoids 45.61(mg/g) and free radical scavenging activity 92.25%. The calculated %RSD (relative standard deviation) value of 0.224971, 0.432381 and 0.42869 respectively shows that the proposed method has an acceptable precision and that the optimisation study was reliable as well.
Comparison of MAE with conventional extraction methods:
In the current study, MAE was compared with the other conventional extraction techniques for the extraction from onion peel based on their yields. The best results were obtained by MAE, which gave significantly higher values when compared with other extraction techniques. With respect to extraction time, MAE was also the fastest extraction method with only 15 min of extraction time. The MAE was found more effective when compared with ultrasound extraction, soxhlet extraction, stirring and maceration. These features along with its ease operation and implementation would position MAE as a valuable and cost-effective technology suitable for today’s highly competitive industries, with growing demand for increased productivity, improved efficiency and reduced extraction time.
CONCLUSIONS: In conclusion it can be said that a design of experiment based extraction strategy was introduced to study its effectiveness on MAE techniques for the extraction from onion peel for the first time. Comparing with other research work on extraction, this proposed strategy has reduced the number of necessary experimental trials for saving time and power consumption apart from evaluating the important interactions between the multiple variables involved. The experimental data were fitted to a second-order polynomial equation using multiple regression analysis. The results showed probability value (P<0.0001) demonstrated
a high significance for the regression model. The optimum condition found was microwave power of 210 W, extraction time of 15 min and loading ratio of 40mL/g. Under these conditions, the mean yield was polyphenols 94.34 (mg/g), flavonoids 45.61(mg/g) and free radical scavenging activity 92.25%.
Thus the design of experiment concept of employing response surface methodology can be applied to all natural products and if explored properly, can prove to be efficient for large-scale industrial application. In addition, the recyclable aspect of the total procedure is a key feature because research be appropriating to new alternative extraction strategies aimed at reducing the various negative forces on the environment and human health is paramount.
ACKNOWLEDGEMENT: We gratefully acknowledge the aid of Jadavpur University for providing facilities to carry out the project work.
REFERENCES:
1. Box GEP, Wilson KB. 1951. On the experimental attainment of optimum conditions. J R Stat Soc Ser. 13: 1– 45.
2. Hao J, Han W, Huang S, Xue B, Deng X. 2002. Microwave-assisted extraction of artemisinin from Artemisia annua L. Sep Purif Technol 28: 191–196. 3. Mandal V, Dewanjee S, Mandal SC.
2009.Microwave-assisted extraction of total bioactive saponin fraction from Gymnema sylvestre with reference to gymnemagenin: a potential biomarker. Phytochem Anal 20: 491–497. 4. Pan X, Niu G, Liu H. 2003. Microwave-assisted extraction
of tea polyphenols and tea caffeine from green tea leaves. Chem Eng Process 42: 129–133.
5. Renjie L. 2008.Optimization of extraction process of Glycyrrhiza glabra polysaccharides by response surface methodology. Carbohydr Polym 74: 858–861.
6. ReuVera.Health Benefits of Home Remedies. Miracle of Onion Peels. Health Benefits of Onions. Retrieved from http://reuvera.hubpages.com/hub/Health-Benefits-of-Home-Remedies-Miracle-of-Onion-Peels.
7. Jiyoung M, Hyun JD, Oh Yoen K, Min J S.2013.Antiobesity effects of quercetin-rich onion peel extract on the differentiation of 3T3-L1 preadipocytes and the adipogenesis in high fat-fed rats. Food and Chemical Toxicology 58: 347–354.
8. Seung M L, Jiyoung M, Hyun J D, Ji HC, Kyung HL, Yong JC, Min JS. 2012. Onion peel extract increases hepatic low-density lipoprotein receptor and ATP-binding cassette transporter A1 messenger RNA expressions in Sprague-Dawley rats fed a high-fat diet. Nutrition Research 32: 210–217.
Cepa) Extraction. International Journal of Current Research 4:008-012.
10. Ballard TS, Mallikarjunan P, Zhou K, Keefe SO. 2010. Microwave-assisted extraction of phenolic antioxidant compounds from peanut skins. Food Chemistry 120:1185– 1192.
11. Banik RM, Pandey DK. 2008. Optimizing conditions for oleanolic acid extraction from Lantana camara roots using response surface methodology. Ind Crops Prod. 27: 241– 249.
12. Chemat S, Lagha A, AitAmar H, Bartels PV, Chemat F. 2004. Comparison of conventional and ultrasound-assisted extraction of carvone and limonene from caraway seeds. Flav Frag J 19: 188–195.
13. Guo Z, Jin Q, Fan G, Duan Y, Qin C, Wen, M. 2001. Microwave-assisted extraction of effective constituents from a Chinese herbal medicine Radix puerariae. Anal Chim Acta 436: 41–47.
14. Hemwimon S, Pavasant P, Shotipruk A. 2007. Microwave-assisted extraction of antioxidative anthraquinones from roots of Morinda citrifolia. Sep Purif Technol 54: 44–50. 15. Krishnaswamy K, Orsat V, Gariépy Y, Thangavel K.
2013. Optimization of microwave-assisted extraction of phenolic antioxidants from grape seeds (Vitis vinifera). Food and Bioprocess Technology 6: 441–455.
16. Li Y, Skouroumounis GK, Elsey GM, Taylor DK. 2011. Microwave-assistance provides very rapid and efficient extraction of grape seed polyphenols. Food Chemistry 129: 570–576.
17. Marija D. Pavlovic, Aneta V. Buntic, Slavica S. Siler-Marinkovic, Suzana I. Dimitrijevic-Brankovic. 2013.
Ethanol influenced fast microwave-assisted extraction for natural antioxidants obtaining from spent filter coffee. Separation and Purification Technology 118: 503–510. 18. Moreira MM, Morais S, Barros AA, Delerue-Matos C,
Guido LF. 2013. A novel application of microwave-assisted extraction of polyphenols from brewer’s M.D. Separation and Purification Technology 118: 503–510. 19. Singh A, Sabally K, Kubow S, Donnelly DJ, Gariepy Y,
Orsat V, Raghavan GSV. 2011. Microwave-assisted extraction of phenolic antioxidants from potato peels. Molecules 16: 2218–2232.
20. Upadhyay R, Ramalakshmi K, Rao LJM. 2012. Microwave-assisted extraction of chlorogenic acids from green coffee beans. Food Chemistry 130: 184–188. 21. Wang L, Li D, Bao C, You J, Wang Z, Shi Y, Zhang H.
2008. Ultrasonic extraction and separation of anthraquinones from Rheum palmatum L. Ultrason Sonochem 15: 738–746.
22. Xu H, Sun LP, Shi YZ, Wu YH, Zhang B, Zhao DQ. 2008. Optimization of Cultivation Conditions for Extracellular Polysaccharide and Mycelium Biomass by Morchella esculenta As 51620. Biochem. Eng. J 39: 66–73.
23. Das S. 2013.Optimization of Ultrasound-assisted Extraction of Total Flavonoids and Antioxidant properties from Trigonella foenum-graecum Seeds with Response Surface Methodology. IJPSR 4(11): 4308-4318.
24. Das S. 2014. Hepatoprotective Activity of Methanol Extract of Fenugreek Seeds on Rats. IJPSR 5(4): 1506-1513.
All © 2013 are reserved by International Journal of Pharmaceutical Sciences and Research. This Journal licensed under a Creative Commons Attribution-NonCommercial-ShareAlike 3.0 Unported License.
This article can be downloaded to ANDROID OS based mobile. Scan QR Code using Code/Bar Scanner from your mobile. (Scanners are available on Google Playstore)
How to cite this article: