ORIGINAL RESEARCH ARTICLE
EXAMINATION OF THE IMPACT OF CONTAMINATED SOIL ON THE CONCENTRATION OF
HEAVY METALS IN VEGETABLES
Emir Imširović, *Besim Salkić, Husejin Keran, Ensar Salkić and Ahmed Salkić
Faculty of Technology Tuzla, University in Tuzla (Bosnia and Herzegovina, Univerzitetska 8, 75000 Tuzla, Bosnia and Herzegovina
ARTICLE INFO ABSTRACT
The aim of this research was to determine the concentration of lead, copper, cadmium, zinc in the soil of different pH, as well as the degree of pollution, and impact of soil contamination on the concentration of heavy metals in vegetables. Stationary research was conducted in 2018 at the Faculty of Technology in Tuzla. The input of heavy metals into vegetables can be monitored with the known content of nutrients in the soil, including cations and anions, dry matter content, moisture, acidity expressed as pH, etc. Soil for monitoring was taken from a plot where various vegetable crops for organic agricultural production are grown. One part of the soil was used for monitoring the intake of natural content, and the second with the increased content of metals in the soil (samples in containers). After the analyzes were carried out, soil contamination has been done with mentioned heavy metals in trace. Contamination was perform by adding metals solution to the soil, which were prepared with chemicals high cleanliness. Using Al2 (SO4)3, pH
of the soil was reduced from 7.5 -7.6 to 5.8 -6.1, in 18 containers for natural content and 18 containers for increased metal content. After adjusting the acidity, the adjustment of the natural soil parameters was made so that six experiments with different conditions for observing the input of heavy metals into three cultures were obtained.The concentrations of heavy metals in soil and vegetables were measured on the atomic absorption spectrophotometer (Analyst 200) and on an inductively coupled plasma by the ICP-OES optical emission method (Optima 2100 DV), by an electroanalytic method of differential pulse anodic striping voltammetry (Differential Pulse Anodic Stripping Voltammetry, DPASV), and standard analytical procedures.
Copyright © 2019,Hassan Musa Mohammad Aldaw. This is an open access article distributed under the Creative Commons Attribution License, which permits unrestricted use, distribution, and reproduction in any medium, provided the original work is properly cited.
INTRODUCTION
The increasing of intensive application of mineral fertilizers (especially phosphoric) and plant protection products based on Cu and Zn in vegetable production disrupt the natural balance of heavy metals and enable their easy entry into the food chain through the plant. Contamination of soils with heavy metals in vegetable production in Bosnia and Herzegovina is insufficiently examinated and inadequately treated scientific problem. Considering the volume and dynamics of agro-technical criterion, it is assumed that the amount of pollutants will be significantly present in the soil and there is possibility of transferring significant concentrations to the consumer itself. Determining the content of heavy metals in the soil is a basic indicator of monitoring the degree of heavy metals
*Corresponding author: Besim Salkić,
Faculty of Technology Tuzla, University in Tuzla (Bosnia and Herzegovina, Univerzitetska 8, 75000 Tuzla, Bosnia and Herzegovina.
migration from soil to plants. Bioaccessibility and bioaccumulation of heavy metals in plants and fruits is directly related to their content and mobility in soil (Teodorovic et al.,
2009). The mobility of heavy metals in the soil is a complex process that basically depends on the nature of the metal itself, the type of solid phase interaction and soil, and other factors such as acidity, oxidation and / or reduction conditions, the presence of ligands, the ionic content of the soil solution (Vidal et al., 1999). It is known that plants adopt heavy metals in several ways. The largest amount of heavy metals are taken from the soil through the roots and then transported to the leaf. Adopting heavy metals from the soil over the roots depends to a large extent on the type and method of soil formation, the size of the soil particles, the amount of organic matter, soil pH, the sorption capacity, the amount of CaCO3, the anthropogenic effect, and other chemical and physical charecteristics of the soil (Lokeshwari and Chandrappa, 2006). Also, plants adopt heavy metals directly through the leaf, from the air or rainfall, even in some plant species existence of ion-exchange has been
ISSN: 2230-9926
International Journal of Development Research
Vol. 09, Issue, 02, pp.25612-25619, February, 2019
Article History:
Received 28th November, 2018
Received in revised form 06th December, 2018
Accepted 18th January, 2019
Published online 27th February, 2019
Available online at http://www.journalijdr.com
Key Words:
Heavy metals, Soil contamination, Heavy metals concentration, Vegetables.
Citation: Emir Imširović, Besim Salkić , Husejin Keran, Ensar Salkić and Ahmed Salkić, 2019.“Examination of the impact of contaminated soil on the concentration of heavy metals in vegetables”, International Journal of Development Research, 9, (02), 25612-25619.
proved. When heavy metals reach the surface of the leaf, the plant adopts them through the stoma (Reimann et al., 2001). Heavy metals are generally poorly mobile in plants, and their content in root is much higher than in the above-ground parts. However, some heavy metals (Cu, Mn, Zn, Mo, Cd) show good mobility in plants, resulting in their distribution to leaves (Madejon et al., 2004). The presence of other heavy metals in the soil has a major impact on metabolism and the adoption of heavy metals. For example, Pb, Ni, and especially Cd inhibit the absorption of Ca, Mg, Fe, Zn, Mn and Cu, as well as their transport from the roots to the above-ground organs, thus affecting the distribution of elements in plants. The input and transport of necessary mineral elements depends on concentration of available non-essential heavy metals in the substrate, the type of essential mineral element, plant species, genotype, etc. (Kastori et al., 1997). Heavy metals are ecologically significant environmental pollutants because they have biological circulation in the environment. Unlike many pollutants that lose their toxicity over time, heavy metals over time do not break down or destroy. Their concentrations increases with the bioaccumulation process. The intensity of their circulation in biological ecosystems is uneven through the year and depends on: climatic conditions, proximity to the source of pollution and activity of biological systems (Fergusson, 1990, Duffus, 2002, Bradl, 2002, Poljaković et al.,
2002). Toxicity and carcinogenicity caused by heavy metals include many aspects of their specific mechanism of toxic action (Pranjić, 2006, Clarkson, 1985).Cadmium (Cd) comes into the nature through phosphoric fertilizers and plants contaminated with cadmium. The main source of population exposure to cadmium is contaminated foods (cereals and vegetables originating in areas where the soil is contaminated with cadmium (He ZL et al., 2005, Shallari et al., 1998). Lead has no role in the functioning of a human organism (it is not an essential metal, required by the organism) (Yedjou et al., 2008, Tchounwou, 2004). Low calcium intake (Ca) increases Pb absorption due to competition for the same receptor. Copper is also potentially toxic in high concentrations because it can produce superoxides and hydroxyl radicals (Harvey et al.,
2008). Also, excessive exposure to copper is associated with cellular damage leading to Wilson's disease in humans (Stern, 2010, ATSDR, 2002).
MATERIALS AND METHODS
For the preparation and analysis of the sample, high purity chemicals (Merck Co. Darmstadt) were used: concentrated HNO3 (nitric acid) and glacial acetic acid. For the preparation
of samples and standard solutions, redistilled water was obtained which was acquired by triple redistillation, which implies on the second and third degree distillation in the quartz apparatus.Standard metal solutions for analysis were prepared at concentrations of 10-4, 10-5, 10-6, 10-7 and 10-8 M, from supra pure metal ion of nitrates.
Zinc standard solution Zn (NO3) in HNO3 (0.5 M), c (Zn) = 1 000 mg/l, (Merck)
Cadmiums standard solution Cd (NO3) in HNO3 (0.5 M), c (Cd) = 1 000 mg/l,
(Merck)
Lead standard solution Pb (NO3) in HNO3 (0.5 M), c (Pb) = 1 000 g/l, (Merck)
Copper standard solution Cu (NO3) in HNO3 (0.5 M), c (Cu) = 1.000 g/l, (Merck)
In order to eliminate possible contamination of environmental samples, i.e. by physical input of the metal into samples, before performing the analysis of the laboratory containers, they are stored in 6 M HNO, after which they are washed with redistilled water. For all metals, individual analyzes were
made. Determination of ions of cadmium, lead and copper in samples was done in 0.1 M KNO3, which was used as an
electrolyte. Due to complexity of the determination, zinc ions, which require the analytical middle of a certain pH, were analyzed in acetate buffer at pH = 4.75. Chemical soil analysis was carried out according to standard procedures for these analyzes, as follows:
1. The pH of the soil was determined in H2O (active acidity) and KCl (substitution acidity) electrometrically on a pH meter with an ion selective electrode in a soil suspension in a ratio of 1: 2.5;
2. The soil humus content was determined by the Springer colorimetric method;
3. The cation exchange capacity (CEC) was determined by the method of ammonium acetate at pH = 7;
4. The rate of change of the anion (AEC) is determined by the method for determining chloride;
5. Electroconductivity is determined conductometrically; 6. Determination of the content of heavy metals of copper,
lead, zinc and cadmium was done using atomic absorption spectrophotometry (AAS) and the evaluation of the obtained results was performed by the electroanalytic method of Differential Pulse Anodic Stripping Voltammetry (DPASV) for several representative samples, and achieved satisfactory matching of the results.
RESULTS
The tracking of metal input was done in six experiments in three different cultures at a pH value of less and higher than 7, i.e. in acidic and alkaline environments. Cultivation of lettuce, carrots and cucumbers was selected for monitoring of the input of heavy metals into vegetables, as types of leafy, root and fruit vegetables. For each experiment are used six containers that make thirty-six total for the natural content of the metal, and the same amount for the increased content of the metal in the soil. The experiments are arranged as follows:
Change of acidity
Increased cation exchange capacity by 10 times
Increased anion exchange capacity
Addition one type of commercial fertilizer
Addition of another type of commercial fertilizer
Addition of carbon dust as fertilizer
[image:2.595.300.565.723.786.2]After preparing the soil in pots, the planting of mentioned vegetables was done. During the vegetation of this vegetables, watering was carried out with distilled water with monitoring the optimal soil moisture in order to avoid undesirable effects. Vegetation took place in the laboratory, where the possibilities of contamination with heavy metals from the outside were reduced to a minimum.
Table 1. The content of heavy metals in humus, NPK and KAN fertilizer and carbon dust (mg / kg of dry matter)
Metal Humus NPK KAN Carbon dust
Table 1. shows the content of heavy metals in nutrients that are added to the soil in the laboratory model, and the maximum allowed concentration of the same metals in humus and fertilizers. The largest copper content was present in c dust, 26.3472 mg / kg of dry matter, and the smallest in humus, 10.0136 mg / kg of dry matter. The interval of lead content is 3.1304 mg / kg of dry matter in humus, up to 18.8327 mg / kg of dry matter in carbon dust. Similar data were obtained for zinc whose concentrations were also in the interval of 16.8389 mg / kg of dry matter for humus up to 43.8152 mg / kg of dry matter incarbon dust. However, slightly different data were obtained for cadmium, since the highest content was in carbon dust, 2.0316 mg / kg of dry matter, and the smallest in KAN fertilizer, 0.5346 mg / kg of dry matter. According to the valid regulations for these purposes in Federation of Bosnia and Herzegovina, the content of copper, lead, and zinc is within the allowed limits. It is especially important to mention for cadmium that its concentration in humus, fertilizer NPK and carbon dust is higher than allowed maximum. Cadmium content is within the allowed limits in KAN fertilizer, 0.5346 mg / kg of dry matter. The content of cadmium in carbon dust is almost three times higher than in allowed maximum (2.0316 mg / kg).
Natural metal content: This section presents the results obtained for the natural content of the metal according to the mentioned experiments.
1. Copper
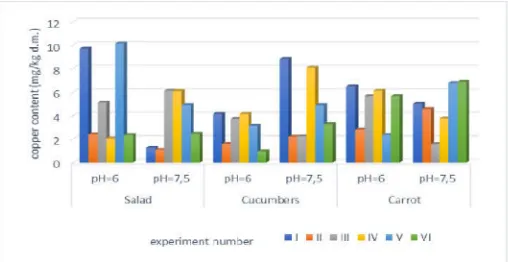
[image:3.595.308.565.234.369.2]The content of copper in lettuce was the highest in experiment V, at pH = 6, and it was 10,134 mg / kg of dry matter, and the smallest in experiment II, 1,0847 mg / kg of dry matter, at pH = 7,5. The highest content of copper in cucumbers was 8.823 mg / kg of dry matter, in experiment I, at pH = 7.5, and the smallest in experiment VI, in acidic environment, 0.9671 mg / kg of dry matter. From the results presented in the chart for the content of copper in carrots, a fairly uniform results are observed, with slight deviations for experiment III, which also had the smallest copper content, 1,567 mg / kg of dry matter, in alkaline environment. A carrot sample from experiment VI, under alkaline conditions had the highest content of copper in carrots, which amounted to 6.8743 mg / kg of dry matter.
Figure 1. Average content of copper in vegetables at natural content of metals in soil (mg / kg of dry matter)
2. Lead
From the representation of lead content it can be seen that lead is most present in lettuce from experiment I. Content od lead in this sample was 4.13 mg / kg of dry matter, at pH = 6. On the other hand, the smallest lead content in lettuce was 0, 4334 mg / kg of dry matter, experiment IV, pH = 6. For lettuce, it is 25614 International Journal of Development Research,
Table 1. shows the content of heavy metals in nutrients that are added to the soil in the laboratory model, and the maximum allowed concentration of the same metals in humus and fertilizers. The largest copper content was present in carbon dust, 26.3472 mg / kg of dry matter, and the smallest in humus, 10.0136 mg / kg of dry matter. The interval of lead content is 3.1304 mg / kg of dry matter in humus, up to 18.8327 mg / kg of dry matter in carbon dust. Similar data were obtained for zinc whose concentrations were also in the interval of 16.8389 mg / kg of dry matter for humus up to 43.8152 mg / kg of dry matter incarbon dust. However, slightly different data were obtained for cadmium, since the highest content was in carbon 16 mg / kg of dry matter, and the smallest in KAN fertilizer, 0.5346 mg / kg of dry matter. According to the valid regulations for these purposes in Federation of Bosnia and Herzegovina, the content of copper, lead, and zinc is within the t is especially important to mention for cadmium that its concentration in humus, fertilizer NPK and carbon dust is higher than allowed maximum. Cadmium content is within the allowed limits in KAN fertilizer, 0.5346 admium in carbon dust is almost three times higher than in allowed maximum
This section presents the results obtained for the natural content of the metal according to the
content of copper in lettuce was the highest in experiment V, at pH = 6, and it was 10,134 mg / kg of dry matter, and the smallest in experiment II, 1,0847 mg / kg of dry matter, at pH = 7,5. The highest content of copper in cucumbers was 8.823 dry matter, in experiment I, at pH = 7.5, and the smallest in experiment VI, in acidic environment, 0.9671 mg / kg of dry matter. From the results presented in the chart for the content of copper in carrots, a fairly uniform results are ht deviations for experiment III, which also had the smallest copper content, 1,567 mg / kg of dry matter, in alkaline environment. A carrot sample from experiment VI, under alkaline conditions had the highest content of copper in
[image:3.595.38.292.557.688.2]to 6.8743 mg / kg of dry matter.
Figure 1. Average content of copper in vegetables at natural content of metals in soil (mg / kg of dry matter)
From the representation of lead content it can be seen that lead is most present in lettuce from experiment I. Content od lead in this sample was 4.13 mg / kg of dry matter, at pH = 6. On the other hand, the smallest lead content in lettuce was 0, 4334 mg / kg of dry matter, experiment IV, pH = 6. For lettuce, it is
important to mention that lettuce samples from experiments IV, in alkaline conditions, and V, in acid and alkaline conditions, showed relatively high lead concentrations. The content of lead in cucumbers ranged from 0,7154 mg / kg of dry matter, experiment III, in mild alkaline conditions, up to 5,0978 mg / kg of dry matter, experiment V, under slightly acidic conditions. Cucumber samples from experiments I, II, pH = 7,5 and experiment III, pH =
concentration. The average content of lead was generally below 3.5 mg / kg of dry matter, with the exception of the carrot sample from experiment V, under mildly acidic conditions, where its concentration was 3.504 mg / kg of matter. The lowest carrot lead value was in the sample from experiment IV, under slightly acidic conditions, with a concentration of 0.234 mg / kg of dry matter.
Figure 2. Average content of lead in vegetables at natural content of metals in soil (mg / kg of dry matter)
3. Zinc
The highest content of zinc in lettuce had a sample from experiment V at pH = 6 and was 19,628 mg / kg of dry matter, while in lettuces the lowest concentration of zinc was recorded in the sample from experiment II under
conditions. The concentration of zinc in this sample was 1.299 mg / kg of dry matter. By comparing the results of zinc in cucumbers with lettuce results, it is noticeable that the average content of zinc is higher in cucumbers than in lettu
[image:3.595.306.564.644.777.2]sample of cucumbers from experiment IV, at pH = 6, had the highest zinc content of 17.24 mg / kg of dry matter, and the smallest one had a sample from experiment V, in which a zinc concentration of 4.4203 mg / kg of dry matter was recorded.The average concentration of zinc in carrot samples is approximate lower than in the other two vegetable crops. These average concentrations are in interval of 2,365 mg / kg of dry matter, the lowest value, experiment III, under mild alkaline conditions, up to 23,50 mg / kg of dry matter in a carrot sample of experiment VI, pH = 7,5.
Figure 3. Average content of zinc in vegetables at natural content of metals in soil (mg / kg of dry matter)
International Journal of Development Research, Vol. 09, Issue, 02, pp. 25612-25619, February
important to mention that lettuce samples from experiments IV, in alkaline conditions, and V, in acid and alkaline conditions, showed relatively high lead concentrations. The cucumbers ranged from 0,7154 mg / kg of dry matter, experiment III, in mild alkaline conditions, up to 5,0978 mg / kg of dry matter, experiment V, under slightly acidic conditions. Cucumber samples from experiments I, II, pH = 7,5 and experiment III, pH = 6, showed a significant lead concentration. The average content of lead was generally below 3.5 mg / kg of dry matter, with the exception of the carrot sample from experiment V, under mildly acidic conditions, where its concentration was 3.504 mg / kg of dry matter. The lowest carrot lead value was in the sample from experiment IV, under slightly acidic conditions, with a concentration of 0.234 mg / kg of dry matter.
Figure 2. Average content of lead in vegetables at natural content mg / kg of dry matter)
The highest content of zinc in lettuce had a sample from experiment V at pH = 6 and was 19,628 mg / kg of dry matter, while in lettuces the lowest concentration of zinc was recorded in the sample from experiment II under slightly acidic conditions. The concentration of zinc in this sample was 1.299 mg / kg of dry matter. By comparing the results of zinc in cucumbers with lettuce results, it is noticeable that the average content of zinc is higher in cucumbers than in lettuces. The sample of cucumbers from experiment IV, at pH = 6, had the highest zinc content of 17.24 mg / kg of dry matter, and the smallest one had a sample from experiment V, in which a zinc concentration of 4.4203 mg / kg of dry matter was rage concentration of zinc in carrot samples is approximate lower than in the other two vegetable crops. These average concentrations are in interval of 2,365 mg / kg of dry matter, the lowest value, experiment III, under mild ,50 mg / kg of dry matter in a carrot sample of experiment VI, pH = 7,5.
Figure 3. Average content of zinc in vegetables at natural content of metals in soil (mg / kg of dry matter)
4. Cadmium
[image:4.595.39.289.248.393.2]The content of cadmium in lettuce was the lowest in the sample from experiment II, and it was 0.0011 mg / kg of dry matter, at pH = 7.5. The highest concentration of cadmium in lettuce was in sample VI, at pH = 7.5 and amounted to 0.088 mg / kg of dry matter. The concentration of cadmium in cucumbers was in the range of 0.0011 mg / kg of dry matter, experiment VI, at pH = 7.5, to 0.0872 mg / kg of dry matter, experiment II, at pH = 6, which at the same time represents the highest value of cadmium in vegetables under given conditions. The highest content of cadmium in carrot samples was in experiment VI, under mildly acidic conditions, which amounted to 0.0768 mg / kg of dry matter, while the lowest was in carrots from experiment I, under mild alkaline conditions, and was 0.0003 mg / kg of dry matter.
Figure 4. Average content of cadmium in vegetables at natural content of metals in soil (mg / kg of dry matter)
Increased metal content
1. Copper
The average content of copper in the lettuce varied from lowest value 2.354 mg / kg of dry weight, lettuce from experiment VI, at pH = 7.5, to a maximum of 15,204 mg / kg of dry mass experiment IV, at pH = 6. The content of copper in cucumbers was smaller than in the lettuce and ranged at an interval of 1.47 mg / kg of dry mass, experiment VI, at pH = 7.5, to 12.534 mg / kg of dry mass, experiment I, at pH = 7.5. The highest concentration of copper in carrots was in the sample from experiment III, under mildly acidic conditions, with a content of 24.5672 mg / kg of dry matter. On the other hand, the smallest content of copper in carrots had a sample from experiment VI, under mild alkaline conditions, 1.3578 mg / kg of dry matter.
Figure 5. Average content of copper in vegetables at increased content of metals in soil (mg / kg of dry matter)
The content of cadmium in lettuce was the lowest in the sample from experiment II, and it was 0.0011 mg / kg of dry matter, at pH = 7.5. The highest concentration of cadmium in lettuce was in sample VI, at pH = 7.5 and amounted to 0.088 mg / kg of dry matter. The concentration of cadmium in range of 0.0011 mg / kg of dry matter, experiment VI, at pH = 7.5, to 0.0872 mg / kg of dry matter, experiment II, at pH = 6, which at the same time represents the highest value of cadmium in vegetables under given mium in carrot samples was in experiment VI, under mildly acidic conditions, which amounted to 0.0768 mg / kg of dry matter, while the lowest was in carrots from experiment I, under mild alkaline conditions, and was 0.0003 mg / kg of dry matter.
4. Average content of cadmium in vegetables at natural content of metals in soil (mg / kg of dry matter)
The average content of copper in the lettuce varied from lowest value 2.354 mg / kg of dry weight, lettuce from experiment VI, at pH = 7.5, to a maximum of 15,204 mg / kg of dry mass experiment IV, at pH = 6. The content of copper in cucumbers was smaller than in the lettuce and ranged at an interval of 1.47 mg / kg of dry mass, experiment VI, at pH = 4 mg / kg of dry mass, experiment I, at pH = 7.5. The highest concentration of copper in carrots was in the sample from experiment III, under mildly acidic conditions, with a content of 24.5672 mg / kg of dry matter. On the other of copper in carrots had a sample from experiment VI, under mild alkaline conditions, 1.3578
Figure 5. Average content of copper in vegetables at increased content of metals in soil (mg / kg of dry matter)
2. Lead
The highest average lead content in the lettuce was 9.575 mg / kg of dry matter, experiment V, under mildly acidic conditions, and the smallest 1.223 mg / kg of dry matter, experiment II, under mild alkaline conditions. On the other hand, the highest concentration of
[image:4.595.310.559.249.393.2]5,8723 mg / kg of dry matter, experiment I, under mild alkaline conditions, and at least 1,2079 mg / kg of dry matter, experiment III, also under mild alkaline conditions. The average concentration of lead in carrots was the highest i sample from experiment VI, in mildly acidic conditions, and the smallest in sample V, under mild alkaline conditions. In the carrots sample from experiment VI, the lead content was 12.3451 mg / kg of dry matter, and in the sample from experiment V, 0.2367 mg / kg of dry matter.
Figure 6. Average content of lead in vegetables at increased content of metals in soil (mg / kg of dry matter)
3. Zinc
The content of zinc in the lettuce get around in the range of 8.129 mg / kg of dry matter, experiment
conditions, up to 42.2113 mg / kg of dry mass, experiment V, mild alkaline conditions. The average concentration of copper in cucumber samples is slightly lower than in lettuces. Consequently, the lowest concentration of zinc in cucumbers was in the sample from experiment II, under slightly alkaline conditions, and amounted to 3.3481 mg / kg of dry matter, and the highest in the sample from experiment III, under slightly acidic conditions, 35.54 mg / kg dry matter. For the carrot, it can be concluded that the sample from experiment V had the highest zinc concentration of 45.1312 mg / kg of dry matter, while the sample from experiment IV, under mild alkaline conditions had zinc content of 2.4158 mg / kg of dry matter.
Figure 7. Average content of zinc in vegetables with increased content of metals in soil (mg / kg of dry matter)
average lead content in the lettuce was 9.575 mg / kg of dry matter, experiment V, under mildly acidic conditions, and the smallest 1.223 mg / kg of dry matter, experiment II, under mild alkaline conditions. On the other hand, the highest concentration of lead in cucumbers was 5,8723 mg / kg of dry matter, experiment I, under mild alkaline conditions, and at least 1,2079 mg / kg of dry matter, experiment III, also under mild alkaline conditions. The average concentration of lead in carrots was the highest in the sample from experiment VI, in mildly acidic conditions, and the smallest in sample V, under mild alkaline conditions. In the carrots sample from experiment VI, the lead content was 12.3451 mg / kg of dry matter, and in the sample from
[image:4.595.304.564.628.777.2].2367 mg / kg of dry matter.
Figure 6. Average content of lead in vegetables at increased content of metals in soil (mg / kg of dry matter)
The content of zinc in the lettuce get around in the range of 8.129 mg / kg of dry matter, experiment II, mild alkaline conditions, up to 42.2113 mg / kg of dry mass, experiment V, mild alkaline conditions. The average concentration of copper in cucumber samples is slightly lower than in lettuces. Consequently, the lowest concentration of zinc in cucumbers was in the sample from experiment II, under slightly alkaline conditions, and amounted to 3.3481 mg / kg of dry matter, and the highest in the sample from experiment III, under slightly acidic conditions, 35.54 mg / kg dry matter. For the carrot, it e concluded that the sample from experiment V had the highest zinc concentration of 45.1312 mg / kg of dry matter, while the sample from experiment IV, under mild alkaline conditions had zinc content of 2.4158 mg / kg of dry matter.
[image:4.595.38.289.637.777.2]4. Cadmium
From Figure 8. it can be seen that cadmium is most present in the sample of lettuce from experiment V, under slightly alkaline conditions. The concentration of cadmium in this sample was 0.5236 mg / kg of dry matter. However, the lowest concentration of cadmium was in the lettuce sample from experiment VI, under mild alkaline conditions. The content of this sample was 0.2321 mg / kg of dry matter
content of cadmium in cucumbers had a sample of experiment V, under slightly acidic conditions, with a cadmium concentration of 1,298 mg / kg of dry matter. The sample of cucumbers from experiment VI, under mild alkaline conditions, had the lowest concentrations of caldmium in cucumbers, which amounted to 0.0691 mg / kg of dry matter. The highest concentration of cadmium in carrots was in the sample from experiment IV, under slightly acidic conditions, which amounted to 1.3613 mg / kg of dry
[image:5.595.308.558.197.251.2]smallest in the sample from experiment II, under slightly alkaline conditions. The concentration in this sample was 0.0038 mg / kg of dry matter.
Figure 8. Average content of cadmium in vegetables at increased content of metals in soil (mg / kg of dry matter)
DISCUSSION
For the Federation of Bosnia and Herzegovina for agricultural land intended for organic and conventional production, the limit values for the contents of the mentioned metals are: Cu 50, Pb - 20, Zn - 150, Cd - 1 mg / kg (Regulation «Official Gazette of the Federation BiH» No. 3 / 99). Classification of pollution of soil is based on the degree of pollution (DP), which represents the percentage of heavy metal content in relation to the limit value:
CHM = content of heavy metals in soil (mg / kg soil SM) / limit value (mg / kg soil SM)
Classification of soil contamination with heavy metals was carried out in five classes (Bašić et al., 1998):
I class - Clean soil with DP up to 25% of the limit value and these soils are very suitable for agricultural production;
II class - Increased pollution of soil with DP 25
limit value and these soils are suitable for growing plants, but need to be protected from the heavy metal immission;
III class - The land of high pollution with DP 50
limit value and these soils are suitable for growing plants, but increased protection measures are needed; 25616 International Journal of Development Research,
[image:5.595.37.292.308.454.2]8. it can be seen that cadmium is most present in the sample of lettuce from experiment V, under slightly concentration of cadmium in this sample was 0.5236 mg / kg of dry matter. However, the lowest concentration of cadmium was in the lettuce sample from experiment VI, under mild alkaline conditions. The content of this sample was 0.2321 mg / kg of dry matter. The highest content of cadmium in cucumbers had a sample of experiment V, under slightly acidic conditions, with a cadmium concentration of 1,298 mg / kg of dry matter. The sample of cucumbers from experiment VI, under mild alkaline owest concentrations of caldmium in cucumbers, which amounted to 0.0691 mg / kg of dry matter. The highest concentration of cadmium in carrots was in the sample from experiment IV, under slightly acidic conditions, which amounted to 1.3613 mg / kg of dry matter, and the smallest in the sample from experiment II, under slightly alkaline conditions. The concentration in this sample was
Figure 8. Average content of cadmium in vegetables at increased (mg / kg of dry matter)
For the Federation of Bosnia and Herzegovina for agricultural land intended for organic and conventional production, the limit values for the contents of the mentioned metals are: Cu - kg (Regulation «Official Gazette of the Federation BiH» No. 3 / 99). Classification of pollution of soil is based on the degree of pollution (DP), which represents the percentage of heavy metal content in
heavy metals in soil (mg / kg soil SM) /
Classification of soil contamination with heavy metals was 1998):
soil with DP up to 25% of the limit value and are very suitable for agricultural
pollution of soil with DP 25 -50% of the limit value and these soils are suitable for growing plants, but need to be protected from the heavy metal
pollution with DP 50 - 100% of the limit value and these soils are suitable for growing plants, but increased protection measures are needed;
IV class - Contaminated soil with DP 100
value and these soils are unsuitable for any plant production and measures for rehabilitation and limitation of cultivation of agricultural crops are necessary;
V class - Heavily contaminated soil with over 200% of the DP over the limit value, on these soils is not allowed to grow plants for human and animal
[image:5.595.308.565.540.673.2]implement complete measures of rehabilitation and recultivation.
Table 2. Degree of soil pollution for laboratory scale
Metal Before
Copper 47.12
Lead 38.82
Zink 83.62
Cadmium 34.70
The soil used for the laboratory model of tracking metal input in vegetables prior to its contamination falls into II class according to the degree of contamination when it comes to copper, zinc and lead. Proportionally, before soil contamination the highest degree
83.62%, which is classified as III in the class by DP. After the addition of metal, the highest percentage of contamination had zinc 833.43% and the lowest cadmium 341.00%. According to pollutant level results, the soil for the
the addition of metal falls into the V class, which is one of the most polluted soil categories.The transmission metal coefficient from soil to vegetable is the best way to show the metal input from the soil under different conditio
plants. Metal transmission coefficient from soil to vegetables are defined as the concentration of certain metals in plant and soil (Saurbeck et al., 2001). According to the literature data, the value of the lead transmission coefficient ranges f
to 0.1 (Saurbeck et al., 2001). According to the same literature source, the copper transmission coefficient ranges from 0.05 to 0.5. The zinc transmission coefficient according to the same literature specification ranges from 0.1 to 4 (Saurbeck 2001). For cadmium transmission coefficients is in the range of 0.01 to 6, as quoted in the literature (Saurbeck
Figure 9. Metal transmission coefficient from soil to lettuce in laboratory conditions by experiments
In the laboratory model for monitoring the input of metal in lettuce, in their natural soil content, the highest coefficient of transmission had lead, 0.53, under slightly acidic conditions, experiment I. On the other hand, the lowest coefficient of transmission was recorded in cadmium, 0.003, under slightly alkaline conditions, experiment II. When it comes to increased metal content, the highest coefficient of transmission in lettuce was recorded at cadmium 0,127, experiment V, under slightly International Journal of Development Research, Vol. 09, Issue, 02, pp.25612-25619, February
soil with DP 100-150% of the limit value and these soils are unsuitable for any plant uction and measures for rehabilitation and limitation of cultivation of agricultural crops are
contaminated soil with over 200% of the DP over the limit value, on these soils is not allowed to grow plants for human and animal use and it should implement complete measures of rehabilitation and
Table 2. Degree of soil pollution for laboratory scale
After 456.30 380.65 833.43 341.00
used for the laboratory model of tracking metal input in vegetables prior to its contamination falls into II class according to the degree of contamination when it comes to copper, zinc and lead. Proportionally, before soil contamination the highest degree of presentation had zinc 83.62%, which is classified as III in the class by DP. After the addition of metal, the highest percentage of contamination had zinc 833.43% and the lowest cadmium 341.00%. According to pollutant level results, the soil for the laboratory model after the addition of metal falls into the V class, which is one of the most polluted soil categories.The transmission metal coefficient from soil to vegetable is the best way to show the metal input from the soil under different conditions to the plants. Metal transmission coefficient from soil to vegetables are defined as the concentration of certain metals in plant and 2001). According to the literature data, the value of the lead transmission coefficient ranges from 0.01 2001). According to the same literature source, the copper transmission coefficient ranges from 0.05 to 0.5. The zinc transmission coefficient according to the same literature specification ranges from 0.1 to 4 (Saurbeck et al.,
2001). For cadmium transmission coefficients is in the range of 0.01 to 6, as quoted in the literature (Saurbeck et al., 2001).
Figure 9. Metal transmission coefficient from soil to lettuce in laboratory conditions by experiments
ory model for monitoring the input of metal in lettuce, in their natural soil content, the highest coefficient of transmission had lead, 0.53, under slightly acidic conditions, experiment I. On the other hand, the lowest coefficient of corded in cadmium, 0.003, under slightly alkaline conditions, experiment II. When it comes to increased metal content, the highest coefficient of transmission in lettuce was recorded at cadmium 0,127, experiment V, under slightly
acidic conditions and lowest at zinc level 0,007, sample of lettuces from experiment II at pH = 7,5. Under mild acid conditions, ie at pH = 6, the natural content of metal, the highest value of the metal transmission coefficient was recorded in lead, a sample of lettuce from experi
[image:6.595.307.561.143.282.2]lowest in cadmium, experiment VI, 0.004. The highest value of metal transmission coefficient from soil to lettuce with the natural content of metals in soil and under mild alkaline conditions was recorded at lead of 0.53, experiment VI and lowest with cadmium 0.003.
Figure 10. Metal transmission coefficient from soil to lettuce in laboratory conditions by experiments
Considering the results of the metal transmission coefficient for their increased soil content and pH = 6, the maximum value was recorded at cadmium, 0,127, experiment V, and also minimum for cadmium 0,012, experiment VI. The coefficient of transmission under mild alkaline conditions and increased metal content was the highest at cadmium 0.154, experiment V and lowest in zinc 0.007. The copper coefficient limit values in vegetables are in the range of 0.05 to 0.5 (Saurbeck 2001). According to this interval, most samples belonges within the permitted limits, with the exception of some samples in the increased metal content in the soil. According to this finding, the following lettuce samples can be distinguished: sample I, slightly acidic and alkaline conditions and increased metal content, and samples IV and V with increased metal content and pH = 6. However, this i
same as lead because the lead transmission coefficient exceed those described in the literature, i.e. from 0.001 to 0.1 (Saurbeck et al., 2001). In this case, there are several samples which have a coefficient of transmission beyond tolerant values. For zinc and cadmium, it can be concluded that the zinc coefficient does not exceed the limit values, even in some samples and below the minimum limit value. Coefficients for the transmission of cadmium also do not exceed the limit values given in the literature, ranging from 0.01 to 6.
Figure 11. Metal transmission coefficient from soil to cucumber in laboratory conditions by experiments
[image:6.595.39.291.181.313.2]st at zinc level 0,007, sample of lettuces from experiment II at pH = 7,5. Under mild acid conditions, ie at pH = 6, the natural content of metal, the highest value of the metal transmission coefficient was recorded in lead, a sample of lettuce from experiment I and lowest in cadmium, experiment VI, 0.004. The highest value of metal transmission coefficient from soil to lettuce with the natural content of metals in soil and under mild alkaline conditions was recorded at lead of 0.53, experiment VI and
Figure 10. Metal transmission coefficient from soil to lettuce in laboratory conditions by experiments
Considering the results of the metal transmission coefficient for their increased soil content and pH = 6, the maximum value was recorded at cadmium, 0,127, experiment V, and also minimum for cadmium 0,012, experiment VI. The coefficient of transmission under mild alkaline conditions and increased metal content was the highest at cadmium 0.154, experiment V .007. The copper coefficient limit values in vegetables are in the range of 0.05 to 0.5 (Saurbeck et al.,
2001). According to this interval, most samples belonges within the permitted limits, with the exception of some content in the soil. According to this finding, the following lettuce samples can be distinguished: sample I, slightly acidic and alkaline conditions and increased metal content, and samples IV and V with increased metal content and pH = 6. However, this is not the same as lead because the lead transmission coefficient exceed those described in the literature, i.e. from 0.001 to 0.1 2001). In this case, there are several samples which have a coefficient of transmission beyond tolerant ues. For zinc and cadmium, it can be concluded that the zinc coefficient does not exceed the limit values, even in some samples and below the minimum limit value. Coefficients for the transmission of cadmium also do not exceed the limit
literature, ranging from 0.01 to 6.
Figure 11. Metal transmission coefficient from soil to cucumber in laboratory conditions by experiments
Metal transmission coefficient in cucumbers under mild acid conditions and the natural content of metals in
[image:6.595.305.561.594.732.2]highest at lead, 0.76, experiment V, and lowest in cadmium, 0.007, also experiment V. Also, it can be noted for slightly alkaline conditions in natural metal content, since lead had the highest coefficient of transmission, experiment II, 0.61, lowest cadmium, 0.003, experiment VI.
Figure 12. Metal transmission coefficient from soil to cucumber in laboratory conditions by experiments
Results for the coefficient of transmission at increased metal content and acid conditions: the maximum
cadmium, 0.381, experiment V and minimum zinc, 0.007, experiment IV. The highest value of the transmission coefficient under mild alkaline conditions and the increased metal content had experiment IV, at acadmium 0.216. On the other hand, the minimum value of the coefficient of transmission of metals to cucumbers in these conditions in soil is recorded in experiment II, at zinc, 0.003. Based on the results of the coefficient of transmission at copper and the literary sources, it can be concluded
not exceed the limit values (Saurbeck
comes to lead, the result of lead transmission coefficients in some causes exceeds maximum limit value. Values higher than those mentioned in the literature are as ma permitted in the following experiments: I, II, III and V under mild acid conditions and natural metal content; I, II, IV, V, VI for the natural content of metals and under mild alkaline conditions. The results of the zinc and cadmium transmission coefficients are within the limit values (Saurbeck
which are quoted in the literature. Cadmium transmission coefficients with increased metal content in soil are higher at pH = 6 than under mild alkaline conditions.
Figure 13. Metal transmission coefficient from soil to carrot in laboratory conditions by experiments
From the presented results of metal transmission from soil to carrot at pH = 6 and their natural content, lead had the highest transmission coefficient in experiment V,
Metal transmission coefficient in cucumbers under mild acid conditions and the natural content of metals in the soil was highest at lead, 0.76, experiment V, and lowest in cadmium, 0.007, also experiment V. Also, it can be noted for slightly alkaline conditions in natural metal content, since lead had the highest coefficient of transmission, experiment II, 0.61, and lowest cadmium, 0.003, experiment VI.
Figure 12. Metal transmission coefficient from soil to cucumber in laboratory conditions by experiments
Results for the coefficient of transmission at increased metal content and acid conditions: the maximum value was cadmium, 0.381, experiment V and minimum zinc, 0.007, experiment IV. The highest value of the transmission coefficient under mild alkaline conditions and the increased metal content had experiment IV, at acadmium 0.216. On the imum value of the coefficient of transmission of metals to cucumbers in these conditions in soil is recorded in experiment II, at zinc, 0.003. Based on the results of the coefficient of transmission at copper and the literary sources, it can be concluded that this coefficient does not exceed the limit values (Saurbeck et al., 2001). When it comes to lead, the result of lead transmission coefficients in some causes exceeds maximum limit value. Values higher than those mentioned in the literature are as maximally permitted in the following experiments: I, II, III and V under mild acid conditions and natural metal content; I, II, IV, V, VI for the natural content of metals and under mild alkaline The results of the zinc and cadmium transmission oefficients are within the limit values (Saurbeck et al., 2001), which are quoted in the literature. Cadmium transmission coefficients with increased metal content in soil are higher at pH = 6 than under mild alkaline conditions.
transmission coefficient from soil to carrot in laboratory conditions by experiments
[image:6.595.37.293.637.778.2]had cadmium in experiment V, 0.004. At pH 7.5, the largest metal transmission coefficient in carrot has a carrot sample from experiment V with a lead value of 0.30. On the other hand, the lowest transmission coefficient value in these conditions was recorded in the carrot sample from experiment I and the coefficient of transmission for cadmium was 0.001.
Figure 14. Metal transmission coefficient from soil to carrot in laboratory conditions by experiments
In soil conditions, where metal content was increased, under slightly acidic medium, the highest coefficient of transmission was recorded for cadmium, experiment IV. In this experiment, the coefficient value was 0.399. It is important to note that the lowest value of transmission coefficient was recorded for cadmium, 0.006, experiment II. When examining the results of transmission coefficient for soil conditions in which the content of metal was increased and under alkaline conditions, cadmium had the highest value of the c
transmission, experiment III, 0.326, and even the lowest, experiment II, 0.001. According to literature data, the zinc transmission coefficient is in the range of limit values, as well as cadmium. However, cadmium in some samples has a fairly high transmission coefficient when compared to the same values as the natural content of metals in the soil. For lead it can be said that in some samples there are certain deviations from the limit values referred to the literature, which are mostly samples of the natural content of metals in the soil. The copper transmission coefficient is mainly within the range of values given in the literature.
Conclusion
Commercial computer programs used for speciation of heavy metals in soil used to monitor metal inputs in laboratory conditions have shown that the order of availability of metals is as follows: Zn> Cd> Cu> Pb. The bioavailability and input of metals in vegetables determined by the computer was higher at lower pH i.e. at pH <7, and at increased pH b
of metals was reduced. This finding is confirmed by experimental research in laboratory conditions, since the average value of metal input is higher at pH = 6 than at pH = 7.5. Different fertilizers, as well as carbon dust, if applicated in soil in which agricultural crops are grown, can contribute to increasing the input of heavy metals into agricultural crops, especially if their application is not under regular monitoring. In modern agricultural production, the input of heavy metals from the soil into edible parts of plants is an important problem, especially if their toxicity,
bio-non-accumulation capacity are considered as the most dangerous characteristics that directly affect the health of consumers. The 25618 International Journal of Development Research,
had cadmium in experiment V, 0.004. At pH 7.5, the largest metal transmission coefficient in carrot has a carrot sample from experiment V with a lead value of 0.30. On the other hand, the lowest transmission coefficient value in these soil conditions was recorded in the carrot sample from experiment I and the coefficient of transmission for cadmium was 0.001.
Figure 14. Metal transmission coefficient from soil to carrot in laboratory conditions by experiments
where metal content was increased, under slightly acidic medium, the highest coefficient of transmission was recorded for cadmium, experiment IV. In this experiment, the coefficient value was 0.399. It is important to note that the ssion coefficient was recorded for cadmium, 0.006, experiment II. When examining the results of transmission coefficient for soil conditions in which the content of metal was increased and under alkaline conditions, cadmium had the highest value of the coefficient of transmission, experiment III, 0.326, and even the lowest, experiment II, 0.001. According to literature data, the zinc transmission coefficient is in the range of limit values, as well as cadmium. However, cadmium in some samples has a fairly high transmission coefficient when compared to the same values as the natural content of metals in the soil. For lead it can be said that in some samples there are certain deviations from the limit values referred to the literature, which are les of the natural content of metals in the soil. The copper transmission coefficient is mainly within the range of
Commercial computer programs used for speciation of heavy inputs in laboratory conditions have shown that the order of availability of metals is as follows: Zn> Cd> Cu> Pb. The bioavailability and input of metals in vegetables determined by the computer was higher at lower pH i.e. at pH <7, and at increased pH bioavailability
This finding is confirmed by experimental research in laboratory conditions, since the average value of metal input is higher at pH = 6 than at pH = 7.5. Different fertilizers, as well as carbon dust, if applicated in soil in which agricultural crops are grown, can contribute to increasing the input of heavy metals into agricultural crops, especially if their application is not under regular monitoring. In modern agricultural production, the input of heavy metals the soil into edible parts of plants is an important -degradability and accumulation capacity are considered as the most dangerous characteristics that directly affect the health of consumers. The
constant monitoring of the presence of heavy metals in agricultural soil used for intensive vegetable production is of great importance, since such data give a better idea of the possibilities of applying agro
allow toxic soil components, plant-soil not reach vegetables
various agro-technical measures, it is possible to reduce or stabilize heavy metals in the soil by binding them so thay are not available the the root of plants.
heavy metals from growing vegetables to the final product regardless of how products are consumed fresh or processeded, which defines critical entry points and reduces the risk to human health. By this model, which implies t definition of soil charecteristics, the determination of the heavy metals content in the soil, and their specification with commercial computer programs improves the quality of people lives because they consume healthier and safer products .Application of agro-technical measures through Good Agricultural Practice and the HACCP system that defines the health safety of products and electrochemical methods, regular monitoring of heavy metals in plant crops also improves the quality of human lives.
REFERENCES
Agency for Toxic Substances and Disease Registry (ATSDR) 2002. Toxicological Profile for Copper. Atlanta, GA: Centers for Disease Control.
Bašić, F., Kisić, I., Mesić, M., Butorac, A. 1998. Studija stanja i projekt rekultivacije tla isplačne ja
fakultet, Zagreb.
Bradl H. 2002. editor. Heavy Metals in the Environment: Origin, Interaction and Remediation Volume 6. London, Academic Press;
Clarkson TW, Nordberg GF, Sager PR.(1985. Reproductive and developmental toxicity of metals. Scand J Environ Health. 11:145–54.
Duffus JH. 2002. Heavy
metals-Chem., 74(5):793–807. 3.
Fergusson JE, editor. 1990. The Heavy Elements: Chemistry, Environmental Impact and Health Effects. Oxford, Pergamon Press.
Harvey LJ, McArdle HJ. 2008. Biomarkers of copper status: a brief update. Br J Nutr., 99(S3):S10
He ZL, Yang XE, Stoffella PJ. 2005. Trace elements in agroecosystems and impacts on the environment.
Elem Med Biol.,19(2–3):125–
Kastori R., Petrović N., Arsenijević
metali u životnoj sredini, (ed.) Naučni institut za ratarstvo povrtarstvo, Feljton, Novi Sad.
Lokeshwari H., Chandrappa T.G. 2006. Impact of heavy metal contamination of Bellandur Lake on soil and cultivated vegetation, Curr. Sci., 91, 622
Madejon P., Maranon T., Murilloa J.M., Robinsonb B. 2004. White poplar(Populus alba) as a biomonitor of trace elements in contaminated riparian forests, Environ. Pollut. 132, 145 155.
Poljaković H, Tahorović HF, Dinar
(2002. N. Risk factors for the development of congenital heart defects in children born in the Tuzla Canton.
56(2):73-7.
Pranjić N.(2006. Zdravstvena ekologija. Univerzitetska knjiga: Medicinski fakultet Univerziteta u
PRAVILNIK o količinama, pesticida i drugih otrovnih materija, antibiotika i mikotoksina koji se mogu nalaziti u International Journal of Development Research, Vol. 09, Issue, 02, pp. 25612-25619, February
nitoring of the presence of heavy metals in agricultural soil used for intensive vegetable production is of great importance, since such data give a better idea of the possibilities of applying agro-technical measures that will allow toxic soil components, through the diffusion system soil not reach vegetables. Through the application of technical measures, it is possible to reduce or stabilize heavy metals in the soil by binding them so thay are not available the the root of plants. It is necessary to control heavy metals from growing vegetables to the final product regardless of how products are consumed fresh or processeded, which defines critical entry points and reduces the risk to human health. By this model, which implies the definition of soil charecteristics, the determination of the heavy metals content in the soil, and their specification with commercial computer programs improves the quality of people lives because they consume healthier and safer products
technical measures through Good Agricultural Practice and the HACCP system that defines the health safety of products and electrochemical methods, regular monitoring of heavy metals in plant crops also improves the
Agency for Toxic Substances and Disease Registry (ATSDR) 2002. Toxicological Profile for Copper. Atlanta, GA: Centers
Bašić, F., Kisić, I., Mesić, M., Butorac, A. 1998. Studija stanja i projekt rekultivacije tla isplačne jame Okoli – 53, Agronomski
Bradl H. 2002. editor. Heavy Metals in the Environment: Origin, Interaction and Remediation Volume 6. London, Academic
Clarkson TW, Nordberg GF, Sager PR.(1985. Reproductive and metals. Scand J Environ Health.
- a meaningless term?, Pure Appl
Fergusson JE, editor. 1990. The Heavy Elements: Chemistry, Environmental Impact and Health Effects. Oxford, Pergamon
arvey LJ, McArdle HJ. 2008. Biomarkers of copper status: a 99(S3):S10–S13.
He ZL, Yang XE, Stoffella PJ. 2005. Trace elements in agroecosystems and impacts on the environment. J Trace
–140.
trović N., Arsenijević-Maksimović I. 1997. Teški metali u životnoj sredini, (ed.) Naučni institut za ratarstvo povrtarstvo, Feljton, Novi Sad.
Lokeshwari H., Chandrappa T.G. 2006. Impact of heavy metal contamination of Bellandur Lake on soil and cultivated
91, 622-627.
Madejon P., Maranon T., Murilloa J.M., Robinsonb B. 2004. White poplar(Populus alba) as a biomonitor of trace elements in contaminated riparian forests, Environ. Pollut. 132,
145-Poljaković H, Tahorović HF, Dinarević S, Ferković V, Pranjic (2002. N. Risk factors for the development of congenital heart defects in children born in the Tuzla Canton. Med Arh.,
Pranjić N.(2006. Zdravstvena ekologija. Univerzitetska knjiga: Medicinski fakultet Univerziteta u Tuzli. Tuzla, Off-Set. PRAVILNIK o količinama, pesticida i drugih otrovnih materija,
poljoprivrednom tlu, gnojivima «Službene novine Federacije BiH» br. 3/99.
Reimann C., Koller F., Kashulina G., Niskavaara H., Englmaier P. 2001. Influence of extreme pollution on the inorganic chemical composition of some plants, Environ. Pollut. 115, 239–252.
Saurbeck, D., Lubben, S. 2001. Auswirkungen von Siedlungsabfa Ilen auf Boden, Bodenorganismen und Pflanzen, in: Berichte aus der okologischen Forschung, Band 6.
Shallari S, Schwartz C, Hasko A, Morel JL. 1998. Heavy metals in soils and plants of serpentine and industrial sites of Albania. Sci Total Environ. 19209:133–142.
Stern BR. 2010. Essentiality and toxicity in copper health risk assessment: overview, update and regulatory considerations. Toxicol Environ Health A. 73(2):114–127.
Tchounwou PB, Yedjou CG, Foxx D, Ishaque A, Shen E. 2004. Lead-induced cytotoxicity and transcriptional activation of stress genes in human liver carcinoma cells (HepG2) Mol Cell Biochem. 255:161–170.
Teodorović B., Lončarić, Z., Karalić, K., Popović, B., Rekasi, M., Filep, T., Engler, M., Kerovec, D. 2009. Teški metali u kiselim i karbonatnim tlima istočne Hrvatske. Zbornik sažetaka 44. hrvatskog i 4. Međunorodnog simpozija agronoma. Lončarić, Z., Marić, S. ur.). Poljoprivredni fakultetSveučilišta u Osijeku, B.EN.A., EurAgEng, ISFAE, ISTRO. Opatija, Hrvatska. 29-30.
Vidal M., Lopez-Sanchez J.F., Sastre J., Jimenez G., Dagnac T., Rubio R., Rauret G. 1999. Prediction of the impact of the Aznalcollar toxic spill on the trace element contamination of agricultural soils. Sci. Total Environ., 242,131-148.
Yedjou GC, Tchounwou PB. 2008. N-acetyl-cysteine affords protection against lead-induced cytotoxicity and oxidative stress in human liver carcinoma (HepG2) cells. Intl J Environ
Res Public Health, 4(2):132–37.