RESEARCH ARTICLE
Heart morphogenesis gene regulatory networks revealed by
temporal expression analysis
Jonathon T. Hill1,2,*, Bradley Demarest1,‡, Bushra Gorsi1,‡, Megan Smith1and H. Joseph Yost1,*
ABSTRACT
During embryogenesis the heart forms as a linear tube that then undergoes multiple simultaneous morphogenetic events to obtain its mature shape. To understand the gene regulatory networks (GRNs) driving this phase of heart development, during which many congenital heart disease malformations likely arise, we conducted an RNA-seq timecourse in zebrafish from 30 hpf to 72 hpf and identified 5861 genes with altered expression. We clustered the genes by temporal expression pattern, identified transcription factor binding motifs enriched in each cluster, and generated a model GRN for the major gene batteries in heart morphogenesis. This approach predicted hundreds of regulatory interactions and found batteries enriched in specific cell and tissue types, indicating that the approach can be used to narrow the search for novel genetic markers and regulatory interactions. Subsequent analyses confirmed the GRN using two mutants,Tbx5andnkx2-5, and identified sets of duplicated zebrafish genes that do not show temporal subfunctionalization. This dataset provides an essential resource for future studies on the genetic/epigenetic pathways implicated in congenital heart defects and the mechanisms of cardiac transcriptional regulation.
KEY WORDS: Heart development, Timecourse, RNA-seq, Gene regulatory network, Zebrafish
INTRODUCTION
Embryonic development is driven by the coordinated and precise regulation of thousands of genes through gene regulatory networks (GRNs). Each GRN contains the logic circuits that encode the response of a cell to signaling pathways and other developmental cues to form a specific tissue or organ, and their disruption can cause a wide range of birth defects. Therefore, assembly of GRNs is crucial for identifying genes involved in human disease, increasing our mechanistic understanding of their interactions and providing vital information for improved diagnosis and treatment of various malformations.
One area where this progress is clearly evident is the study of congenital heart disease (CHD). CHDs are the most common class of congenital defects in newborns, and remain a major cause of morbidity and mortality in children and adults. Mutations in at least 25 transcription factors have been identified in patients with heart defects (McCulley and Black, 2012). Several of these have
been strongly linked to CHD in model organisms and humans. However, we still do not have a comprehensive view of the heart GRN, and a majority of individuals with a CHD do not have mutations in known genes (Fung et al., 2013). It is also likely that some CHDs are not genetic, but caused by environmental factors or perturbations in the epigenome that disrupt the GRN driving heart morphogenesis (Lage et al., 2012). In order to study these interactions, it is essential that the complete heart GRN be assembled.
The heart is the earliest functioning organ in the developing embryo, and is essential for normal embryonic development and growth. Morphologically, the heart forms as a linear tube located along the ventral midline of the embryo, with the inflow tract and primitive atrium located caudal to the forming ventricle and outflow tract. The heart then undergoes extensive remodeling, whereby it loops upon itself to bring the inflow and outflow tracts together and the primitive atrium into a position rostral/cranial and dorsal to the primitive ventricle (Männer, 2009). During this same time period, proliferation and addition of cardiac neural crest cells cause the chambers to expand, and ventricular trabeculation and wall compaction begin. Transcription factors, such as Tbx2 and Tbx3, repress expansion of the region separating the primitive atrium and ventricle, leading to the appearance of a constriction – the atrioventricular canal (AVC)–between the developing chambers (Ribeiro et al., 2007; Singh et al., 2012). The conduction system and endocardial cushions, which will later form the valves, begin to expand into the canal. Finally, remodeling events of the great vessels and septation of the chambers occur in mammals, birds and partially in most reptiles. These processes, except for septation, are highly conserved across vertebrate species, including lamprey, fish, reptiles, birds and mammals (Jensen et al., 2013).
Largely due to the clinical relevance of CHD, efforts to assemble the cardiac GRN have been a major focus of research for many years. As a result, several transcription factors involved in cardiac differentiation and morphogenesis have been identified, including Nkx2-5 (Chen and Schwartz, 1996) and members of the Tbx (Piotrowski et al., 2003; Plageman and Yutzey, 2005; Ribeiro et al., 2007), Gata (Pehlivan et al., 1999), Klf (Nemer and Horb, 2007) and Fox (Chi et al., 2008; Kume et al., 2001; Wang et al., 2004) families, and others (McCulley and Black, 2012). This research has focused on select interactions between individual factors and their downstream response genes. In order to build the complete GRN, current research is now using high-throughput techniques to understand how these factors interact, which genes they regulate, and how they function. This effort has been greatly aided by the development of high-throughput genomic technologies and systems biology approaches to comprehensively identify gene regulatory interactions. These technologies are greatly accelerating the pace of GRN assembly.
In order to elucidate the GRN driving heart morphogenesis and differentiation, we used a systems biology approach to identify regulatory interactions controlling temporal gene expression Received 2 May 2017; Accepted 7 August 2017
1Molecular Medicine Program, University of Utah, Salt Lake City, UT 84112, USA. 2Physiology and Developmental Biology, Brigham Young University, Provo, UT
84602, USA.
‡These authors contributed equally to this work
*Authors for correspondence ( jhill@byu.edu; jyost@genetics.utah.edu)
M.S., 0000-0002-8289-2043; H.J.Y., 0000-0003-2961-5669
DEVEL
O
the frequency of known gene regulatory interactions within the clusters. We then searched the proximal cis-regulatory regions to identify transcription factor binding motifs overrepresented in each cluster. Using these data, we constructed a large GRN model to explain the temporal expression patterns in heart morphogenesis. Importantly, this GRN contained several groups of genes with similar temporal expression patterns regulated by shared sets of multiple transcription factors, consistent with the gene battery hypothesis (Britten and Davidson, 1969; Nelander et al., 2005; Peter and Davidson, 2011). This resource provides a framework to study the effects of genetic or environmental factors that affect heart development and the complex interactions governing combinatorial control of gene batteries.
RESULTS
Identification and clustering of dynamically expressed genes in cardiac development
Heart looping and concurrent morphogenetic events begin just before 30 h post fertilization (hpf ) and are mostly complete by 72 hpf in the zebrafish (Fig. 1A). In order to identify genes that are dynamically expressed during this critical period, we conducted RNA-seq on isolated heart tissue taken from eight time points between 30 hpf and 72 hpf (three replicates per time point). In order to determine the relative similarity of the replicates and time points, we used multidimensional scaling (MDS). MDS projects multidimensional data, in this case gene counts for each of the genes in the transcriptome, onto a two-dimensional space in a way that preserves the relative distances between points as much as possible. The resulting MDS plot showed strong clustering of the replicates, except for two outlier samples (A30 and B42). Further analysis of these two samples showed that they contained a high amount ofE. coliDNA contamination, so they were excluded from subsequent analyses. MDS also showed a clear progression from 30 hpf to 72 hpf along the first axis (Fig. 1B), indicating that gene expression patterns were altered sequentially through the developmental stages analyzed.
The goal of this study was to investigate and identify gene regulatory interactions occurring during heart morphogenesis. Therefore, we identified and segregated genes that were differentially expressed over the developmental timecourse. As timecourse data are not suitable for pairwise hypothesis testing, differential gene expression was assessed using the negative binomial log ratio test in the DESeq2 package, which is conceptually similar to an ANOVA test. A total of 5861 genes exhibited dynamic changes in expression level during the time period covered (Fig. 1C, Table S1). Hierarchical clustering grouped genes into shared patterns of increasing expression, decreasing expression, transient expression and transient repression during the time window studied (Fig. 1D). The fact that a large number of genes have changing expression patterns across our dataset highlights the complexity of the developmental processes active during our timecourse.
loading values. Another important feature of SOM analysis is that the algorithm lays out each co-clustered gene expression pattern within a box (with relative expression on they-axis and temporal expression on thex-axis) and places each box on a relational grid, with converse patterns at opposite corners and similar patterns grouped more closely together, allowing the expression patterns of genes in different clusters to be compared visually to determine whether they are largely similar or are largely contrasting.
The number of nodes in an SOM must be chosena prioriand is considered to be largely arbitrary, although SOMs using a low number of nodes provide results conceptually similar to k-means clustering, whereas grids with large numbers of nodes show emergent properties that make them more topographical in nature. For our purposes, we chose to cluster the dynamically expressed genes using an SOM with a small number of nodes to create a set of discrete expression patterns. Thus, we chose a rectangular 5×5 grid (Fig. 2A, a complete table of normalized counts and SOM assignments is available in Table S2) as the optimal number of nodes, since it was the maximum size that did not result in any nodes containing no genes and had nodes that produced similar, but distinct, expression patterns. Larger numbers of nodes resulted in multiple nodes with what appeared to be identical expression patterns and one or more empty nodes (data not shown). Conversely, smaller numbers of nodes merged clearly distinct patterns into a single node (data not shown). The resulting grid had clusters containing 5-1125 dynamically expressed genes. The largest clusters recapitulated the major patterns seen by hierarchical clustering, but intermediate patterns were more clearly represented in the other nodes. Of note, genes expressed at constant levels throughout our timecourse (P>0.05) were not included in the SOM analysis, but were assigned to an outgroup. The resulting outgroup contains many genes essential for heart development that were assigned to this cluster because their expression, and likely their function, does not change during the window covered.
SOM clusters contain cohorts of co-regulated genes
Because the SOM-derived clusters contain genes with similar temporal expression patterns in the heart, we hypothesized that the clusters represent groups of co-regulated genes. If this hypothesis is correct, we would expect there to be more gene regulatory interactions within a cluster than between clusters. Databases with known gene regulatory interactions in zebrafish are lacking. Therefore, we first converted the zebrafish gene identities to their human orthologs using the Orthoretriever program (http:// lighthouse.ucsf.edu/orthoretriever/), which is an interface to the Ensembl BioMart version 77 database (Kasprzyk, 2011). We then calculated the number of known gene regulatory interactions within clusters and between clusters using the GEA_CLR database in the UCSC Interaction Browser, a database of known interactions from various sources (Wong et al., 2013). The resulting graph of the interactions for cluster A1 is shown in Fig. 2B, and those for all clusters can be found in Fig. S1. Visual analysis of this graph
DEVEL
O
appears to show a large number of interactions, with a few highly connected nodes and many nodes with a few connections, which are likely to represent regulators and their targets, respectively.
However, this inspection is insufficient to ascertain whether the number of interactions within the graph is higher than expected with a randomly selected group of genes this size. Therefore, we calculated the assortativity coefficient for all clusters in the SOM graph. The assortativity coefficient measures the homophily of the data, i.e. the relative probability of interacting with another member of one’s own class versus another class. In this case, a gene’s class was taken to be its SOM-assigned cluster. Thus, the assortativity coefficient gives a relative measure of the number of connections within an SOM cluster versus the number of connections between SOM clusters. A positive coefficient indicates that nodes are more likely to connect to members of the same cluster, and vice versa for negative coefficients. Larger assortativity values indicate stronger preferences, but this is difficult to gauge without context. Therefore, to determine the significance of this coefficient, a bootstrap null distribution was calculated using 10,000 replicates containing randomly scrambled cluster assignments (Fig. 2C). The calculated assortativity coefficient for the SOM clustering results was significantly greater than the mean (Fig. 2C, red line), with a bootstrap P-value less than 1×10⁻⁵. Therefore, we can reject the null hypothesis that expression clusters are independent of co-regulated cohorts, suggesting that the SOM clustering corresponds
to groups of genes containing a large number gene regulatory interactions.
Although it is not currently possible to measure the level of conservation between the GRNs in zebrafish and mammalian heart development, this analysis supports the hypothesis that most regulatory interactions are conserved between zebrafish and humans. Otherwise, clustering zebrafish expression patterns would not have enriched known human regulatory interactions. Thus, this dataset will be useful for informing studies of heart development across several classes within the phylum Chordata. Indeed, when unconserved regulatory interactions are identified, they may indicate evolutionary divergence of the network to drive unconserved developmental processes, such as septation. These divergences will also provide important information on the mechanisms and evolution of cardiac GRNs.
Motif enrichment in specific temporal expression clusters identifies gene batteries within GRNs
[image:3.612.143.469.57.329.2]One limitation of the aforementioned method is that interactions are constrained to known human gene regulatory interactions contained in the GEA-CLR database (Lee et al., 2015; Lowdon et al., 2014; Wong et al., 2013). Therefore, we next sought to identify novel regulatory interactions responsible for the gene expression patterns identified in our SOM analysis. In order to predict novel gene regulatory interactions within the developing heart, we sought to identify Fig. 1. RNA-seq timecourse analysis during heart looping morphogenesis.(A) Schematic of zebrafish heart (green) looping during the time period covered by the timecourse. Although several overlapping morphogenetic events are occurring, including cardiomyocyte maturation, initial trabeculation and sino-atrial (SA) node, atrioventricular canal (AVC) and valve formation, animals were staged based on heart looping. (B) Multidimensional scaling (MDS) of the RNA-seq samples. Relative distances between samples indicate their relative similarity (closer indicates more similar). Letters indicate the replicate (A, B or C); numbers (and colors) indicate the hours post-fertilization that the sample was collected. Each sample contained pooled hearts from∼200 embryos. Outliers A30 and B42 were excluded from subsequent analysis. (C) Volcano plot showing the maximum log2-scaled fold change of any time point compared with 30 hpf on the x-axis and the Phred-scaledP-value of the negative binomial likelihood ratio test, which tests for differential expression anywhere in the timecourse, on the y-axis. The blue horizontal line shows a Phred-scaledP-value cutoff of 13 (equivalent to aP-value of 0.05). The green vertical lines indicate a log2fold change cutoff of 1 and−1. Further analyses were conducted only on the differentially expressed genes in the upper left and upper right quadrants. (D) Heat map and hierarchical clustering of genes showing statistically significant changes in gene expression over the timecourse. Red indicates high expression and blue indicates low expression. Replicates were first averaged to create one column per time point.
DEVEL
O
transcriptional regulatory interactions driving gene batteries. Gene batteries were first proposed in a classic work that has inspired GRN analysis for the last half century (Britten and Davidson, 1969; Peter and Davidson, 2011). Under this model, it is expected that groups of genes with the same expression pattern would be regulated by a common set of one or more transcription factors, and evidence of gene battery regulation has been reported using cohorts of genes with similar spatial
expression patterns (Nelander et al., 2005; Zhang and Horvath, 2005). These gene batteries are the building blocks of GRNs (Peter and Davidson, 2011). Therefore, we hypothesized that gene batteries in the developing heart could be identified from sets of genes with shared temporal expression patterns.
[image:4.612.89.528.61.570.2]In order to identify novel gene batteries from the timecourse data, we used the HOMER program (Heinz et al., 2010), which contains Fig. 2. Self-organizing map (SOM) analysis of differentially expressed genes during heart looping.(A) SOM results for the timecourse data. Each panel represents one cluster identified by SOM analysis. The red line indicates the median expression for the pattern, while the blue and gray regions represent the interquartile range (IQR) and the range of the expression levels, respectively. Numbers in the lower right corner indicate the number of genes assigned to each SOM cluster. (B) Graph of interactions found in the GEA_CLR database from the UCSC Interaction Browser between two genes within cluster A1. Orange lines indicate an activating interaction, blue lines a repressing interaction, and gray lines indicate unknown interaction types. (C) Bootstrap analysis of the assortativity coefficients using randomized cluster assignments (10,000 replicates). The vertical red line indicates the assortativity coefficient for the actual results, which was greater than any of the 10,000 bootstrap replicates.
DEVEL
O
motifs generated from a number of sources, including ChIP data and
in vitrotranscription factor binding assays, to identify transcription factor binding sites statistically overrepresented in the proximal regions of the genes assigned to each SOM cluster. Identification of transcription factor binding sites near the transcription start site does not conclusively show regulation of the gene, but statistical enrichment of binding sites within promoters of genes with similar temporal expression patterns (single SOM clusters) provides strong evidence of co-regulation, as transcription factor binding motifs that are not actively involved in temporal regulation should be randomly distributed throughout the SOM, not enriched in particular clusters. This analysis identified 48 transcription factor binding motifs enriched in 17 of the 25 clusters (Fig. 3). Within this dataset were 9 of the 18 transcription factors that have been implicated in human patients with CHD (McCulley and Black, 2012) and are included in the HOMER motif database (Heinz et al., 2010). The number of interactions predicted by HOMER that are also found in the GEA_CLR database was calculated to show the ability of the method to capture known gene regulatory interactions,
strengthening the concurrence of the novel gene regulatory interactions that we have identified. The percentage of HOMER-predicted interactions that were in the database (ʻknown’) or not (ʻnovel’) varied greatly between transcription factors (Fig. 3, Table S3). On average, 36% of the gene regulatory interactions predicted by this analysis were contained within the GEA_CLR database, consistent with previous gene battery prediction results using cohorts of spatially co-expressed genes (Nelander et al., 2005). Thus, on average 64% of the predicted interactions represent putative novel gene regulatory interactions in the developing heart, providing a rich set of predicted interactions for future analysis of heart development.
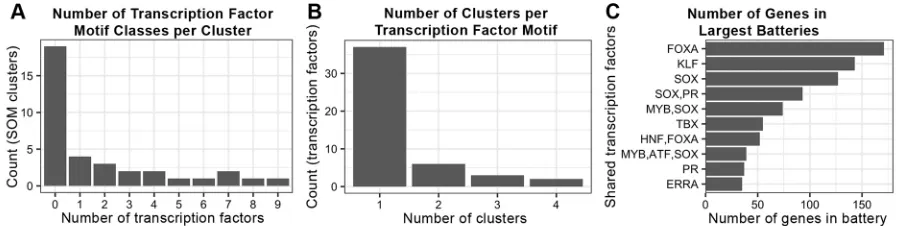
[image:5.612.88.529.285.701.2]There were two striking outcomes of this analysis. First, the majority of the identified transcription factor binding motifs were enriched in only a single SOM cluster; for example, TBX, ETS and BMAL in SOM A1, B4, D3, respectively. Second, the majority of clusters contained fewer than three enriched transcription factors (Fig. 3B, Fig. 4A,B). The number of transcription factor binding motifs found in a particular cluster was not correlated with the size
Fig. 3. Transcription factors binding motifs enriched in specific SOM clusters.(A) Transcription factor binding motifs enriched in one or more clusters. Gene regulatory interactions predicted by HOMER and found in the GEA_CLR database (‘known’) or not found in the GEA_CLR database (‘novel’) are shown, as well as the percentage of interactions that are novel. (B) Enriched transcription factor motifs and their respective SOM clusters.
DEVEL
O
of the cluster (Pearson correlation coefficient r=0.09). For clusters with multiple transcription factors, distinct subsets and groups containing multiple binding sites were seen. These groups form the putative gene batteries predicted by this analysis and are often large, with up to 157 genes containing a single transcription factor binding site (Fig. 4C). Evidence for combinatorial control of these gene batteries was also seen, as many batteries of similarly expressed genes contained binding sites for several different transcription factors (Fig. 4C). Transcription factors that were enriched in multiple clusters also tended to be enriched in adjacent clusters, indicating that they regulate genes with similar temporal expression patterns (Fig. 5A), with subtle differences provided by the different combinatorial factors found in adjacent clusters. Although it is possible that their enrichment in multiple adjacent patterns indicates that the SOM cluster subdivided cohorts of genes that should be considered to be of the same cluster, the complement of enriched transcription factor binding motifs differs for every cluster. Therefore, it is more likely that combinatorial control by multiple transcription factors creates small variations in the temporal expression patterns of their target genes.
Many transcription factors can act as both repressors and activators depending on their interaction with various co-factors. Because the SOM clusters are laid out spatially by temporal expression pattern, gene batteries activated by a given transcription factor should regulate genes in their same cluster or in clusters nearby, as activation results in a positive correlation between the expression levels of a transcription factor and its targets. Conversely, gene batteries repressed by a transcription factor should be expressed in clusters arranged at opposite sides of the SOM grid, as repression results in a negative correlation between a transcription factor and its targets. Therefore, analyzing the relationships between the assignment of transcription factors to an SOM cluster based on expression pattern and the clusters enriched with targets for those transcription factors might help determine whether the identified regulatory interactions represent activation or repression by a specific transcription factor. In order to test this hypothesis, we selected two well-characterized transcription factor families in heart development–Sox and Klf–and compared the SOM clusters containing members of that transcription factor family with the SOM clusters that contained predicted targets. Sox family members, especially the SoxE subfamily, have been shown to be expressed dynamically during heart looping and valve development in the chick (Montero et al., 2002). In our data analysis, Sox was the transcription factor family with the largest battery of gene targets, with 1087 target genes (643 known and 444 novel) across four SOM clusters (A3, A4, A5, B5, Fig. 3A, Fig. 5B). Of note, all of the clusters enriched for Sox binding motifs are located in the lower left corner of the SOM grid, corresponding to
genes expressed early during development and inactive at the end of the timecourse. Twelve Sox family members were also expressed in A3 (Sox12), A4 (Sox9a), A5 (Sox1b, Sox2, Sox3, Sox9b, Sox11a, Sox18, Sox19a and Sox19b) and B5 (Sox19b and Sox21a). Of these, ten have known transactivation domains (Lefebvre et al., 2007). Sox6 was the only Sox family member not to follow this pattern, with expression in C1. Interestingly, Sox6 does not have any known activation or repression domains, but only contains several dimerization domains (Lefebvre et al., 2007). Together, the data strongly support the hypothesis that Sox family members play an activating role during early stages of heart development and are largely downregulated by the completion of heart looping.
Another transcription factor family with multiple family members and clusters with enriched binding site motifs is the Klf family. Klf motifs were enriched in four SOM clusters (Fig. 5C), three on the right side and one in the lower left hand corner (Fig. 5C). Klf family member expression is also divided into two groups, with Klf1 (A3), Klf8 (A4), Klf13 (A4) and Klf17 (A5) expression in the lower left clusters and Klf11b (B1), Klf12a (D1), Klf5a (E1), Klf18 (C2), Klf6a (E3), Klf11a (C1), Klf2a/b (E2), Klf9 (E2) and Klf15 (E2) expression in the upper right corner. Further studies are necessary to determine why our analysis breaks Klf family members into two distinct classes, but it might be that distinct sets of Klf factors are involved in early and late processes during heart development. Alternatively, or in addition, Klf factors may be involved in repressing and activating distinct sets of genes. Klf family members with dynamic expression during this timecourse also include those known to be involved in heart development, such as Klf2 (Chiplunkar et al., 2013), Klf3 (Kelsey et al., 2013), Klf5 (Drosatos et al., 2016) and Klf13 (Nemer and Horb, 2007), as well as several novel factors. Thus, it is possible that subsets of Klf factors play at least two distinct roles in the developing heart–one early and one late. These data will be useful in guiding future research that aims to determine the contrasting roles of the individual Klf members identified here.
Inclusion of predicted transcription factor binding motifs expands the gene regulatory interaction graph for each cluster
[image:6.612.81.532.58.171.2]We next sought to determine the effect on the gene regulatory interaction graphs when transcription factors with enriched motifs in the cluster were added. We began with analysis of cluster A1, which was enriched for a single class of transcription factor binding motif: the Tbx family. Although several Tbx factors have been implicated in heart development (Plageman and Yutzey, 2005), including Tbx1, Tbx2, Tbx3, Tbx5 and Tbx18, none of the genes encoding these transcription factors was in the A1 cluster, as they were Fig. 4. Characteristics of enriched transcription factor binding motifs.(A) The number of transcription factor binding motifs enriched in each cluster. (B) The number of clusters that each transcription factor binding motif is enriched in. (C) The ten largest gene batteries. Genes were grouped by shared complement of transcription factor binding sites enriched in the first 1 kb upstream of the transcription start site.
DEVEL
O
generally expressed at constant levels during the timecourse, sorting to the SOM outcluster. Therefore, we chose to add these transcription factors to the gene list for cluster A1 and generate a new graph based on known interactions in the GEA_CLR database (Fig. 6A). Four of the five genes had multiple known gene regulatory interactions with genes in the cluster and became major nodes within the graph. Interestingly, Tbx18, which is expressed exclusively in the epicardium except for a small region of expression in the myocardium at the sinus venosus (Greulich et al., 2011), displayed no known gene regulatory interactions with genes in the graph. The overall graph grew from 58 nodes to 66 nodes and 124 edges to 196 edges. This graph also shows strong evidence for gene batteries under combinatorial control. In order to highlight these groups, we created a hierarchical clustering based on known gene regulatory interactions in cluster A1 (Fig. 6B). The resulting dendrogram shows six putative gene batteries containing two to seven genes each (red branches).
Testing the proposed GRN with cardiac transcription factor mutants in mice and zebrafish
We sought to determine whether our predicted GRN interactions from the SOM and motif enrichment analyses were supported by differential expression analysis in cardiac transcription factor mutants. First, we compared enrichment of differentially expressed genes in the Tbx5 mouse knockout model (Waldron et al., 2016). Mouse data were used owing to the lack of such genomic data for tbx5a/b null fish, although they have a similar phenotype (Parrie et al., 2013). Differentially expressed genes from that study were compared with their zebrafish orthologs in our data to identify enrichment in SOM clusters, specifically in cluster A1, which showed an overrepresentation of Tbx family motifs. Overall, 1110 SOM-assigned genes were differentially expressed in the
[image:7.612.65.550.60.486.2]Tbx5 null mouse heart. In cluster A1, 90 of the 149 genes were differentially expressed inTbx5mutant hearts, including 40 of the 52 genes with predicted Tbx binding motifs and identifiable mouse Fig. 5. Distribution of enriched transcription factor motifs across the SOM.(A) Enriched transcription factor binding motifs in their corresponding SOM cluster locations. Black font indicates transcription factor binding motifs enriched exclusively in one SOM cluster. Colored transcription factor binding motifs are found in more than one cluster. (B) Correspondence of Sox gene expression (diagonal lines) and Sox binding motif enrichment (orange shading) in the SOM clusters. (C) Correspondence of Klf gene expression (diagonal lines) and Klf motif enrichment (green shading) in the SOM clusters.
DEVEL
O
orthologs (Fig. 7A). It should be noted that the published RNA-seq data contained only two biological replicates, represented only a single developmental time point, and were obtained in mouse, thus requiring lift-over into another species. Despite these limitations, we were able to identify strong concurrence of altered expression with our gene assignments to Tbx-enriched SOM clusters, highlighting the predictive power of our zebrafish datasets and the applicability of this analysis for cross-species comparisons.
We next analyzed nkx2-5 mutant zebrafish embryos as a confirmation of a transcription factor binding motif that was not enriched in any SOM cluster, and thenkx2-5transcript was assigned to the outcluster with other transcripts that were expressed in the heart at steady-state levels. Nkx2-5 is a well-studied transcription factor that is known to be involved in cardiomyocyte differentiation (Benson et al., 1999; McCulley and Black, 2012; Tanaka et al., 1999). Thenkx2-5mutant phenotype in zebrafish includes looping and chamber size defects (Hill et al., 2013; Targoff et al., 2008), indicating that it may play a role in the heart development processes studied here. A recent study showed that Nkx2-5 expression in early cardiomyocyte differentiation was sufficient to maintain chamber identity and size (George et al., 2015). Thus, it is possible that Nkx2-5 acts early in differentiation to establish gene expression patterns for heart development and regulates the continued, steady-state expression of a cohort of genes during the period covered by our timecourse. Consistent with this,nkx2-5RNA expression was constant in our timecourse, and assigned to the SOM outgroup.
To further explore the hypothesis that Nkx2-5 acts earlier in development, we analyzed genes differentially expressed between
nkx2-5 null and sibling embryos at 48 hpf to identify their SOM assignments in our timecourse analysis. In contrast to the large number of SOM-assigned genes that are differentially expressed in theTbx5mutant mouse, most genes that were differentially expressed
innkx2-5null zebrafish embryos were assigned to the SOM outgroup, and only 57 SOM-assigned genes showed differential expression between nkx2-5 mutant and sibling embryos, comprising 38 upregulated and 19 downregulated genes in nkx2-5 mutants (Table S4). Strikingly, the differentially expressed genes were separated into two distinct SOM clusters based on the direction of change in thenkx2-5mutant (Fig. 7B). Of the 38 upregulated genes, 35 clustered into SOM clusters with increasing expression during heart looping and chamber maturation (clusters B1, C1, D1, D2 and E1-5). Similarly, 14 of the 19 downregulated genes clustered into the lower left corner (clusters A5, B5 and C5), corresponding to genes that show decreasing expression during looping and chamber maturation. However, in neither case would these numbers be sufficient to create a statistically significant overrepresentation in the patterns, consistent with our motif enrichment results. Together, the
[image:8.612.62.554.60.225.2]Tbx5andnkx2-5mutant data support the power of the model GRN generated here to predict the gene regulatory interactions driving major expression patterns in the heart during looping morphogenesis. The findings with Nkx2-5 highlight one of the limitations of this type of study. Although our timecourse encompassed heart looping morphogenesis, it is still unclear how the timing between gene regulatory interactions and morphogenetic events is related. Transcription factors may make epigenetic changes that set the stage for subsequent regulatory events. For example, we have recently shown that Nkx2-5 regulates DNA methylation patterns (Gorsi et al., 2017 preprint). This might also explain the absence of GATA factor binding sites in our analysis, as GATA factors have been shown to interact with Nkx2-5 early in development (Searcy et al., 1998). Both Gata4 and Nkx2-5 expression, as well as that of several other canonical heart transcription factors, was detected by the RNA-seq data presented here, but their expression levels were constant throughout the timecourse, so they were not clustered by Fig. 6. GRNs for cluster A1.(A) Gene regulatory interaction graph for SOM cluster A1 with Tbx transcription factors added. (B) Hierarchical clustering dendrogram based on vertex similarity in the graph shown in A. Putative batteries with identical edges in the graph are marked by a red line.
Fig. 7. SOM cluster assignment of genes with altered expression inTbx5 mutant mice andnkx2-5mutant zebrafish.(A) Comparison of genes in cluster A1 predicted to have Tbx binding sites with those differentially expressed in theTbx5null mouse. (B) Location of genes with altered expression innkx2-5null zebrafish hearts at 48 hpf in the SOM.
DEVEL
O
[image:8.612.50.417.637.731.2]SOM and were assigned to the outgroup. The enrichment analysis, by its nature, also misses isolated gene regulation events for small sets of genes, instead focusing on regulatory events that appear to simultaneously affect the expression of many genes. Therefore, the expression patterns identified here should not be taken as an exhaustive list of regulatory events found in the heart, but this approach certainly provides a broad representation of the major temporal gene expression patterns during heart morphogenesis.
Analysis of cell type-specific and tissue-specific gene batteries
Many of the concurrent developmental processes occurring during this timecourse are restricted to subsets of cell types or tissues. Although it is important to recall that aʻdifferentiation gene battery is not the same thing as a cell type’(Peter and Davidson, 2011), we asked whether a subset of SOM clusters would be confined to specific cell types or tissues in the developing heart. We created 13 hand-curated lists containing 398 known tissue-specific markers (Table S5), described here in three groups.
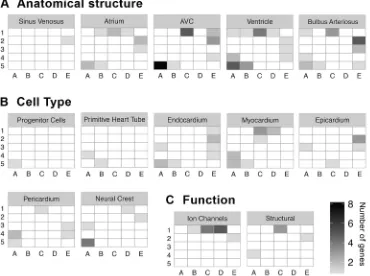
The first group contained markers for the major structures in the embryonic zebrafish heart: sinus venosus, atrium, AVC, ventricle and bulbus arteriosus (Fig. 8A). The markers for all of these structures appear to be distributed into three distinct groups: early, middle, and late expression.
The second group contained genes expressed in each of the major cell types of the embryonic heart: progenitor, endocardial, myocardial, epicardial, pericardial and neural crest cells (Fig. 8B). Progenitor cell markers were enriched in the lower left corner of the SOM, i.e. decreasing over time, as expected. Neural crest cells also showed enrichment for genes with decreasing expression patterns, although a few genes were increasing. By contrast, the four major tissue types in the heart (endocardium, myocardium, epicardium and pericardium) showed distinct expression patterns, predominantly found in mutually exclusive clusters. For example, the myocardial markers were enriched in the upper middle side of
the SOM (clusters C1, C2, D1), and the epicardial markers were enriched on the righthand side of the SOM (clusters E2, E3), indicating that the genes are generally increasing. This is consistent with the timing of epicardial migration to cover the heart, which is not complete until after the period covered by our timecourse (Peralta et al., 2014). Conversely, pericardial markers were largely decreasing. Finally, the other two major cell types, endocardium and myocardium, showed a complex expression pattern, with some genes decreasing and others increasing during the timecourse. Although the clusters containing the decreasing genes were largely overlapping, the clusters with increasing genes differed between cell types, with myocardial markers increasing expression earlier than endocardium.
Finally, the third group contained genes encoding ion channels and structural proteins such as muscle fiber components (e.g. actin and myosin). Strikingly, both categories were enriched in the top middle of the SOM, indicating that expression comes on at∼48 h and remains on for the remainder of the timecourse (Fig. 8C).
In conclusion, although these tissues are undergoing active and complex gene regulatory events throughout the timecourse, cluster information for a particular gene may provide clues to its likely role within heart development, and in the hunt for functions of novel genes this might allow investigations to focus on particular cell and tissue types according to SOM assignment of that gene. For example, comparison of novel genes co-regulated with known tissue-specific genes in a given SOM cluster would provide insight into the likely spatial localization of the novel gene, creating testable hypotheses for future studies.
Timecourse analysis identifies pairs of duplicated genes with similar expression patterns
[image:9.612.49.419.461.737.2]Sets of duplicated genes are common in many vertebrates, and it is thought that these duplicated genes create an important source of phenotypic divergence in evolution (Prince and Pickett, 2002). Although there have been several genome duplication events during
Fig. 8. Distribution of genes involved in specific processes/cell types within the SOM.A curated list of annotations for genes known to be involved in heart development was generated from the literature. Each panel represents a single annotation, and the location of shaded rectangles within the panel corresponds to SOM clusters where the genes with that annotation are located. The color of the shading indicates the number of genes for the given annotation found in the corresponding SOM cluster.
DEVEL
O
between the two copies. Thus, we analyzed all pairs of duplicated genes in the timecourse to measure the amount of divergence in expression patterns, and to identify genes that have retained similar expression patterns. A total of 1272 duplicated gene pairs had at least one gene differentially expressed and assigned to SOM clusters during our timecourse. Of these, 287 (22.6%) had both members of the pair assigned to SOM clusters, supporting the hypothesis that most pairs diverge into vastly different expression patterns. However, when both members of the pair were dynamically expressed over our timecourse, they frequently showed very similar expression patterns. Of the 287 pairs in the SOM, 61 were in the same cluster and 100 were in adjacent clusters (Fig. S2, see Table S6 for complete analysis). Future studies will focus on analysis of these pairs to determine the nature of their retained redundancy and to pursue functional tests to assess whether the evolutionary process of subfunctionalization explains their continued co-expression.
DISCUSSION
The genomics approach used here identified several major temporal gene expression patterns in the heart during looping morphogenesis, as well as key transcription factors driving these expression patterns. These data were then used to generate a model GRN for heart looping morphogenesis and concurrent processes, providing a valuable resource for future GRN studies in the heart. The model GRN assembled here represents a predictive network that identifies putative regulatory mechanisms for large batteries of genes in heart morphogenesis. Many of these gene batteries do not only share sites for a single transcription factor, but for a number of potentially interacting transcription factors. This characteristic would be missed by traditional analysis methods focusing on knockdown or knockout of a single transcription factor and provides an important dataset for studying the combinatorial control of gene expression.
Although this is the first heart looping morphogenesis RNA-seq timecourse in zebrafish, three timecourses have been conducted in cell cultures or mice. The timecourse conducted by Wamstad et al. (2012) followed gene expression patterns while differentiating mouse ESCs into cardiomyocytesin vitro. Each data point in their study thus represented a distinct cell type (embryonic stem cells, mesoderm, cardiac progenitors, and cardiomyocytes), all of which are likely to represent cell types earlier in development than covered by our data. By contrast, most of the time points in the single-cell timecourse generated by Delaughter et al. (2016) were taken after heart looping, including two postnatal time points. The most similar timecourse to ours was created by Li et al. (2016), which contains three time points during heart looping, but was generated using single-cell sequencing of mouse cardiomyocytes at three time points as compared with the eight time points collected in our study. Thus, both the similarities and differences between these datasets might provide key insights into heart development. However, it should be emphasized that these datasets are complementary, rather than redundant, with the dataset presented here. It is established that
Heart collection and total RNA collection
Groups (∼20 males and∼20 females) of fish positive for thecmlc2:GFP transgene (Huang et al., 2003) were mated to generate large synchronized clutches of embryos. After the embryos were collected and cleaned, they were divided into eight groups of∼200 embryos for heart isolation at 30, 36, 42, 48, 54, 60, 66 or 72 hpf. Embryos were dechorionated as needed and anaesthetized by adding 0.02% tricaine to the embryo dish. Hearts were then isolated as previously described (Burns and MacRae, 2006), except that hearts were manually selected from the medium instead of filtering. Hearts were then placed in fresh medium and manually picked again, to ensure no carryover of non-cardiac tissues, and placed in a 1.5 ml microcentrifuge tube. Tubes containing the isolated hearts were centrifuged briefly (1000g for 30 s) to pellet the tissue and the supernatant removed under a microscope. Approximately 2 µl Trizol (Life Technologies) per heart was then added to the tube and the hearts homogenized before storage at−80°C. RNA was isolated by phenol-chloroform extraction followed by ethanol precipitation using standard protocols. In order to obtain the necessary amount of RNA for library preparation, the total RNA from two collections were combined together at each time point. Therefore, the three replicates in this experiment arose from a total of six collections conducted on different days.
RNA-seq
Library construction and RNA sequencing (RNA-seq) were performed at the Huntsman Cancer Institute High-Throughput Genomics Core Facility. Libraries were constructed from the total RNA using the NuGEN Ovation RNA-Seq Library System. Sequencing was performed on a HiSeq 2000 sequencer (Illumina) to generate 50 bp single-end reads. Three biological replicates for each of the eight time points (24 samples) were split across four lanes. Post-sequencing quality control was conducted by FastQC (https:// www.bioinformatics.babraham.ac.uk/projects/fastqc/). The total number of reads ranged from 22-34 million reads per sample and both per-base and per-sequence quality scores were above 30 for more that 90% of the reads. Sequencing results were then aligned by Novoalign (Novocraft) to a reference genome containing the zv9 build of the zebrafish genome and a set of known and theoretical splice junctions generated from the Ensembl version 75 genome annotation using the MakeTranscriptome program in the USeq package (Nix et al., 2008).
Differential gene expression analysis and clustering
Differential gene expression and clustering analyses were performed in R. First, a count matrix of the data was created using the package Rsubread (Liao et al., 2013). Next, consistency of the replicates was assessed using the plotMDS function in the EdgeR package (Robinson et al., 2009) using default parameters, which include the 500 genes with the largest pairwise distances for analysis. Based on this analysis, we removed replicate A30 and B42 from all future analyses. Because timecourse experimental designs do not involve a clear case versus control or baseline comparison, genes that were differentially expressed over the timecourse were determined by the negative binomial log ratio test in the DESeq2 package (Love et al., 2014). Genes with an adjusted P-value less than 0.05 were selected. The rlog normalized values (generated by DESeq2) of the replicates were then averaged to generate a single expression value for each gene at each time point. These values were converted to z-scores and clustered using the som package (https://CRAN.R-project.org/package=som) and a rectangular 5×5 grid. Grid size was determined by the maximum dimensions not resulting in
any empty clusters.
DEVEL
O
Known gene regulatory interaction analysis
The interconnectedness of each SOM cluster was measured using known gene regulatory interactions in the GLR_CEA database on the UCSC Interaction Browser (Wong et al., 2013). Interaction lookups were limited to those where both the source and the sink were contained within the SOM cluster being analyzed.P-values were calculated by generating a bootstrapped distribution from 10,000 groups of randomly assigned gene clusters and determining the interconnectedness within the random groups. All network graphs were created in R using the igraph package (Csardi and Nepusz, 2006).
Motif enrichment analysis
Overrepresentation of transcription factor binding motifs in the proximal promoter regions of the genes in each cluster was determined using the HOMER program (Heinz et al., 2010) set to search 1000 bp upstream and 100 bp downstream of the transcription start site. All genes were used as the background set forP-value calculation. Results presented here are limited to known motifs.
nkx2-5andTbx5RNA-seq comparisons
Comparisons between our timecourse and RNA-seq data fromnkx2-5mutant zebrafish embryos andTbx5mutant embryonic mouse hearts were conducted using data generated in our lab (Gorsi et al., 2017 preprint) and existing data (Waldron et al., 2016), respectively.nkx2-5data were generated from 48 hpf zebrafish hearts collected from nkx2-5 mutant and wild-type siblings identified phenotypically. Differential expression for both genes was conducted using DESeq2 (Love et al., 2014). For mouse Tbx5, differentially expressed genes were converted to their zebrafish orthologs using Orthoretriever, and then merged with the SOM classification by Gene ID. Genes differentially expressed in thenkx2-5data were directly compared with the SOM assignments.
Spatial gene expression analysis
SOM assignment of known markers was conducted using a hand-curated list of genes created by an extensive literature search (Table S5). Genes identified in the literature were annotated for function, anatomical location and/or cell type. These lists were then merged with the SOM gene assignments and each annotation visualized in R.
Duplicate gene analysis
Pairs of genes duplicated in the zebrafish genome were downloaded from the Ensembl database (Ensembl release 88) and merged with the SOM data table to identify the cluster locations of each. Relative distances between pairs were calculated using the Euclidean distance on the grid: a distance of 0 indicates both members of the pair are in the same SOM cluster, a distance of 1 indicates members are in adjacent clusters, a distance of 1.4 indicates diagonal clusters, and larger distances indicate more distant clusters.
Ethics approval
All animal research was approved by the University of Utah IACUC committee ( protocol number 15-06004).
Competing interests
The authors declare no competing or financial interests.
Author contributions
Conceptualization: J.T.H., H.J.Y.; Methodology: J.T.H., B.D., M.S., H.J.Y.; Software: J.T.H., B.D.; Validation: J.T.H., B.D., B.G.; Formal Analysis: J.T.H., B.D., B.G.; Investigation: J.T.H., M.S.; Resources: H.J.Y.; Data Curation: J.T.H., B.D., B.G.; Writing - original draft: J.T.H., B.G., H.J.Y.; Writing - review and editing: J.T.H., B.D., B.G., H.J.Y.; Visualization: J.T.H., B.D.; Supervision: J.T.H., H.J.Y.; Project Administration: H.J.Y.; Funding Acquisition: H.J.Y.
Funding
This study was funded by a National Heart, Lung, and Blood Institute (NHLBI) Bench-to-Bassinet Consortium (http://www.benchtobassinet.com) grant to H.J.Y. (2UM1HL098160) and sequencing was provided by a NHLBI core facilities support grant to the New England Research Institute (U01 HL098188). Deposited in PMC for release after 12 months.
Data availability
RNA-seq data are available at the NCBI Sequence Read Archive under accession SRP117696 or (with Flash and Java enabled) at https://b2b.hci.utah.edu/gnomex/ gnomexFlex.jsp?requestNumber=152R.
Supplementary information
Supplementary information available online at
http://dev.biologists.org/lookup/doi/10.1242/dev.154146.supplemental
References
Benson, D. W., Silberbach, G. M., Kavanaugh-McHugh, A., Cottrill, C., Zhang, Y., Riggs, S., Smalls, O., Johnson, M. C., Watson, M. S., Seidman, J. G. et al.
(1999). Mutations in the cardiac transcription factor NKX2.5 affect diverse cardiac developmental pathways.J. Clin. Invest.104, 1567-1573.
Britten, R. J. and Davidson, E. H.(1969). Gene regulation for higher cells: a theory. Science165, 349-357.
Burns, C. G. and MacRae, C. A.(2006). Purification of hearts from zebrafish embryos.Biotechniques40, 274-282.
Chen, C. Y. and Schwartz, R. J.(1996). Recruitment of the tinman homolog Nkx-2.5 by serum response factor activates cardiac alpha-actin gene transcription. Mol. Cell. Biol.16, 6372-6384.
Chi, N. C., Shaw, R. M., De Val, S., Kang, G., Jan, L. Y., Black, B. L. and Stainier, D. Y. R.(2008). Foxn4 directly regulates tbx2b expression and atrioventricular canal formation.Genes Dev.22, 734-739.
Chiplunkar, A. R., Lung, T. K., Alhashem, Y., Koppenhaver, B. A., Salloum, F. N., Kukreja, R. C., Haar, J. L. and Lloyd, J. A.(2013). Krüppel-like factor 2 is required for normal mouse cardiac development.PLoS ONE8, e54891.
Csardi, G. and Nepusz, T.(2006). The igraph software package for complex network research.Int. J. Complex Sys.1695, 1-9.
DeLaughter, D. M., Bick, A. G., Wakimoto, H., McKean, D., Gorham, J. M., Kathiriya, I. S., Hinson, J. T., Homsy, J., Gray, J., Pu, W. et al.(2016). Single-cell resolution of temporal gene expression during heart development.Dev. Cell 39, 480-490.
Drosatos, K., Pollak, N. M., Pol, C. J., Ntziachristos, P., Willecke, F., Valenti, M.-C., Trent, C. M., Hu, Y., Guo, S., Aifantis, I. et al.(2016). Cardiac myocyte KLF5 regulates Ppara expression and cardiac function.Circ. Res.118, 241-253.
Fung, A., Manlhiot, C., Naik, S., Rosenberg, H., Smythe, J., Lougheed, J., Mondal, T., Chitayat, D., McCrindle, B. W. and Mital, S.(2013). Impact of prenatal risk factors on congenital heart disease in the current era.J. Am. Heart Assoc.2, e000064.
George, V., Colombo, S. and Targoff, K. L.(2015). An early requirement for nkx2.5 ensures the first and second heart field ventricular identity and cardiac function into adulthood.Dev. Biol.400, 10-22.
Gorsi, B., Mosbruger, T., Smith, M., Hill, J. T. and Yost, H. J.(2017). Nkx2.5-dependent alterations of the embryonic heart DNA methylome identify novel cis-regulatory elements in cardiac development.bioRxiv, doi:10.1101/186395.
Greulich, F., Rudat, C. and Kispert, A.(2011). Mechanisms of T-box gene function in the developing heart.Cardiovasc. Res.91, 212-222.
Heinz, S., Benner, C., Spann, N., Bertolino, E., Lin, Y. C., Laslo, P., Cheng, J. X., Murre, C., Singh, H. and Glass, C. K.(2010). Simple combinations of lineage-determining transcription factors prime cis-regulatory elements required for macrophage and B cell identities.Mol. Cell38, 576-589.
Hill, J. T., Demarest, B. L., Bisgrove, B. W., Gorsi, B., Su, Y. C. and Yost, H. J.
(2013). MMAPPR: mutation mapping analysis pipeline for pooled RNA-seq. Genome Res.23, 687-697.
Huang, C.-J., Tu, C.-T., Hsiao, C.-D., Hsieh, F.-J. and Tsai, H.-J.(2003). Germ-line transmission of a myocardium-specific GFP transgene reveals critical regulatory elements in the cardiac myosin light chain 2 promoter of zebrafish.Dev. Dyn.228, 30-40.
Jensen, B., Wang, T., Christoffels, V. M. and Moorman, A. F. M.(2013). Evolution and development of the building plan of the vertebrate heart.Biochim. Biophys. Acta1833, 783-794.
Kasprzyk, A. (2011). BioMart: driving a paradigm change in biological data management.Database2011, bar049.
Kelsey, L., Flenniken, A. M., Qu, D., Funnell, A. P. W., Pearson, R., Zhou, Y. Q., Voronina, I., Berberovic, Z., Wood, G., Newbigging, S. et al.(2013). ENU-induced mutation in the DNA-binding domain of KLF3 reveals important roles for KLF3 in cardiovascular development and function in mice.PLoS Genet. 9, e1003612.
Kume, T., Jiang, H., Topczewska, J. M. and Hogan, B. L. M.(2001). The murine winged helix transcription factors, Foxc1 and Foxc2, are both required for cardiovascular development and somitogenesis.Genes Dev.15, 2470-2482.
Lage, K., Greenway, S. C., Rosenfeld, J. A., Wakimoto, H., Gorham, J. M., Segre, A. V., Roberts, A. E., Smoot, L. B., Pu, W. T., Pereira, A. C. et al.(2012). Genetic and environmental risk factors in congenital heart disease functionally converge in protein networks driving heart development.Proc. Natl. Acad. Sci. USA109,
14035-14040.
DEVEL
O
and dispersion for RNA-Seq data with DESeq2.Genome Biol.15, 550.
Lowdon, R. F., Zhang, B., Bilenky, M., Mauro, T., Li, D., Gascard, P., Sigaroudinia, M., Farnham, P. J., Bastian, B. C., Tlsty, T. D. et al.(2014). Regulatory network decoded from epigenomes of surface ectoderm-derived cell types.Nat. Commun.5, 5442.
Männer, J. (2009). The anatomy of cardiac looping: a step towards the understanding of the morphogenesis of several forms of congenital cardiac malformations.Clin. Anat.22, 21-35.
McCulley, D. J. and Black, B. L. (2012). Transcription factor pathways and congenital heart disease.Curr. Top. Dev. Biol.100, 253-277.
Montero, J. A., Giron, B., Arrechedera, H., Cheng, Y.-C., Scotting, P., Chimal-Monroy, J., Garcia-Porrero, J. A. and Hurle, J. M.(2002). Expression of Sox8, Sox9 and Sox10 in the developing valves and autonomic nerves of the embryonic heart.Mech. Dev.118, 199-202.
Nelander, S., Larsson, E., Kristiansson, E., Månsson, R., Nerman, O., Sigvardsson, M., Mostad, P. and Lindahl, P.(2005). Predictive screening for regulators of conserved functional gene modules (gene batteries) in mammals. BMC Genomics6, 68.
Nemer, M. and Horb, M. E.(2007). The KLF family of transcriptional regulators in cardiomyocyte proliferation and differentiation.Cell Cycle6, 117-121.
Nix, D. A., Courdy, S. J. and Boucher, K. M.(2008). Empirical methods for controlling false positives and estimating confidence in ChIP-Seq peaks.BMC Bioinformatics9, 523.
Parrie, L. E., Renfrew, E. M., Wal, A. V., Mueller, R. L. and Garrity, D. M.(2013). Zebrafish tbx5 paralogs demonstrate independent essential requirements in cardiac and pectoral fin development.Dev. Dyn.242, 485-502.
Peal, D. S., Lynch, S. N. and Milan, D. J.(2011). Patterning and development of the atrioventricular canal in zebrafish.J. Cardiovasc. Transl. Res.4, 720-726.
Pehlivan, T., Pober, B. R., Brueckner, M., Garrett, S., Slaugh, R., Van Rheeden, R., Wilson, D. B., Watson, M. S. and Hing, A. V. (1999). GATA4 haploinsufficiency in patients with interstitial deletion of chromosome region 8p23.1 and congenital heart disease.Am. J. Med. Genet.83, 201-206.
Peralta, M., González-Rosa, J. M., Marques, I. J. and Mercader, N.(2014). The epicardium in the embryonic and adult zebrafish.J. Dev. Biol.2, 101-116.
Pestel, J., Ramadass, R., Gauvrit, S., Helker, C., Herzog, W. and Stainier, D. Y. R. (2016). Real-time 3D visualization of cellular rearrangements during cardiac valve formation.Development143, 2217-2227.
duplicated genes.Nat. Rev. Genet.3, 827-837.
Ribeiro, I., Kawakami, Y., Büscher, D., Raya, A., Rodrıguez-Leó ́n, J., Morita, M., Rodrıguez Esteban, C. and Izpisú ́a Belmonte, J. C.(2007). Tbx2 and Tbx3 regulate the dynamics of cell proliferation during heart remodeling.PLoS ONE2, e398.
Robinson, M. D., McCarthy, D. J. and Smyth, G. K.(2009). edgeR: a bioconductor package for differential expression analysis of digital gene expression data. Bioinformatics26, 139-140.
Searcy, R. D., Vincent, E. B., Liberatore, C. M. and Yutzey, K. E.(1998). A GATA-dependent nkx-2.5 regulatory element activates early cardiac gene expression in transgenic mice.Development125, 4461-4470.
Singh, R., Hoogaars, W. M., Barnett, P., Grieskamp, T., Sameer Rana, M., Buermans, H., Farin, H. F., Petry, M., Heallen, T., Martin, J. F. et al.(2012). Tbx2 and Tbx3 induce atrioventricular myocardial development and endocardial cushion formation.Cell. Mol. Life Sci.69, 1377-1389.
Tanaka, M., Chen, Z., Bartunkova, S., Yamasaki, N. and Izumo, S.(1999). The cardiac homeobox gene Csx/Nkx2.5 lies genetically upstream of multiple genes essential for heart development.Development126, 1269-1280.
Targoff, K. L., Schell, T. and Yelon, D.(2008). Nkx genes regulate heart tube extension and exert differential effects on ventricular and atrial cell number.Dev. Biol.322, 314-321.
Waldron, L., Steimle, J. D., Greco, T. M., Gomez, N. C., Dorr, K. M., Kweon, J., Temple, B., Yang, X. H., Wilczewski, C. M., Davis, I. J. et al.(2016). The cardiac TBX5 interactome reveals a chromatin remodeling network essential for cardiac septation.Dev. Cell36, 262-275.
Wamstad, J. A., Alexander, J. M., Truty, R. M., Shrikumar, A., Li, F., Eilertson, K. E., Ding, H., Wylie, J. N., Pico, A. R., Capra, J. A. et al.(2012). Dynamic and coordinated epigenetic regulation of developmental transitions in the cardiac lineage.Cell151, 206-220.
Wang, B., Weidenfeld, J., Lu, M. M., Maika, S., Kuziel, W. A., Morrisey, E. E. and Tucker, P. W.(2004). Foxp1 regulates cardiac outflow tract, endocardial cushion morphogenesis and myocyte proliferation and maturation.Development 131, 4477-4487.
Wong, C. K., Vaske, C. J., Ng, S., Sanborn, J. Z., Benz, S. C., Haussler, D. and Stuart, J. M.(2013). The UCSC Interaction Browser: multidimensional data views in pathway context.Nucleic Acids Res.41, W218-W224.
Zhang, B. and Horvath, S.(2005). A general framework for weighted gene co-expression network analysis.Stat. Appl. Genet. Mol. Biol.4, 17.