ORIGINAL RESEARCH ARTICLE
ANALYSING NEO-TECTONIC EFFECTS ON GULLY DEVELOPMENT WITHIN ORLU AND ENVIRONS
SOUTH-EASTERN NIGERIA FROM LANDSAT IMAGERY AND AZIMUTHAL
SOUNDING DATA
1
Chukwuebuka Nnamdi Onwubuariri,
2Tochukwu Innocent Mgbeojedo,
3
Latifa Shaheen Al-Naimi and
4Chidiebere Charles Agoha
1
Department of Geosciences, Federal University of Technology, Owerri, Nigeria
2
Al Gazal Business Solutions W.L.L, Doha, Qatar
3
Department of Chemistry and Earth Sciences, Qatar University, Doha, Qatar
ARTICLE INFO ABSTRACT
Geophysical study was carried out in some gully erosion sites within Orlu and environs with the objectives of identifying tectonic and neo-tectonic features, delineate their trends and evaluate their effect in gully development and propagation in the study area. Detailed geological field mapping was carried out to characterize the gullies and to estimate the strikes and directional trends of the gullies. Similarly, GIS interpreted Landsat-ETM imageries were also used to determine the lineaments and their trends in the study area. Azimuthal resistivity sounding was carried out at various locations in the study area to determine the direction of electrical anisotropy as well as the coefficient of anisotropy. This was rotated in four azimuths at angles of 0°, 45°, 90°, and 135° corresponding to the N-S, NE-SW, E-W, and NW-SE directions respectively. Geological field mapping of the study area revealed that the gullies in the study area trend approximately in the NW-SE and NE-SW directions with the NE-SW being preponderant. Rose diagrams generated from the strikes and lengths of lineaments interpreted from Landsat images revealed two structural trends of NW-SE and NE-SW with the NW-SE being dominant. Results of the azimuths frequency diagrams generated from the anisotropic soundings revealed uni-modal to poly-modal pattern with the dominant trend observed to be in the NW-SE and NE-SW directions. The correlation of the trends of the gullies with the lineament trends from Landsat and the direction of electrical anisotropy suggests that the gully origin and propagation in the study area may be tectonically controlled
Copyright © 2018,Chukwuebuka Nnamdi Onwubuariri et al. This is an open access article distributed under the Creative Commons Attribution License, which permits unrestricted use, distribution, and reproduction in any medium, provided the original work is properly cited.
INTRODUCTION
Erosion is the process by which soil and rock are removed from the Earth's surface by exogenic processes such as wind or water flow, and then transported and deposited in other locations. While erosion is a natural process, human activities have increased erosion rate occurrence globally by 10-40 times the normal rate. Excessive erosion causes problems such as desertification, decrease in agricultural productivity due to land degradation, sedimentation of waterways, and ecological collapse due to loss of the nutrient rich upper soil layers.
Water and wind erosion are now the two primary causes of land degradation; combined, they are responsible for about 84% of degraded acreage, making excessive erosion one of the most significant global environmental problems. Erosion gullies in South-eastern Nigeria have been variously attributed to high rainfall intensity, wind action, slope instability, poor engineering and agricultural processes by earlier scholars. While human activities and programs tend to accelerate erosion processes, it seems that some endogenic geological factors make some parts of South-eastern Nigeria more erosion prone than other areas. Gullies in Orlu and environs within the South-eastern Nigeria have peculiar and very interesting origin and characteristics. Their genesis was rather spontaneous. A major failure suddenly occurred around the area a few years
ISSN: 2230-9926
International Journal of Development Research
Vol. 08, Issue, 06, pp.21038-21045, June, 2018
Article History:
Received 17th March, 2018 Received in revised form 26th April, 2018
Accepted 24th May, 2018
Published online 30th June, 2018
Available online at http://www.journalijdr.com
Key Words:
Azimuthal resistivity sounding, Lineaments, Landsatimagery, Gully erosion, Structural trends, Rose diagram.
Citation: Chukwuebuka Nnamdi Onwubuariri, Tochukwu Innocent Mgbeojedo, Latifa Shaheen Al-Naimi and Chidiebere Charles Agoha. 2018.
“Analysing neo-tectonic effects on gully development within orlu and environs south-eastern nigeria from landsat imagery and azimuthal sounding data”,
international Journal of Development Research, 8, (06), 21038-21045.
ago along a linear zone following a heavy rainfall. Slumping and land sliding followed. This incident which has degraded the landform in the vicinity and caused great panic in neighborhood, has attracted the attention of geologists/earth scientists and various levels of government in Nigeria. There is a speculation that this sudden failure cannot be a chance occurrence. There must have been a pre-existing condition hitherto undetected which acted as a trigger for the spontaneous event that opened the gullies. The first suspicion is the existence of a major fracture in the area whose extent may not be readily known.
Geological setting
The sediments in the study area belong to the Coastal Plain sands (Benin Formation) and some parts of the Ogwashi /Asaba Formation. From figure 1 below, it is observed that all the gullies within the South-eastern region lie along a straight line predominantly in the NW-SE direction, suggesting structural weakness along the direction may be because of early tectonism. The opening of the South Atlantic Ocean initiated tectonism in the region of Southern Nigeria and led to the development of the Benue Trough (Wright, 1966; Nyong, 1995). The development of the Benue Trough provided the main structural control and framework for subsequent geologic evolution of South-eastern Nigeria. Three major tectonic cycles could be identified in South-eastern Nigeria(Murat, 1972),the first major tectonic phase (Aptian
directly followedand was related tothe initial rifting of the Southern Nigeria continental margin and the opening of the Benue Trough.
Figure 1. Map showing gullies within the South
This phase produced two principal sets of faults, trending NE SW and NW-SE. The NE-SW set of faults bound the Benue Trough; while the NW-SE sets defined the Calabar Flank. The second tectonic phase (Turonian -Santonian) was characterized by compressional movements resulting in the folding of the Abakaliki Anticlinorium and the complementary Afikpo Syncline. The third phase (Late Campanian
involved rapid subsidence and uplift in alternation, with subsequent progradation of the Niger delta. The
basin of Southern Nigeria originated in Early Cretaceous time as an X-shaped depression, oriented NE-SW and NW
eastern
ago along a linear zone following a heavy rainfall. Slumping and land sliding followed. This incident which has degraded the landform in the vicinity and caused great panic in the neighborhood, has attracted the attention of geologists/earth scientists and various levels of government in Nigeria. There is a speculation that this sudden failure cannot be a chance existing condition undetected which acted as a trigger for the spontaneous event that opened the gullies. The first suspicion is the existence of a major fracture in the area whose extent
to the Coastal Plain sands (Benin Formation) and some parts of the Ogwashi From figure 1 below, it is observed that all eastern region lie along a straight SE direction, suggesting a structural weakness along the direction may be because of early tectonism. The opening of the South Atlantic Ocean initiated tectonism in the region of Southern Nigeria and led to the development of the Benue Trough (Wright, 1966; Nyong, lopment of the Benue Trough provided the main structural control and framework for subsequent geologic eastern Nigeria. Three major tectonic eastern Nigeria(Murat, (Aptian-early Santonian) directly followedand was related tothe initial rifting of the Southern Nigeria continental margin and the opening of the
Map showing gullies within the South-Eastern Zone
This phase produced two principal sets of faults, trending NE-SW set of faults bound the Benue SE sets defined the Calabar Flank. The Santonian) was characterized ovements resulting in the folding of the Abakaliki Anticlinorium and the complementary Afikpo Syncline. The third phase (Late Campanian-Middle Eocene) involved rapid subsidence and uplift in alternation, with subsequent progradation of the Niger delta. The sedimentary basin of Southern Nigeria originated in Early Cretaceous time SW and NW-SE and
defined by a set of mega-tectonic elements, among which is the Benin Flank to the northwest, the Benue Trough to the north and the Calabar Flank to the east (Agagu, 1979). The depression was said to be formed in the Basement complex of the African shield. The form of this depression and the rather straight course of long reaches of the Niger and Benue Rivers have led to the speculation that the depression is fault controlled(Short &Stauble, 1967). The depression is genetically related to the Benue Valley; a trough which originated as a d rift structure(Cratchley& Jones, 1965). Structural movements in this trough began in the Coni time and accumulated in the Santonian. There are three main depositional and tectonic cycles in the southern end of the Benue Trough. The first cycle (Albian
confined in the southern end of the Benue Trough. The second (Campanian-Eocene) filled the Anambra Basin and Afikpo syncline, and the third cycle paved the way for the development of the modern Niger Delta(Mammah&Ekine, 1989; Short &Stauble, 1967). Each cycle was terminated by folding and uplift. There have been continued basemen movements, sedimentation and minor faulting along earlier lines of weakness. The Ogwashi/Asaba and Benin Formations represent the Miocene to Recent sediments of the depositional cycle of the Benue Trough, and these gave rise to the modern Niger Delta. The lithostratigraphy of the Benin and Ogwashi/Asaba Formations has been documented by various scholars (Reyment, 1965; Short &Stauble, 1967; Kogbe, 1976; Asseez, 1979). The sediments of the Benin Formation are lenticular, unconsolidated, friable and sandy.
clays occur occasionally at deeper levels. The Ogwashi/Asaba Formation is predominantly sandy. The sands alternate with lignite seams and few beds of clay
MATERIALS AND METHODS
The field work was initiated with a reconnai
the area. Observation of the geographical features, exposed sand units along gullies, streams, valleys, erosional surfaces and outcrops were made and features noted. The reconnaissance survey involved multiple stops at the individual gully sites, observations, visual analysis of outcrops and lateral measurements done at intervals of 10m (except gullies with less than 20m length) using measuring tape and leveling staff, for length, width and depths measurements. Azimuthal resistivity soundings were carried out at the chosen sites of study with the coordinates of the site being recorded using geographic position system (GPS). For each gully, the measured cross-sectional areas were calculated. Azimuthal resistivity sounding was carried out alon
W, NE-SW, NW-SE to ascertain the direction of structural weakness and fracture zones.
area was also provided to ascertain the lineaments and lineament cross points within the areas of study. Landsat 5 ETM data of the study area was digitally processed and enhanced to produce single band images, band ratios, colour composites, and classified images complemented by digitized geologic maps for the study area. Drainage patterns and textures, bare rocks and vegeta
single band images. SRTM (shuttle radar topographic mission) data was utilized in the production of a digital elevation model (DEM) which is valuable in the identification of sandstone ridges. The colour composites were used as b
for both supervised and unsupervised image classification.
eastern Nigeria from landsat imagery and azimuthal sounding data
tectonic elements, among which is the Benin Flank to the northwest, the Benue Trough to the d the Calabar Flank to the east (Agagu, 1979). The depression was said to be formed in the Basement complex of the African shield. The form of this depression and the rather straight course of long reaches of the Niger and Benue Rivers ulation that the depression is fault controlled(Short &Stauble, 1967). The depression is genetically related to the Benue Valley; a trough which rift structure(Cratchley& Jones, 1965). Structural movements in this trough began in the Coniacian time and accumulated in the Santonian. There are three main depositional and tectonic cycles in the southern end of the Benue Trough. The first cycle (Albian - Santonian) was confined in the southern end of the Benue Trough. The second ene) filled the Anambra Basin and Afikpo syncline, and the third cycle paved the way for the development of the modern Niger Delta(Mammah&Ekine, 1989; Short &Stauble, 1967). Each cycle was terminated by folding and uplift. There have been continued basement movements, sedimentation and minor faulting along earlier lines of weakness. The Ogwashi/Asaba and Benin Formations represent the Miocene to Recent sediments of the depositional cycle of the Benue Trough, and these gave rise to the modern e lithostratigraphy of the Benin and Ogwashi/Asaba Formations has been documented by various scholars (Reyment, 1965; Short &Stauble, 1967; Kogbe, 1976; Asseez, 1979). The sediments of the Benin Formation are lenticular, unconsolidated, friable and sandy. Clays and sandy clays occur occasionally at deeper levels. The Ogwashi/Asaba Formation is predominantly sandy. The sands alternate with lignite seams and few beds of clay (Reyment, 1965).
MATERIALS AND METHODS
The field work was initiated with a reconnaissance survey of the area. Observation of the geographical features, exposed sand units along gullies, streams, valleys, erosional surfaces and outcrops were made and features noted. The reconnaissance survey involved multiple stops at the sites, observations, visual analysis of outcrops and lateral measurements done at intervals of 10m (except gullies with less than 20m length) using measuring tape and leveling staff, for length, width and depths measurements. gs were carried out at the chosen sites of study with the coordinates of the site being recorded using geographic position system (GPS). For each gully, the sectional areas were calculated. Azimuthal resistivity sounding was carried out along directions N-S,
RESULTS
The gullies at the sites were characterized in terms of the following basic features of gully erosion, which include the length, width, side slopes and gully floor.
The Landsat 5- ETM data obtained was subjected to various image enhancement and transformation routines. For the image transformation, band ratios were generated using the calculator module in IDRISI 32. The ratios generated (3/4, 4/2, 3/1, 5/4) were employed to reduce the effects of shadowing as well as to enhance the detection of certain features. For image enhancement, three band (RGB) colour composites were created using the composite module of IDRISI 32. This process was employed to enhance the spectral quality o images. Generated composites include RGB 357, RGB 751, RGB 752 and NDVI composite. The ratios generated were studied in detail and information extracted along with those obtained from the digital elevation model were attributed to colour patterns observed from the colour composites.
DISCUSSION
A Digital Elevation Model (figure2) was created in IDRISI 32 by performing a colour shaded operation on Shuttle Radar Topographic Mission (SRTM) data.
Figure 2. Digital Elevation Model (DEM) Map
The DEM was converted into a contour map using the ERDAS and ArcView software. From the DEM, geomorphic units in
Table
Locations Name Location 1 Njaba River Location 2 Orlu/Ihiala Road Location 3 Okwelle/Urualla Road Location 4 AforUkwu-AforNta Location 5 Okwelle/Urualla Road 2 Location 6 Owerri/Orlu Road Location 7 UmungumaIhioma Location 8 Ikpa/Ihioma Location 9 UmuazzalaOgberuru Location 10 Umueshi 1 Location 11 Umueshi 2 Location 12 Ogberuru 2
21040 International Journal of Development Research, Vol. 08, Issue, 06, pp.
The gullies at the sites were characterized in terms of the following basic features of gully erosion, which include the
ETM data obtained was subjected to various image enhancement and transformation routines. For the image transformation, band ratios were generated using the calculator module in IDRISI 32. The ratios generated (3/4, 4/2, 3/1, 5/4) ce the effects of shadowing as well as to enhance the detection of certain features. For image enhancement, three band (RGB) colour composites were created using the composite module of IDRISI 32. This process was employed to enhance the spectral quality of the images. Generated composites include RGB 357, RGB 751, RGB 752 and NDVI composite. The ratios generated were studied in detail and information extracted along with those obtained from the digital elevation model were attributed to
erved from the colour composites.
A Digital Elevation Model (figure2) was created in IDRISI 32 by performing a colour shaded operation on Shuttle Radar
Digital Elevation Model (DEM) Map
The DEM was converted into a contour map using the ERDAS From the DEM, geomorphic units in
the study area were identified. Based on the image texture and tone, three geomorphic units: part of Orlu and Environs, scarp slope and low-lying plain were identified. The highest elevations represented as green patches, is interpreted as a sandstone ridge.
This feature seen towards the top right corner of the map is suspected to be part of the Awka
SW direction. The scarp slope of the ridge is identified where light green, yellow and red colours are closely packed together; representing a sudden change in topography from 286 to 116 metres. The slope is characterized by numerous streams, gullies and a river. It will be correct to interpret the topographic high areas as characterizedbysandstone. This is justified by the dendritic drainage pattern expressed in the low lying area. Geologically, the area with dendritic pattern corresponds to the Benin Formati
represents the watershed for the study area. Similarly, the elevation contour map (figure 3) reveals the highest elevation of the study area as green contours which correlate to the green patches on the DEM map.
The DEM was converted into a contour map using the ERDAS and ArcView software.
Figure 3. Topographical map of Orlu and Environs
The low-lying plain of the study area is shown as blue on the DEM and the contour map. The slope of the ridge is similar to the interpreted one on the DEM imagery.
Table 1. Site locations with their Easting and Northing
Longitude Latitude Elevation 7.193056 5.774767 115m 7.060278 5.878056 102m Okwelle/Urualla Road 7.312500 5.886667 152m
AforNta 7.360556 5.861944 155m
Okwelle/Urualla Road 2 7.322222 5.810833 137m 7.253889 5.761111 107m 7.263889 5.927222 110m 7.142778 5.960000 94m UmuazzalaOgberuru 7.028722 5.830389 195m
7.110472 5.829000 260m 7.109669 5.830806 273m 7.015389 5.832028 121m
International Journal of Development Research, Vol. 08, Issue, 06, pp.21038-21045, June, 2018
the study area were identified. Based on the image texture and tone, three geomorphic units: part of Orlu and Environs, scarp ng plain were identified. The highest elevations represented as green patches, is interpreted as a
This feature seen towards the top right corner of the map is suspected to be part of the Awka-Orlu Cuesta, running in
NE-direction. The scarp slope of the ridge is identified where light green, yellow and red colours are closely packed together; representing a sudden change in topography from 286 to 116 metres. The slope is characterized by numerous ver. It will be correct to interpret the topographic high areas as characterizedbysandstone. This is justified by the dendritic drainage pattern expressed in the low-lying area. Geologically, the area with dendritic pattern corresponds to the Benin Formation. The sandstone ridge represents the watershed for the study area. Similarly, the elevation contour map (figure 3) reveals the highest elevation of the study area as green contours which correlate to the green
ed into a contour map using the ERDAS
Topographical map of Orlu and Environs
lying plain of the study area is shown as blue on the DEM and the contour map. The slope of the ridge is similar to one on the DEM imagery. Linear features equal
Gully Orientation NE-SW Dominant NE-SW Dominant NE-SW Dominant NE-SW Dominant NE-SW Dominant NE-SW Dominant NE-SW Dominant NE-SW Dominant NE-SW Dominant NE-SW Dominant NE-SW Dominant NE-SW Dominant
to or greater than 1km in length were considered. The longer lineaments have the greatest potential of being more fully developed and of penetrating greater depths. The lineaments reveal three groups of linear features. The maxima having NE SW direction, others trend in N-S,
E-directions. The Pan African Shield has been recognized as characterized by NNW-SSE to NNE-SSW trending structures and varied intrusives and the Lower Cretaceous characterized by NE-SW oriented shear zones and fractures controlled by volcanism(Umeji, 1988).Three tectonic trends have been described: the first, of Albian age gave rise to Abakaliki trough with NE-SW trending faults(Murat, 1972). interpreted lineaments (Figure 4) were superimposed on the edge enhanced map to show the relationship between geological formations and structural features.
Figure 4. Lineament on Drainage Map
The lineament density map(figure 6) and enhanced filtered map (figure 5) reveal a high-density fracture zone 5km east of Urualla, Orlu town and also NNE of Orlu town. This zone is interpreted thus, because of the high density of lineaments seen in this area. This implies that there was intense tectonic activity that affected the area and weakened the structures. Around Orlu, existence of lineament is interpreted. Finally, statistical trend analysis was applied to the interpreted structural lineaments.
Figure 5. Lineament on Edge Enhanced Band 5 Map
eastern
to or greater than 1km in length were considered. The longer lineaments have the greatest potential of being more fully developed and of penetrating greater depths. The lineaments features. The maxima having
NE--W and NW-SE directions. The Pan African Shield has been recognized as SSW trending structures and varied intrusives and the Lower Cretaceous characterized SW oriented shear zones and fractures controlled by volcanism(Umeji, 1988).Three tectonic trends have been described: the first, of Albian age gave rise to Abakaliki-Benue SW trending faults(Murat, 1972). The ure 4) were superimposed on the edge enhanced map to show the relationship between geological formations and structural features.
Lineament on Drainage Map
The lineament density map(figure 6) and enhanced filtered density fracture zone 5km east of Urualla, Orlu town and also NNE of Orlu town. This zone is interpreted thus, because of the high density of lineaments seen a. This implies that there was intense tectonic activity that affected the area and weakened the structures. Around Orlu, existence of lineament is interpreted. Finally, statistical trend analysis was applied to the interpreted
Lineament on Edge Enhanced Band 5 Map
Figure 6. Lineament Density Map
Normalized Difference Vegetation Index (NDVI) relies on the chlorophyll content of a plant. This was generated to delineate zones of vegetation and bare soil. Healthy plants have a higher value of NDVI because of their high
(band 4) light and relatively low reflectance of red (band 3) light. A closer look at the NDVI imagery (figure 7) revealed that the brown areas (-0.22 to 0.04) correspond to bare soil which is found with Orlu, Urualla, Oguta and toward the south-eastern part of Orlu. Yellow areas (
correspond to sparsely vegetated areas and green (0.19 to 0.51) correspond to thick vegetation areas.
Figure 7. Normalized Difference Vegetation Index (NDVI) eastern Nigeria from landsat imagery and azimuthal sounding data
Lineament Density Map
Normalized Difference Vegetation Index (NDVI) relies on the chlorophyll content of a plant. This was generated to delineate zones of vegetation and bare soil. Healthy plants have a higher value of NDVI because of their highreflectance of infrared light and relatively low reflectance of red (band 3) A closer look at the NDVI imagery (figure 7) revealed 0.22 to 0.04) correspond to bare soil which is found with Orlu, Urualla, Oguta and toward the u. Yellow areas (-0.04 to 0.19) correspond to sparsely vegetated areas and green (0.19 to 0.51) correspond to thick vegetation areas.
The dendritic pattern suggests that the underlying sediment is a homogenous unit. Similarly, the dendritic pattern may reveal that the lithology has least resistance to erosive action of the river and streams. Such litho-unit includes laterites, sand, coarse grain etc. This implies that the stream channels are covered with vegetation. Red patterns are prominent along the river channel. RGB752 composite (figure 8) is very descriptive, for it differentiates between the patterns. Bare soil area, interpreted as sandstone ridge from DEM are rendered as lavender and magenta, while urban areas are rendered in lavender pattern.
Figure 8. Colour Composite RGB 752 Map
The vegetated areas showed shades of green pattern in RGB 357 (figure 10) and 752 (figure 8) and brown
with no or fewer vegetation. In RGB 751 (Figure 9), shades of blue indicate vegetated areas, light brown and light yellow indicate areas with no or fewer vegetation.
Figure 9. Colour Composite RGB 751 Map
The unsupervised classification map relies on image classification tied around tonal differences of the patterns seen. In the study area, nine tonal features were observed. Looking at the image (figure 11), blue and green colours are areas with mixed vegetation, shale and mudstones. The yellow areas are
21042 International Journal of Development Research, Vol. 08, Issue, 06, pp.
pattern suggests that the underlying sediment is a homogenous unit. Similarly, the dendritic pattern may reveal that the lithology has least resistance to erosive action of the unit includes laterites, sand, This implies that the stream channels are covered with vegetation. Red patterns are prominent along the river channel. RGB752 composite (figure 8) is very descriptive, for it differentiates between the patterns. Bare soil dge from DEM are rendered as lavender and magenta, while urban areas are rendered in
Colour Composite RGB 752 Map
The vegetated areas showed shades of green pattern in RGB 357 (figure 10) and 752 (figure 8) and brown indicates areas with no or fewer vegetation. In RGB 751 (Figure 9), shades of blue indicate vegetated areas, light brown and light yellow
Colour Composite RGB 751 Map
The unsupervised classification map relies on image classification tied around tonal differences of the patterns seen. In the study area, nine tonal features were observed. Looking at the image (figure 11), blue and green colours are areas with ation, shale and mudstones. The yellow areas are
observed within Orlu, Urualla and Umueshi. This has been interpreted previously from the DEM and colour composites as sandstone units.
Figure 10. Colour Composite RGB 357 Map
Figure 11. Unsupervised
The results obtained are displayed on the rose diagrams (figure 12). The azimuth frequency diagram (rose diagram) of the determined lineaments revealed that the commonest strikes of lineaments in the study area are in E
NE-SW trends. The E-W, WNW
and deeper tectonic trends. However, the NE
SSW trend reflects the younger tectonic events, because the younger events are more pronounced and tend to obliterate the older events. Tables 2, 3 and 4 show the results of the azimuthal resistivity sounding at Ogberuru, Umueshi and Urualla respectively. At Ogberuru, it was observed that the most dominant line of weakness is in the NW
which coincided with the map in figure 1 show
gullies in southeastern Nigeria lie in a straight line along the NW–SE direction, thoughthere are other directions of weaknesses which indicate fractures because of tectonism.
International Journal of Development Research, Vol. 08, Issue, 06, pp.21038-21045, June, 2018
observed within Orlu, Urualla and Umueshi. This has been interpreted previously from the DEM and colour composites as
Colour Composite RGB 357 Map
Unsupervised Classification Map
The results obtained are displayed on the rose diagrams (figure 12). The azimuth frequency diagram (rose diagram) of the determined lineaments revealed that the commonest strikes of lineaments in the study area are in E-W, WNW-ESE, N-S and W, WNW-ESE, and N-S, reflect the old and deeper tectonic trends. However, the NE-SW and NNE-SSW trend reflects the younger tectonic events, because the younger events are more pronounced and tend to obliterate the es 2, 3 and 4 show the results of the azimuthal resistivity sounding at Ogberuru, Umueshi and At Ogberuru, it was observed that the most dominant line of weakness is in the NW–SE direction which coincided with the map in figure 1 showing that all the gullies in southeastern Nigeria lie in a straight line along the SE direction, thoughthere are other directions of weaknesses which indicate fractures because of tectonism.
Table 2.
S/N AB/2 MN/2 K N
1 10 5 23.57 105.4
2 20 5 117.8 28.31
3 30 5 274.89 15.09
Table 3.
S/N AB/2 MN/2 K
1 10 5 23.57
2 20 5 117.8
3 30 5 274.89
4 40 5 494.8
5 50 5 777.54
Table 4. Azimuthal Resistivity Sounding values at Umuomeji, Urualla
S/N AB/2 MN/2 K
1 10 5 23.57
2 20 5 117.8
3 30 5 274.89
4 40 5 494.8
5 50 5 777.54
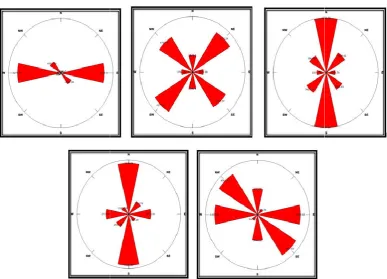
Figure13. Azimuthal sounding plots at Ogberuru at AB/2=10m, 20m and 30m eastern
Figure 12. Rose Diagram
. Azimuthal Resistivity Sounding values at Ogberuru
RESISTANCE(Ω) RESISTIVITY(
N-S E-W NE-SW NW-SE N-S E-W
105.4 135.1 110.3 116.9 2484.28 3184.31 28.31 32.52 31.96 30.46 3335.77 3831.83 15.09 17.48 16.34 15.64 4148.69 4805.78
Table 3. Azimuthal Resistivity Sounding values at Umueshi
RESISTANCE(Ω) RESISTIVITY(
N-S E-W NE-SW NW-SE N-S E-W
33.14 30.09 35.01 30.02 781.11 709.22 20.9 22.35 19.24 20.93 2438.46 2638.46 14.36 14.46 13.09 14.14 3947.42 3947.42 11.22 10.67 11.43 10.91 5551.66 5279.52 11.36 17.21 12.47 9.361 8832.85 13381.46
Azimuthal Resistivity Sounding values at Umuomeji, Urualla
RESISTANCE(Ω) RESISTIVITY(
N-S E-W NE-SW NW-SE N-S E-W
141.2 101.2 115.1 107.5 3328.08 2385.28 35.61 30.26 28.64 30.81 4194.86 3564.63 13.97 15.27 13.7 15.56 3840.2 4197.57 7.341 8.251 10.66 7.461 3632.32 4082.59 4.814 5.867 5.74 3.914 3743.08 4561.83
Azimuthal sounding plots at Ogberuru at AB/2=10m, 20m and 30m eastern Nigeria from landsat imagery and azimuthal sounding data
RESISTIVITY(Ωm)
NE-SW NW-SE 3184.31 2599.77 2755.33 3831.83 3765.85 3589.1 4805.78 4492.36 4299.91
RESISTIVITY(Ωm)
NE-SW NW-SE 825.19 707.57 2638.46 2266.47 2465.55 3947.42 3598.31 3886.94 5279.52 5655.56 5398.27 13381.46 9695.92 7278.55
Azimuthal Resistivity Sounding values at Umuomeji, Urualla
RESISTIVITY(Ωm)
W NE-SW NW-SE 2385.28 2712.91 2533.78 3564.63 3373.79 3629.42 4197.57 3765.99 4277.29 4082.59 5274.57 3691.7 4561.83 4463.08 3043.29
At Umueshi, lines of weaknesses were pronounced in E S and NW-SE directions with NW–SE line of weakness being more dominant here as it repeated at various depths, but predominantly at depths of AB/2 = 20 and AB/2 =
are some levels of agreement with the map of figure 1 showing the directions of the gullies within South-eastern Nigeria. Umuomeji, Urualla, lines of structural weaknesses were observed predominately E – W, N – S, NE –
directions respectively, with the one at NW –
[image:7.595.105.493.386.665.2]Figure14. Azimuthal sounding plots at Umueshi at AB/2=10m, 20m, 30m, 40m and 50m
Figure 15. Azimuthal sounding plots at Urualla at AB/2=10m, 20m, 30m, 40m and 50m 21044 International Journal of Development Research, Vol. 08, Issue, 06, pp.
At Umueshi, lines of weaknesses were pronounced in E-W, N-SE line of weakness being more dominant here as it repeated at various depths, but predominantly at depths of AB/2 = 20 and AB/2 = 50. There are some levels of agreement with the map of figure 1 showing eastern Nigeria. At Umuomeji, Urualla, lines of structural weaknesses were SW and NW – SE – SE direction
being the deepest line of structural weakness from the Azimuthal data collected. This coincides with the map at figure 1, showing gullies within the South
These azimuthal plots show that there is more to the gullying within Orlu and environs as has been previously attributed to soil texture, compaction and rainfall. The consistency in the structural lines of weaknesses as observed in all the azimuthal plots points to a structural deformation in the subsurface which in turns, enhances a surface expression (gully) of the
Azimuthal sounding plots at Umueshi at AB/2=10m, 20m, 30m, 40m and 50m
Azimuthal sounding plots at Urualla at AB/2=10m, 20m, 30m, 40m and 50m International Journal of Development Research, Vol. 08, Issue, 06, pp.21038-21045, June, 2018
being the deepest line of structural weakness from the data collected. This coincides with the map at figure 1, showing gullies within the South-eastern Nigeria. These azimuthal plots show that there is more to the gullying within Orlu and environs as has been previously attributed to n and rainfall. The consistency in the structural lines of weaknesses as observed in all the azimuthal plots points to a structural deformation in the subsurface which in turns, enhances a surface expression (gully) of the
Azimuthal sounding plots at Umueshi at AB/2=10m, 20m, 30m, 40m and 50m
weaknesses underneath when exposed to agents of erosion, soil texture and compaction also beingunneglectable factors.
Conclusion
Landsat -TM data was processed in order to enhance trends and enable the calculation of locations and depths. This aided in identifying lineaments and classifying them based on their spatial and directional attributes. Drainage pattern, termination of drainage line on linear trends and straight stream segments were some of the basic hypothetical models used to map fractures. Lineaments are defined as a mappable, simple or composite linear feature of a surface whose parts are aligned in a rectilinear or slightly curvilinear relationship and which differ from the pattern of adjacent features and presumably reflects some subsurface phenomenon(O'Leary et al., 1976). The inferred structural trends from the Rose diagram are in the orientations: NE-SW, E-W and N-S. The NE-SW trend is the dominant orientation from the Rose diagram. The NE-SW trending Abakaliki-Benue trough is thought to be the result of a pre-Albian rifting of the African shield prior to the opening of the South Atlantic(Uzuakpunwa, 1974). Linear structures running NE-SW observed from the study are inferred as the continental extension of the known pre-Cretaceous oceanic fracture zones, Charcot and Chain fracture zones (Ananaba, 1991; Burke et al., 1971; Burke et al., 1972), which run along the trough axis beneath the sedimentary cover. Thisresearch is in consonance with some other previous studies that suggested that Nigeria has a complexity connectivity of fractures and lineaments with dominant trends of NW-SE, NESW, N-S and E-W directions (Chukuwu-Ike and Norman, 1997; Ananaba and Ajakaiye, 1987; Onyedim, 1996; Udoh, 1988).
The azimuths of the major axes of the anisotropy diagrams correlate significantly with the strikes of the geological formations. The coefficient of anisotropy obtained from the survey varies from 1.30 to1.70, indicating that structural
inhomogeneities exist. The evidence from available
geophysical data indicate that the strike of the gully which is oriented in the NW-SE direction. This would suggest a juxtaposition of sediments of different degrees of saturation and resistance to shear and probably separated by a fractured region which may be a fault. The Early Cretaceous tectonic movement in the sedimentary basin of South-eastern Nigeria guided a major marine transgression across the continent and later determined the course of the Niger and Benue Rivers and probably had tremendous influence on gulling and erosion (Hospers, 1965).Consistent NW-SE orientation of maximum axes of electrical anisotropy and the form of the gully and its orientation which coincides with the regional geologic trend, narrow down wide range of other possible causes and have led to the speculation that the gully is structurally controlled and may indeed be running along the geologic contact between the Benin Formation and the Ogwashi/Asaba Formation.
REFERENCES
Agagu, O.K. 1979. Potential geo-pressured geothermal
reservoirs in the Niger Delta Subsurface. Nig. Journal of
Science. 13(1& 2): 201-215
Ananaba, S.E., 1991. Dam sites and crustal mega-lineaments in Nigeria. ITC Journal.1:26-29.
Ananaba, S.E., Ajakaiye, D.E. 1987. Evidence of tectonic control of mineralization of Nigeria from lineament
density analysis:a Landsat study. International Journal of
Remote Sensing. 1(10):1445-1453.
Asseez, LO. 1979. A review of the sedimentary geology of the Niger Delta. InKogbe CA (ed)Geology of Nigeria. Elizabethan press, pp 175-187.
Burke, K.G., Dessauvagie, T.F.J., Whiteman, A.J. 1971. Opening of the Gulf of Guinea and Geological History of the Benue Depression and Niger Delta. Nature (Physical.Science). 233:51-55.
Burke, K.G., Dessauvagie, T.F.J., Whiteman, A.J. 1972. Geological History of the Benue Valley and Adjacent Areas. InBurke KG etal (eds). African Geology Geol Dept., Univ. of Ibadan, Nigeria, pp188-205.
Chukwu-Ike, I.M., Norman, J.W. 1997. Mineralized crustal fractures shown on satellite imagery of Nigeria Inst. of
Min. and metatransactions. 86:55-67.
Cratchley, C.R., Jones, G.P. 1965. An Interpretation of the Geology and Gravity anomalies of the Benue Valley, Nigeria. Geophs. Pap. Overseas geol. Surv. London, Paper No 1.
Hospers, J. 1965. Gravity field and structure of the Niger
Delta, Nigeria. InKogbe CA (ed) Geology of
Nigeria.Elizabethan Press, pp 273-282.
Kogbe, G.A. 1976. The Cretaceous and Paleogene sediments of Southern Nigeria. InKogbe CA (ed)Geology of Nigeria.Elizabethan press, pp 273-282.
Mammah, L.I., Ekine, A.S. 1989. Electrical resistivity Anisotropy and tectonism in Basal Nsukka Formation.
Journal of Mining and Geology.25:121-129.
Murat, R.C. 1972. Stratigraphy and paleogeography of Cretaceous and Lower Tertiary in Southern Nigeria. InDessauvagie and Whiteman (eds)Africa Geology.Ibadan University, pp 256-266.
Nyong, E.E. 1995. Cretaceous Sediments in the Calabar Flank.
InGeological Excursion Guidebook. Published in
commemoration of the 31st Annual Conference of the Nigerian Mining and Geosciences Society
O’Leary, D.W., Friedman, J.D., Phn, H.A. 1976. Lineament, Linear, Lineation: Some proposed new standard for old
terms. Geol. Soc. Amer. Bull.87:1463-1469.
Onyedim, G.C. 1996. An investigation of structural and lithologic controls of drainage patterns in parts of Ilesha
area using remote sensing data. Journal of Mining and
Geology.32(1):53-58.
Reyment, R.A. 1965. Aspects of the geology of Nigeria. University of Ibadan Press, Ibadan Nigeria, pp 145. Short, K.C., Stauble, A.J. 1967. Outline geology of Niger
Delta. AAPG Bulletin.51:761-771.
Udoh, A.N. 1988. Remote sensing imageries of Nigeria, north of 70401. InOluyide etal. (eds)Precambrian Geology of Nigeria.Geological Survey of Nigeria Publ, pp 99-102. Umeji, A.C. 1988. The Precambrian of part of the SE Nigeria:
A magmatic and Tectonic study. InOluyide et al. (eds) Precambrian Geology of Nigeria. Geological Survey of Nigeria Publ, pp 69-75.
Uzuakpunwa, A.B. 1974. The Abakalikipyroclastics-eastern Nigeria: New age and tectonic implications.Geological MagazineIII.65-70.
Wright, J.B. 1966. South Atlantic Continental Drift and the Benue Trough. Tectonophysics.6:301-310.
eastern Nigeria from landsat imagery and azimuthal sounding data