8194
EVALUATION FRAMEWORK OF M-GOVERNMENT
SERVICES SUCCESS IN MALAYSIA
NOOR DHEYAA AZEEZ1, MUHAMMAD MODI LAKULU2
1 Department of Computing, Universiti Pendidikan Sultan Idris, Malaysia 2 Department of Computing, Universiti Pendidikan Sultan Idris, Malaysia
[email protected] [email protected]
ABSTRACT
Technological amplification has expended the involvement of information and communication technology in public sectors and has increased governmental dependence on information systems bringing the management attention towards improving the success of m-government services. Based on the analytical literature review, it was found that most of the m-government evaluation models address the m-service dimensions that assess the quality of m-government platforms.
This gives a very constrict perspective to m-government and ignores the key dimensions. Hence, it becomes important to understand how citizens perceive m-government services. This involves defining what m-government service is, identifying its underlying dimensions, and determining how it can be measured. Therefore, periodical evaluation on the success of m-government services becomes essential. Foregoing discussion clearly indicates the necessity of developing a comprehensive m-government service success evaluation framework which not only evaluates the m-government service success but also evaluates the m-government service quality criteria and the citizens’ perception in the form of citizens’ trust in m-services offered. Thus, the objective of this study is to develop a framework called "m-government service success evaluation framework" (M-GSEF) that evaluates m-"m-government service success from the citizen’s perspective.
The Fuzzy Delphi method based on expert opinions was used to evaluate the proposed framework to determine whether all important dimensions and measurement items included in the proposed framework (M-GSEF) were in the right research context or not. Ten sub-factors were excluded after the implementation of the Fuzzy Delphi analysis because they did not meet the requirements. As a result, final framework was obtained in evaluating the success of Malaysian mobile government services
Keywords: M-Government, Success, Evaluation Framework, Fuzzy Delphi.
1. INTRODUCTION
The mobile government is an important issue concerning citizens because it is able to make citizens' life easy [1], [2], [3], and [4]. Through mobile government, citizens can access government services through mobile devices instead of traditional methods that demands a lot of effort and time [5], [6], [7].
M-government has received increasing attention over the last few years. In spite of current developments, many avenues of m-government remain unexplored. In some countries, governments have achieved the desired level of satisfaction in offering m-services to their citizens although at the same time some of the countries are still behind from the required level. Hence great necessity arises to measure the government initiatives in the form of success assessment [8], [9], [10],[11].
This is consistent with [12] and [13]: “measurement of mobile service’s success forms the basis of an improvement process”. Effective measures will eventually result in higher quality products delivered to customers [2], [14], [15]. M-government, like any other new IT application [16] and [17], has been researched since its emergence. However, its short research history means that some crucial issues such as m-government success have yet to be fully investigated from different perspectives, despite a significant number of papers being published in this area.
8195 evaluation criteria. Values of the criteria are ambiguous and the assessment is unclear. Moreover, [22] and [23] argued that the process of evaluating mobile government is difficult in organizations that provide services through mobile infrastructure because of the restrictions in the mobile environment and the unclear impact on organizations.
Literature review indicates that there is a lack in effective measures to evaluate the success of m-government services [24], [22]. The recent available approaches in monitoring, evaluating, and benchmarking m-government development do not carry comprehensive m-government assessment. This have to be further improved in order to give policymakers better evaluation criteria for their decisions [25].In addition [24] argued that there is still a lack of comprehensive frameworks to establish the complex mechanisms on how to measure the mobile government services success.
This is consistent with his reference [26] the need for an integrated and verified mobile government evaluation framework. This finding highlights the gap and the need for a comprehensive framework to evaluate the success of mobile government. The important dimensions in the success of mobile government must be defined and redefined to build the framework for evaluation.
Likewise, in the context of m-government success, [19], [18] commented that, “the evaluation of m-government in both theory and practice has proven to be important and complex”. They reasoned the complexity of measuring the success to: “the multiple perspectives involved, the difficulties of quantifying benefits, and the social and technical context of use”. Also, [24] stated that “m-government is not a simple matter”. However, continuous evaluation is needed because it will lead to an enhanced m-government system [27].
Furthermore, [18] and [27] argued that user satisfaction is always used as a tool to measure the success of a mobile government; thus, the
impact of users' expectations should be taken into consideration when conducting an assessment. Moreover, evaluation tools must include all aspects of user satisfaction. In addition to trust in the m-government services and reliability of the service, delivery medium is also a key element for the citizens‟ decision in utilizing mobile government service transactions [28], [29], [30], [31].
Apart from the above problems, existing studies in e-government are conducted in developed countries without verifying their applicability to developing countries [12]. Existing models might not be applicable for other countries such as Malaysia due to the difference in implementation requirements and context. Therefore, there is a need to develop a framework that can evaluate the success of m-government services and citizen’s trust for countries like Malaysia. So this study attempts to answer the following three questions, a. What are the important dimensions and factors in evaluating the m-government services success based on citizen’s perspective, b. How to develop the framework for evaluating the success of m-government in Malaysia? c. Is the proposed framework suitable for Malaysian environment? The current study has several contributions to the existing literature. First, integrate the existing studies on m-government within the context of service evaluation according to the citizen’s view. Second, adopting the DeLone and McLean (2003) for IS success in evaluating M-Government depending on citizen’s perspective. By applying our proposed evaluation framework, this study can add to the knowledge required for the evaluation of M-Government. In turn, we present a tool to help the government in providing citizen centric government services based on M-Government.
8196
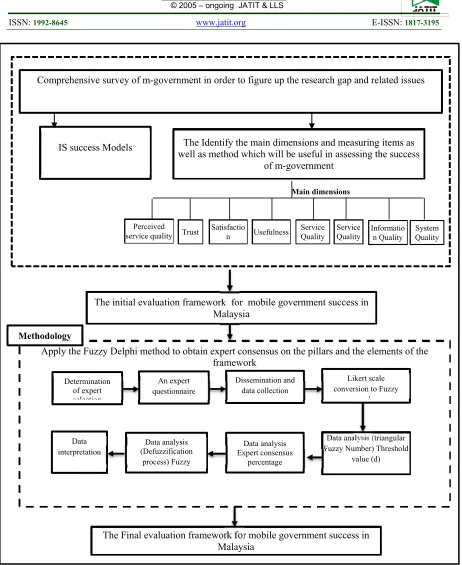
Figure (1): Stage of proposing the new framework for evaluation of mobile government success in Malaysia
2. COMPREHENSIVE SURVEY
Detailed literature review of this study is discussed in the following sections. The protocol of systematic review for m-government describes all the steps and procedures required.
2.1. Systematic Review Protocol
This section presents the protocol of systematic review used in this study. The method of systematic review, sources of information, selection of study, searching, inclusion and exclusion criteria, data Comprehensive survey of m-government in order to figure up the research gap and related issues
The Identify the main dimensions and measuring items as well as method which will be useful in assessing the success
of m-government
Apply the Fuzzy Delphi method to obtain expert consensus on the pillars and the elements of the framework
Determination of expert selection
An expert questionnaire
Dissemination and data collection
Likert scale conversion to Fuzzy
l
Data analysis (triangular Fuzzy Number) Threshold
value (d) Data analysis
Expert consensus percentage Data analysis
(Defuzzification process) Fuzzy
The Final evaluation framework for mobile government success in Malaysia
Data interpretation
The initial evaluation framework for mobile government success in Malaysia
IS success Models
System Quality Informatio
n Quality Service
Quality
Service Quality
Usefulness Satisfactio
n Trust Perceived service quality
Main dimensions
[image:3.612.82.544.56.621.2]8197 collecting and literature taxonomy are described in the following sections.
2.1.1. Methods
This section describes the procedures that followed in searching, collecting articles, as well as the filtering and reading processes. Methodological research was conducted by utilizing three indexes, namely, ScienceDirect, Web of Science (WOS), and IEEE Xplore digital library. The procedures for selecting this study include intensive research on publications related to the survey, which relied on two repetitions. The first stage started by verifying the title of articles and their abstracts. Non-relevant articles and those that were repeated in the databases were excluded. The second stage involved reading the full texts of articles obtained from the first stage. The search query on SD, WOS, and IEEE databases was run over the search box of each database on May 3, 2018. Search procedures were implemented in all approved databases by entering the conditions as a search string, such as "M-government" or "mgovernment" "OR "Mgov" OR "M-gov" OR "Mobile government" OR "Mobile-government”.
After eliminating duplicate research papers, all research papers focusing on evaluating or assessment of the m-government apps or services are included, in the other side, the criteria adopted for excluding the papers are as follows: (1) non-English articles; (2) Articles not focusing on m-government evaluation. The preliminary results of the study included 638 articles, 130 of which come from ScienceDirect index, 316 from IEEEXplore index, and 130 from WOS index. These articles were published over a 11-year period from 2007 to 2018. Thirty-nine of the articles had duplicates. A total of 404 non-related articles were eliminated in title and abstract scanning, which resulted in 599 articles. Fifty-three articles were removed after completing the full text of the research articles. The final result consists of 16 articles that were extensively examined to map the research area.
The preliminary results of the study include 638 articles, 130 of which come from ScienceDirect index, 316 from IEEEXplore index, and 130 from WOS index. These articles were published over a 11-year period from 2007 to 2018. Thirty-nine of the articles had duplicates. A total of 520 non-related m-government's evaluation was eliminated in title and abstract scanning, which resulted in 79 articles.
Also, 63 articles were removed after completing the full text of the research articles. The final result
consists of 16 articles that were extensively examined and analyzed in order to determine the research gap and issues related to evaluation of m-government. Next section covers the analysis all those 16 articles in order to understand the existing approaches and method for evaluating m-government and gain wide view that enable us to identify the research gaps and issues related to m-government.
2.2. Critical Review And Analysis
This section includes the detailed analysis of the (16) final set of articles that focused on m-government which we gathered through comprehensive systematic research.
Evaluation on the success of mobile government is still under development and the process is yet to mature. This argument is supported by [32], [33] stating the authors concluded that the evaluation of the mobile government is under development. Furthermore, [26] emphasizes the importance to better understand the factors measuring the success of a mobile government: "For web-based applications to be effective in a mobile government environment, there is a need to better develop and understand factors that measure the success of mobile government." By reviewing mobile government literature, there seems to be no comprehensive model for mobile government success because most of the previous work only focused on one or two aspects of mobile government success. Therefore, that important gap was addressed in this study by proposing a theoretical framework supported by theories and models of success in information systems. The evaluation on the success of the mobile government was based on accessibility only by the researchers [34] and [23]. And this is consistent with reference [35] that considers accessibility as an important element for the success of a mobile government. And these studies did not address other important aspects of success, for example the quality of information and quality of service.
8198 system and satisfaction with information. Mainly, [18] study focused on assessing user satisfaction according to the SERQUAL and Kano models which focus on different aspects of activity. Ease or comfort of friendliness. Reliability and responsiveness. These studies did not address the aspects of user satisfaction with the quality of services provided, as referred by [26]. This is consistent with [67, 77] that the success of mobile government services depends on the rates of use and satisfaction of citizens in general, in terms of system, information and value. Two studies [6] and [36] examined the factors influencing the effectiveness of mobile government services. Thus, [6] study attempted to conduct probes and understand the views from end-users on a government service provided via mobile technology. The study confirmed the need to disclose recent facts of privacy and security to end users, in order to gain their trust in any government service provided. This result is consistent with [86, 96]. If users do not have confidence in mobile government services, they will have difficulty believing that the service is successful. Hence, [77, 98] trust played a major and important role in the success of the mobile government. While [36] study the evaluation of mobile government experts and mobile technology focused only on the government side as organizational and strategic aspects, but the study did not address the user’s aspects. This is consistent with what they have observed as [68, 71] mentioned the importance of assessing mobile government with the user to understand their needs so that the government is able to determine the dimension they need to focus their efforts on, which leads to user satisfaction. This finding is consistent with [57, 62] regarding the need to evaluate mobile government services from the user’s point of view.
The study [37] focused on the quality of the system solely through usability and user acceptance factors. Similarly [26] , [22] and [38] also focused on ease of use to enhance mobile government. We note that these studies focused on a small segment of the success in mobile government. However, [39] and [40] indicated that the acceptance and use of mobile government services did not necessarily translate into success.
These studies did not assess other factors, for example, the quality of information in the mobile environment. It was observed [2, 9] there is a set of determinants in providing information and services in a mobile environment that leads to the failure of mobile government service.
For instance [21] this study relating to the performance assessment of mobile government relied on multiple criteria in evaluating through focusing on the degree of balance with decision-making. But this study relied on factors in general and did not focus on aspects of interest to the user. This is indicated by [27, 38] the importance of focusing on aspects of user interest.
The two studies [20] and [24] attempt to set the standards for mobile service quality, whereby [24] defined quality standards from a quality perspective but did not address the impact of users' expectations when conducting an evaluation, and this is confirmed by [18, 27].
Additionally, [20] study use of e-government literature that has been utilized to evaluate mobile government services. It has been noted that reliance on e-service models in the mobile context makes assessment becomes difficult because mobile services have their own characteristics and this is what being referred to [24]. In overall, [41] and [42] studies examined the assessment on the quality of information in the mobile environment, but did not take into account the possibility of access and evaluation in quality of service. Besides [12] this study focused on the classification of services according to the level of service development itself in terms of activity and interaction, but did not address the influence factors that lead to its success.
Based on the previous discussion of the studies, it was found that despite previous attempts by researchers to evaluate the mobile government, each study sought to assess only one of the factors leading to success. So our study came to fill this gap by providing a comprehensive framework for evaluating the success of mobile government services from the citizen’s point of view. This is consistent with both references [22, 25] in terms of the need to understand the dimensions of factors and their interdependence affecting the success of the mobile government. This is consistent with the need for an integrated mobile government assessment framework. [27, 38] addressed the importance of mobile government assessment by the user to identify their needs to enable the government to determine the dimension they need to focus their efforts on, leading to user satisfaction.
8199 one of the most important factors affecting the success of mobile government services. This is confirmed by [43] [44] [45]. Perceived effectiveness dimension and perceived M-Government service quality dimension in the present study are considered as an overall m-government service quality [46], [47], [48] to reach a comprehensive framework for assessing success from the citizen’s point of view.
2.3. M-Government
The term "mobile" in mobile government refers to two basic elements: the first is the mobility of the individual and the second is the movement of technology, such as mobile and handled wireless devices. In order to distinguish these two terms, each term should be determined and the type of relationship between these two terms (if any) should be identified. E-Government refers to the government's use of information technology to share information and services with citizens, corporations and other arms of government [49]. The E-Government involves various types of ICTs to improve government efficiency in various ways and to provide citizens and stakeholders, such as the private sector, with better service [50] .
While the mobile government is defined as the use of mobile devices by the government to provide services and information to citizens [18, 51]. In [52] [53] it was noted that mobile devices are essential in most people's lives these days. This is confirmed by [54] mentioning that mobile phones have become an important tool for business management in addition to its main task in making calls. This is what governments have realized, so they have opted to start using mobile devices to provide their services to citizens [55]. Thus, the relationship between these two terms can be clarified: the mobile government is a revolution for the next step in government work procedure after the introduction of e-government [39]. The government's goal remains the same (providing government services to the public), but now accessible through mobile devices. This is in line with what [17] had indicated. The government is capitalizing the mobility feature of these mobile devices and embracing it as a new channel to connect with citizens and other business sectors and providing services to them.
The mobile government is a relatively recent phenomenon, so there is no real theoretical debate on this concept [7], therefore, the concept was addressed according to the direction of the researchers who dealt with it in their study. According to [56] the mobile government is
considered an information system, which is defined as organizations and individuals working to provide their products and services to customers through the use of wireless network and portable devices.
According to [57], the ability of the mobile government in providing the services and information required by users in a timely, efficient and convenient manner, as well as its ability to meet user’s needs for multiple levels of information, leading to improved work efficiency. Thereby, mobile government adds value to users, as well as greatly enhancing user value [37].
Broadly, mobile government has been treated as a policy development and management of operational aspects that will lead to facilitating access to information and provision of government services through mobile devices [26].
At present, mobile government, especially for developing countries, has become unavoidable because of the wireless connectivity and wireless devices that played significant role in stimulating government employees effectiveness by providing real-time information and services, as well as increasing the interaction between government and citizens through mobile government [58].
2.4. Delone And Mclean Model (Information System Success Model)
By reviewing the mobile government evaluation models presented, it was determined that the use of different sets of indicators and weights assigned to them led to mixed results in the performance of the countries evaluated. During the review of the literature, it was concluded that there is a lack of empirical studies in Malaysia, which could provide a comprehensive framework in assessing services for the mobile government. Therefore, in this study, the researcher tried to identify the dimensions and factors that have an impact on evaluating the success of the mobile government service [59].
Current studies with different scales and hypotheses were investigated by researchers who meticulously reviewed the literature and these helped in improving the proposed study. The [60] model, an extension of DeLone and McLean (1992), is a base model of the current study. This model provides a scalable framework for assessing the success of IS in information systems research.
8200 evaluate the success of mobile commerce, m-commerce websites and their quality using existing dimensions or by offering some amendments to DeLone and McLean approach. The DeLone and McLean (2003) model was also used to evaluate the success of mobile banking, [62] measure the success and assess users’ satisfaction towards mobile applications. For [71] evaluation of trust in mobile banking services, [63] used DeLone and McLean (2003) model to study mobile banking adoption while [38] using the model to study usability of the applications. The model has been used to measure the success of both mobile learning [61] and e-learning [69] .[66], [67], [68], [70] as well as DeLone and McLean (2003) [69] model used in the context of e-government domain for assessment of the government success, e-government websites and their quality using existing dimensions or by offering some amendments in DeLone and McLean. Since then, DeLone and McLean (2003) [69] model provides common framework for assessing the IS success. The model obtained a high citation (9483), demonstrating the strength and robustness of this model that is to be used by researchers to measure success in different areas. Some studies used this model in m-government domain hence within the scope of present research M-GSEF use is reasonable. In addition to that, in DeLone and McLean models we find that the dimensions of DeLone and McLean model include the strategy, processes, technology and people which were used in other models.
Based on previous researches, it is suggested that in the m-government which is specific context of study, the model can be tailouccess and measurement criteria may be different and will depend on the distinctiveness of the system and the organization to be evaluated. In fact, there has been a need for additional dimensions to expand this model. In this research, the author attempts to explore the underlying dimensions and factors of m-government services, and has proposed a success model evaluation framework (M-GSEF). Present empirical research adapted DeLone and McLean, (2003) IS success model as base model which is upgradable and extendable, hence additional dimensions were incorporated to develop a novel framework (M-GSEF) for evaluating the success of m-government service. The suggested framework has identified a number of measuring dimensions and associated items within each dimension for M-GSEF. System quality, information quality, and service quality
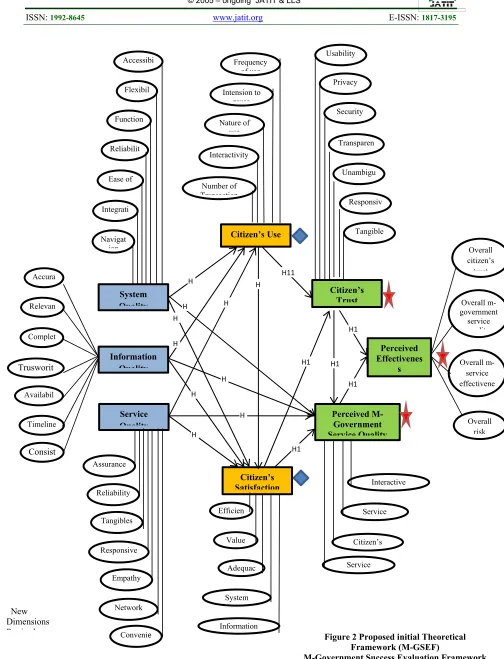
dimensions were adopted from DeLone and McLean (2003) IS success model and “intention to use and user satisfaction” dimensions were re-specified in the proposed framework (M-GSEF) as “citizen’s use / usefulness” and “citizen’s satisfaction”. Furthermore, “citizen’s trust, perceived M-government service quality, and perceived effectiveness” were incorporated as new dimensions in the proposed framework (M-GSEF). Three new dimensions were identified and two existing dimensions were re-specified to evaluate the success of m-government service.
3. MOBILE GOVERNMENT IN MALAYSIA
8201 their views and expectations, and highlight aspects of interest to users, leading at the end the ultimatum to determine the factors specific to the success of these services, and work to improve the mobile government.
4. PROPOSED THEORETICAL
FRAMEWORK
The problem study has been identified in the introduction as “the development of the framework for evaluating the success of m-government services”. Going through various articles and research papers many issues and questions have arised. Major research question is “What is the framework that could best evaluate the success of m-government services”?
8202
Citizen’s Use
System Quality
Service Quality Information
Quality
Citizen’s Satisfaction
Perceived M-Government Service Quality
Perceived Effectivenes
s Citizen’s
Trust
Frequency of use
Intension to reuse
Nature of use
Number of Transaction
Interactivity
Navigat ion Integrati
Ease of Reliabilit
Function li Flexibil
i Accessibi
li
Trusworit
Availabil Complet
Timeline
Consist Relevan Accura
Assurance
Reliability
Tangibles
Convenie
Network Empathy Responsive
Efficien
Value
Adequac
Information System
Overall m-government
service q alit
Overall risk Overall citizen’s trust
Overall m-service effectivene Usability
Tangible Privacy
Security
Transparen
Responsiv Unambigu
Interactive
Service
Citizen’s
Service
H
H H
New Dimensions
R i d Figure 2 Proposed initial Theoretical
Framework (M-GSEF)
M-Government Success Evaluation Framework Based on DeLone & McLean, (2003)
H
H
H
H
H
H1 H11
H H
H1 H1
H1
[image:9.612.65.569.61.720.2]8203 The framework in Figure 33 includes all the dimensions and sub factors that affect m-government’s success according to citizens’ perspective, this framework being proposed based on IS model (DeLone & McLean; 2003), and the following sub sections describe all the dimensions and different items:
4.1. System Quality
System quality, the quality of processing the same information system, which usually includes software and data components, measures the extent of technical correctness of the system. The [75]
[image:10.612.81.513.276.518.2]model considered system quality to be the main dimension that represents the desirable characteristics of IS. This dimension usually focuses on aspects of system usability and system evaluation features. Also, [24] pointed that one of the most important things is the availability of mobile platforms and rapid access to these platforms. Hence “system quality measures the desired functionality and effectiveness characteristics of a government system, interaction with the system are through the mobile platforms”. Table 1 shows the most important factors by which the quality of the system can be measured .
Table 1: System quality and identified attributes
Items / constructs Explanation Reference
Accessibility Access to the system and information contained in it is relatively effortless.
[76], [23],[77],[35]
Flexibility The system has sufficient flexibility to meet
the needs of beneficiaries [60], [78], [38]
Functionality The system has all the required
functionality [38], [24], [77]
System accuracy/ Reliability
The accuracy and reliability of the system over time. The degree to which the system provides quick and timely responses to requests for information or actions.
[60], [78],[24]
Ease to use The degree believes which citizens the use of mobile government to conduct transactions with the government will not be free.
[60], [30], [38]
Integration The ability of the system to combine
information from different sources. [60], [77], [30] Navigation To judge the portal's navigation
characteristics and to assess the existence of links for important information.
[38], [30], [23]
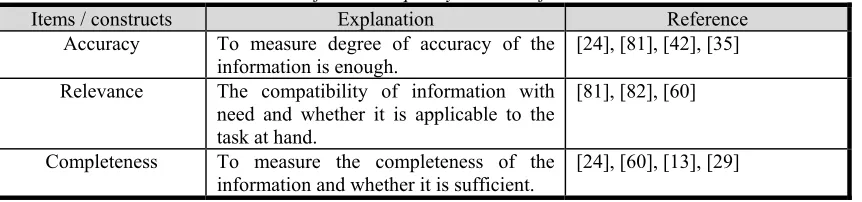
4.2. Information Quality
In the context of m-government, the information quality refers to the quality of information related to government activities. It basically contains the measures like accuracy, timeliness, relevance, precision, and completeness. Information quality places concern on issues such as relevance, timeliness, and accuracy of the information
[image:10.612.86.517.631.732.2]generated by an information system [60], [79]. Information quality is one of the major constituents of m-government development and has direct impact on m-government service quality [80]. Following are exemplary measures of information quality along with their references which were used by researchers to measure information quality other than DeLone and McLean in Table 2.
Table 2: Information quality and identified attributes
Items / constructs Explanation Reference
Accuracy To measure degree of accuracy of the
information is enough. [24], [81], [42], [35] Relevance The compatibility of information with
need and whether it is applicable to the task at hand.
[81], [82], [60]
Completeness To measure the completeness of the
8204
Trustworthiness The degree to which information is clear
and trustworthy. [60], [24], [13]
Availability The degree to which up to date and current information is available to the citizens.
[60], [13], [42], [29], [30]
Timeliness The degree to which citizens are able to find current information at the time of its publication.
[60], [29], [42]
Consistency The degree to which the information is consistently available to the citizens on the web.
[81] , [42], [30]
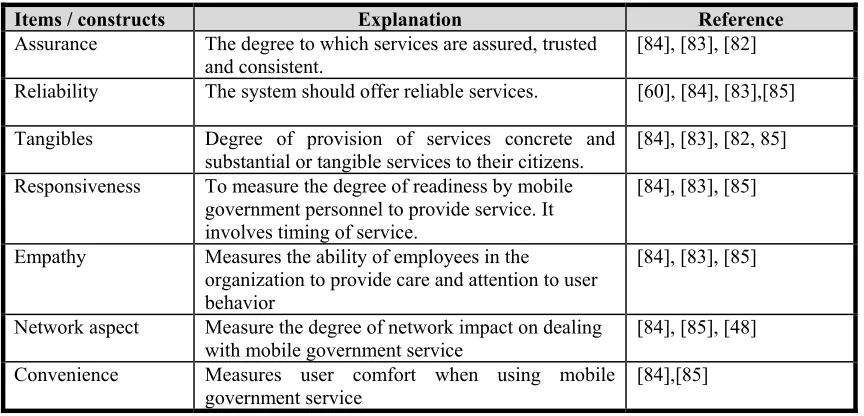
4.3. Service Quality
The quality of mobile government service is an important factor in measuring citizen satisfaction. Service quality is one of the major constituents of m-government development and has direct impact on m-government service quality [83]. Proposed is an updated model for success evaluation of
[image:11.612.83.515.375.583.2]m-government service including a “service quality” measure as a new dimension. Following are exemplary measures of service quality along with their references listed. ” Table 3 shows the most important factors by which the Service Quality can be measured.
Table 3: Service quality and identified attributes
Items / constructs Explanation Reference
Assurance The degree to which services are assured, trusted
and consistent. [84], [83], [82]
Reliability The system should offer reliable services. [60], [84], [83],[85]
Tangibles Degree of provision of services concrete and
substantial or tangible services to their citizens. [84], [83], [82, 85] Responsiveness To measure the degree of readiness by mobile
government personnel to provide service. It involves timing of service.
[84], [83], [85]
Empathy Measures the ability of employees in the
organization to provide care and attention to user behavior
[84], [83], [85]
Network aspect Measure the degree of network impact on dealing
with mobile government service [84], [85], [48] Convenience Measures user comfort when using mobile
government service [84],[85]
4.4. Citizen’s Use / Usefulness
In the context of the present study on m-government success evaluation, we are using “citizen’s use /usefulness” that means the positive experience of citizens in using m-government service. Citizen’s positive experience affects “usefulness” and “citizen’s satisfaction” of m-government service. In m-m-government success assessment, perceived usefulness is defined as: “the degree to which citizens believe that using an offered m-government service is effective and useful for them and increases work performance”.
8205 system’s ease of use [30]. Trust and citizen’s confidence in m-government services are assured only when the system contents are reliable and usable [43] and [86]. Following are exemplary
measures of “citizen’s use / usefulness / perceived usefulness” along with their references list which were used by researchers to measure usefulness other than DeLone and McLean in Table 4.
.
Items / constructs Explanation Reference
Frequency of use / Daily use The degree to which citizens use the m-government services frequently to accomplish their work. How frequently stakeholders use the m-government services on regular basis.
[20], [87], [35]
Intention to (re)use Whether the citizens are ready to reuse the mobile platforms services again.
[60], [88], [11]
Nature of use Kind of jobs accomplished by user /citizens while using m-government services.
[60], [87], [89], [20]
Interactivity Allows citizens to interact effectively and enhance usefulness.
[60], [24], [20]
Number of transactions Number of transactions
executed by the user /citizen. [60], [87], [89]
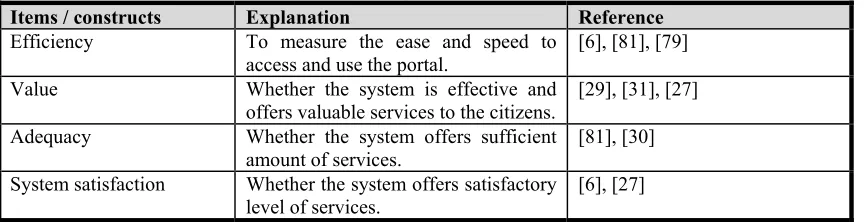
4.5 Citizen’s Satisfaction
In the present context of the study, we use citizen instead of user because present study is related to the m-government and citizens doing the transaction with m-government. How citizen’s satisfaction is to be measured and what items constitute that measure citizens’ satisfaction is a challenge in m-government. Citizen satisfaction with m-government services is related to a citizen’s perception about mobile platforms service convenience (transaction), reliability of the information (transparency), and engagement with electronic communication (interactivity) [30]. Within the context of this research, satisfaction is considered as a citizen’s decision on overall use of the service. Therefore, the citizen's satisfaction is associated to the mobile government services portrayed by the citizens using the government
[image:12.612.85.517.619.730.2]mobile portal. The citizen's satisfaction is also positively linked to the confidence towards the government. The quality of service delivery increases citizens' satisfaction and this leads to a strong correlation between citizen satisfaction and confidence in the provision of mobile government services [28]. Increasing citizens’ confidence in mobile government will increase citizens' satisfaction in providing mobile government services [77]. In [6], identified perceived ease of use and perceived utility as a precedent for satisfaction, which clearly demonstrated the utility of the system, information and services had an impact on citizen satisfaction. Following are exemplary measures of citizen satisfaction along with their references listed below which were used by researchers to measure user’s satisfaction quality other than DeLone and McLean in table 5.
Table 5: Citizen’s satisfaction and identified attributes
Items / constructs Explanation Reference
Efficiency To measure the ease and speed to
access and use the portal. [6], [81], [79] Value Whether the system is effective and
offers valuable services to the citizens. [29], [31], [27] Adequacy Whether the system offers sufficient
amount of services.
[81], [30]
System satisfaction Whether the system offers satisfactory
8206
Information satisfaction Whether the available information
through the system is up to date. [29], [42] Overall satisfaction Users /citizens are fully satisfied with
the services while using the system. [28], [81], [30]
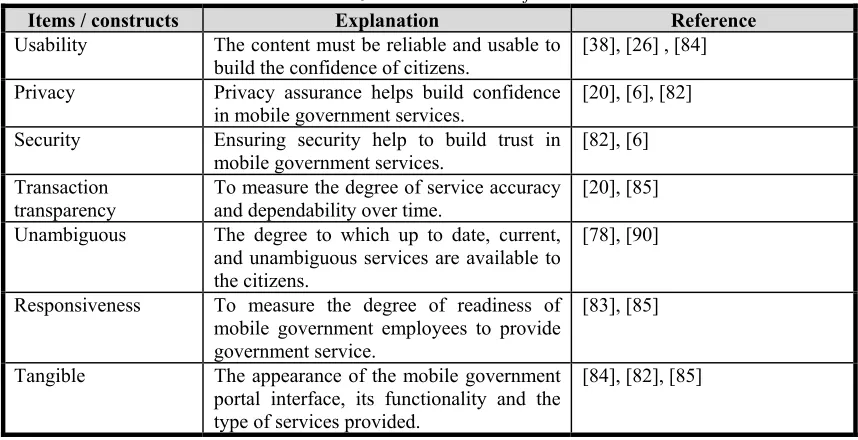
4.6 Citizen’s Trust
In the context of the mobile government, confidence plays a very important role in the use of the mobile government portal. The lack of confidence in the mobile portal of the mobile government may prompt citizens to use indirect traditional means of communication with the government. As a result, building citizens trust is one of the key factors behind the success of the mobile government services [30]. Citizen satisfaction is linked to e-government services using the mobile government portal, and citizen satisfaction is directly correlated with confidence in mobile government. Increased citizen confidence in the mobile government will increase citizen’s satisfaction with the provision of government services via mobile platforms [29]. Increasing the
[image:13.612.83.512.373.593.2]quality of service provided to citizens increases the satisfaction of citizens, and citizen’s satisfaction is also strongly related to the confidence in the provision of mobile government services [31]. Increased trust increases the perceived benefit of the mobile government portal. Trust in mobile services stimulates citizens to access mobile services. When a user uses a mobile platform, it is important that the portal is understandable and easy to use. The perceived ease of use increases the confidence invested in [77]. The result is that increased citizen confidence in the government will lead to increased citizens' satisfaction with the provision of mobile government services [45]. Following are exemplary measures of citizen’s trust along with their references listed below which were used by researchers to measure trust in Table 6.
Table 6: Citizen’s trust and identified attributes
Items / constructs Explanation Reference
Usability The content must be reliable and usable to build the confidence of citizens.
[38], [26] , [84]
Privacy Privacy assurance helps build confidence
in mobile government services. [20], [6], [82] Security Ensuring security help to build trust in
mobile government services. [82], [6] Transaction
transparency To measure the degree of service accuracy and dependability over time. [20], [85] Unambiguous The degree to which up to date, current,
and unambiguous services are available to the citizens.
[78], [90]
Responsiveness To measure the degree of readiness of mobile government employees to provide government service.
[83], [85]
Tangible The appearance of the mobile government portal interface, its functionality and the type of services provided.
[84], [82], [85]
4.7 Perceived M-Government Service Quality
Perceived m-government service quality in the present study is considered as an overall m-government service quality. Generally, [78] identified the concept of perceived quality and satisfaction and stated that measuring the perceived quality and satisfaction is complex and hence it is necessary to take overall perceived quality. Whereas [47], identified mobile service quality as m-government performance and considered as
8207 determining indicator of m-government achievement or being unsuccessful in the virtual perspective. [91], m-service quality influences the citizens as well as government efforts. Following
[image:14.612.85.513.161.355.2]are exemplary measures of information quality along with their references which were used by researchers to determine Perceived m-government Service Quality in Table 7.
Table 7: Perceived m-government service quality and identified attributes
Items / constructs Explanation Reference
functionality of interactive
environment M-government service provides interactive environment to the citizens along with effective functionality of m-government system.
[78], [80]
service reliability M-government service provides reliable service to the citizens.
[86], [48]
citizen’s support M-government service provides necessary user support on the portal and gives special attention to every user individually.
[92], [93]
service satisfaction M-government service portal provides helpful instruction for performing my task.
[94], [95], [6]
.
4.8 Perceived Effectiveness Of M-Government Services
As author’s study is to evaluate the success of m-government service, hence the dimension “perceived effectiveness” is conceptualized for assessing the m-government service success. As present study considered DeLone and McLean (2003) as base model which assesses the IS success using “Net Benefits” as concluding variable. Literature clearly indicates that "net benefit" as a final building has been used in different contexts by researchers and appears to be ambiguous and clearly indeterminate. Thus, in the context of this present study, "perceived effectiveness" is the most appropriate word to evaluate the success of mobile government rather than "net benefit", which gives a rational designation of what to measure in the context of mobile government. Hence in the
perspective of present study, the author considers “perceived effectiveness” as major “m-government service evaluation” construct along with overall citizens’ trust, overall m-government service quality, overall risk, and overall m-service effectiveness as items to evaluate perceived effectiveness of m-government service. Perceived effectiveness is the final construct which is influenced by its antecedent technological and behavioral constructs. Perceived effectiveness construct examines how effectively m-government service is being offered and it focuses on specific constituents which contribute to the success evaluation. Following are exemplary measures of information quality along with their references listed which were used by researchers to determine Perceived Effectiveness of M-government Services
in Table 8
[image:14.612.91.515.606.701.2].
Table 8: Perceived Effectiveness and attributes
Items / constructs Explanation Reference
Overall citizen’s trust Measure overall citizen’s trust [28], [25] Overall m-government service
quality Measure overall m-government service quality [75], [60]
Overall risk Measure overall risk [82], [6]
Overall m- government service
8208
5. METHODOLOGY
We attempted to construct new success evaluation framework for Malaysian M-Government focusing on citizen perspectives.
In the previous section we proposed initial evaluation framework based on IS model and comprehensive literature survey of all dimension and items of m-government success.
The following sections and sub sections will assess our initial evaluation framework in order to obtain an ideal framework and exclude the dimensions and items that do not affect the success of mobile government in Malaysia.
This study employed Fuzzy Delphi Method to obtain expert consensus on the pillars and the elements of the framework. Fuzzy Delphi Method is a quantitative method combining a fuzzy set numbering or fuzzy set theory with the traditional Delphi Method. Figure 1 illustrates the proposed framework for evaluating the success of mobile government services.
The Delphi Method survey includes some semantic ambiguity in both questions and answers, so the frequency distillation and distillation distributions are used to gather expert opinions on unclear numbers. Similar method is used to assess the degree of agreement between two experts. The
consensus coefficient is then used for each expert to derive the foggy valuation value from all experts. Experts express their views fully ensuring that the group view is complete and consistent. Taking into account is the fuzziness that can’t be avoided during the survey process. Expert opinions give a real reflection of their response, meaning that the opinions of the original experts are not misunderstood.
Expert questionnaires are a useful tool for data collection in Delphi survey when interviewing individuals is not possible in terms of time and group arrangement [8].
The Factors were derived from related literature and suggested by experts in a close format. Data analysis in Fuzzy Delphi Method in the present study was done as the following:
Step 1: Experts’ opinions were collected through the dissemination of questionnaire. The numbers of expert in this study are 15 as suggested by D 18; D11. The experts are all with a background in mobile services, mobile technology and applications.
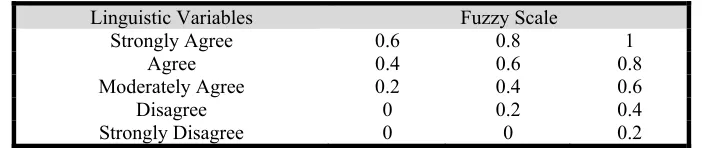
[image:15.612.119.470.461.535.2]Step 2: Linguistic variables were converted into triangular fuzzy numbers. In this study, 5-point Likert scale was chosen to indicate the expert’s feedback. Table 4.7 illustrates the linguistic variables in weighting the agreement of the experts.
Table 4.1Linguistic variables of the agreement
Linguistic Variables Fuzzy Scale
Strongly Agree 0.6 0.8 1
Agree 0.4 0.6 0.8
Moderately Agree 0.2 0.4 0.6
Disagree 0 0.2 0.4
Strongly Disagree 0 0 0.2
Step 3: Vertex method was used to calculate the distance of between two fuzzy numbers.
Step 4: Each element was measured. If the threshold value (d) is less than or equal to 0.2 (d ≥ 0.2), the elements are rendered as accepted by the experts’ consensus. If the average percentage of experts’ consensus is more than or equal to 75%, the elements are considered as reaching the consensus (Cheng & Lin, 2002).
Step 5: The average fuzzy score was determined based on the value of α- cut, which is 0.5. If the average fuzzy score (A) is more than or equal to 0.5, the elements are measured achieving the
consensus of the experts. The formula used for defuzzification is:
A= 1/3 * (m1 + m2 + m3)
5.1 SELECTING THE EXPERTS
8209 optimal in a Delphi study). Delbecq et al., (1975) in [236] a group of five to nine experts is adequate to achieve a rational evaluation. However, [237] explains that the number of experts employed must have the ability to process information and release judgments. This study used 15 participants to form a framework evaluating team (Appendix A showing the description of the participating experts).
The expert selection was difficult because the expert in m-government is limited.
5.2 THE EXPERT QUESTIONNAIRES
We developed questionnaires to collect the data (opinion of experts). The questionnaires are based on the elements derived from analyzing and synthesizing existing frameworks and guidelines. They were disseminated through Google Form online survey tool. Online technology benefitted this study by the advantages of ICT in available data storage, easy data processing, effortless maintaining and updating and faster feedback from participant [96]. Moreover, [97] suggested that in digital age, researchers may put the questionnaires online to avoid delay and burden.
The questionnaire comprised two parts, part one related to the personal information of the expert, and the following sources relied upon [98],[99], [100]. The second section contains (52) questions, to obtain expert opinion of the dimensions and the factors of the proposed framework. Table 4 shows Content Factors.
In order to keep high quality and get content validity, the study instrument needs to be evaluated before doing the pilot study [249]. Therefore, the instrument was refined through pre-testing by subject matter specialists. The study instrument was presented on a group of subject matter specialists consisted of (4) persons. They are academic members Faculty of Art, Computing and Creative Industry (Appendix B includes names of subject matter specialists)
5.3 THE EXPERT CONSENSUS
The findings from questionnaires were collected and analyzed using Microsoft Office Excel. Below is the summary on the findings of expert’s consensus for framework formulation. The findings demonstrated the average threshold value, average percentage of expert’s consensus and average fuzzy score.
There is the initiative of applying maximum-minimum method with cumulative frequency distribution and fuzzy scoring to address experts’ opinion in terms of fuzzy numbers that resulted in fuzzy Delphi method [225]. Instead, Hsu and Chen (1996) in [228] introduced the fuzzy similarity aggregation method. Through this method, similarities among experts were gathered and fuzzy numbers are assigned to each expert.
This is used to identify the degree of agreement among them. Experts’ fuzzy evaluation is then aggregated using consensus coefficient. If this resulted in low degree of agreement among experts, the survey needs to be distributed again.
5.3.1 THE EXPERT CONSENSUS THE FRAMEWORK DIMENSIONS
8210
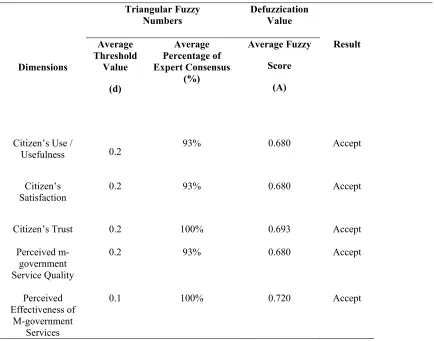
Table 9: Expert Consensus on Dimensions of the Framework
Triangular Fuzzy
Numbers Defuzzication Value
Dimensions
Average Threshold
Value
(d)
Average Percentage of Expert Consensus
(%)
Average Fuzzy
Score
(A)
Result
Citizen’s Use /
Usefulness 0.2 93% 0.680 Accept
Citizen’s Satisfaction
0.2 93% 0.680 Accept
Citizen’s Trust 0.2 100% 0.693 Accept
Perceived m-government Service Quality
0.2 93% 0.680 Accept
Perceived Effectiveness of
M-government Services
0.1 100% 0.720 Accept
Table 9 depicts the consensus of experts on the proposed dimensions (revised and new) for framework to evaluate mobile government services success based on triangular fuzzy numbers and defuzzification value. The average percentage of the expert consensus for citizen’s use / usefulness 93%, citizen’s satisfaction 93%, and perceived m-government service quality 93%. Citizen’s trust 100% and perceived effectiveness of m-government services 100%. From the result, it was observed that the most important diminutions is the citizen’s trust, and perceived effectiveness of m-government services , followed by citizen’s use / usefulness , citizen’s satisfaction, and perceived m-government
service quality, respectively. The finding indicates that for the evaluation of the success in mobile government services, consideration should be focused on citizen’s trust, and perceived effectiveness of m-government services followed by other dimensions.
5.3.2 The Expert Consensus The System Quality Factors
8211
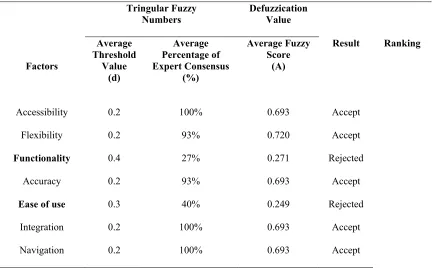
Table 10: Experts Consensus for the factors of system quality
Tringular Fuzzy
Numbers Defuzzication Value
Factors
Average Threshold
Value (d)
Average Percentage of Expert Consensus
(%)
Average Fuzzy Score
(A)
Result Ranking
Accessibility 0.2 100% 0.693 Accept
Flexibility 0.2 93% 0.720 Accept
Functionality 0.4 27% 0.271 Rejected
Accuracy 0.2 93% 0.693 Accept
Ease of use 0.3 40% 0.249 Rejected
Integration 0.2 100% 0.693 Accept
Navigation 0.2 100% 0.693 Accept
Table 10 illustrates the summary on experts’ consensus for the factors of system quality in the framework of M-GSEF to evaluate the success of mobile government services. It was discovered that the experts have accepted five factors proposed as they met three conditions of Fuzzy Delphi Method, and two factors were rejected because did not fulfill the conditions. Maximum percentage of expert consensus was seen in this study particularly for accessibility (100%), integration (100%) and navigation (100%), while a slightly lower consensus was observed for flexibility (93%), and accuracy (93%). Average fuzzy score analysis displays Flexibility (0.720) as the highest scoring element followed by the other factors (0.693) for
each of the accessibility, accuracy, integration, and navigation. Meanwhile, two were rejected since they did not fulfill the three conditions previously stated, these factors are functionality (27%) and ease to use (40%).
5.3.3 The Expert Consensus The Information Quality
8212
Table 11: Experts Consensus for the factors of information quality
Tringular Fuzzy
Numbers Defuzzication Value
Factors
Average Threshold
Value (d)
Average Percentage of Expert Consensus
(%)
Average Fuzzy Score
(A)
Result
Accuracy 0.0 93% 0.787 Accept
Relevance 0.2 100% 0.707 Accept
Completeness 0.0 93% 0.787 Accept
Trustworthiness 0.2 93% 0.680 Accept
Availability 0.2 100% 0.693 Accept
Timeliness 0.2 100% 0.693 Accept
Consistency 0.3 47% 0.298 Rejected
Table 11 illustrates the summary on experts’ consensus for information quality factors in the framework of mobile government services success. Six factors were accepted with one factor rejected. The accepted factors are accuracy (93%), relevance (100%), completeness (93%), trustworthiness (93%), availability (100%), and timeliness (100%). Meanwhile, consistency factor is the one rejected since it did not fulfilled the three conditions previously stated. According to the finding, the main factor of information quality are accuracy and completeness (0.787 each) followed by relevance (0.707). The third essential factors of information
quality are availability and timeliness (0.693 each). The fourth factor is trustworthiness (0.680).
5.3.4 The Expert Consensus The Service Quality
8213
Table 12: Experts Consensus for the factors of Service quality
Tringular Fuzzy
Numbers Defuzzication Value
Factors
Average Threshold
Value (d)
Average Percentage of Expert Consensus
(%)
Average Fuzzy Score
(A)
Result
Assurance 0.2 93% 0.680 Accept
Reliability 0.2 93% 0.693 Accept
Tangibles 0.2 100% 0.693 Accept
Responsiveness 0.2 100% 0.693 Accept
Empathy 0.3 13% 0.213 Rejected
Network aspect 0.4 33% 0.480 Rejected
Convenience 0.2 93% 0.707 Accept
Table 12 illustrates the summary on experts’ consensus for the factors of service quality in the framework of mobile government services success. Five factors were accepted with two factors rejected. The accepted factors are assurance (93%), reliability (93%), tangibles (100%), responsiveness (100%), and convenience (93%). Meanwhile, empathy, and network aspect factors are the two rejected since it did not fulfilled the three conditions previously stated. According to the finding, the main factors of service quality are convenience (0.707) followed by reliability, tangibles, and responsiveness (0.680). The last essential factor of service quality is assurance (0.714 each).
5.3.5 The Expert Consensus The Citizen’s Use / Usefulness
8214
Table 13: Experts Consensus for the factors of Citizen’s Use / Usefulness
Triangular Fuzzy
Numbers Defuzzication Value
Factors
Average Threshold
Value (d)
Average Percentage of Expert Consensus
(%)
Average Fuzzy Score
(A)
Result
Frequency of use /
Daily use 0.1 100% 0.720 Accept
Intention to
(re)use 0.2 100% 0.693 Accept
Nature of use 0.3 40% 0.564 Rejected
Interactivity 0.1 100% 0.680 Accept
Number of
transactions 0.2 93% 0.680 Accept
Table 13 illustrates the summary on expert’s consensus for the citizen’s use / usefulness factors in the framework of mobile government services success. Four factors were accepted with one factor rejected. Three factors frequency of use / daily use, intention to (re) use, and Interactivity obtained the highest percentage of agreement (100% each) followed by a factor number of transactions (93%). Meanwhile, nature of use factor was rejected since it did not fulfill the three conditions previously stated.
According to the findings, the main factors of citizen’s use / usefulness is frequency of use /
daily use (0.720) followed by intention to (re)use (0.693).
The last essential factors of citizen’s use / usefulness are interactivity and number of transactions (0.680 each).
5.3.6 The Expert Consensus The Citizen’s Satisfaction
8215
Table 14: Experts Consensus for the Factors of Citizen’s Satisfaction
Triangular Fuzzy
Numbers Defuzzication Value
Factors
Average Threshold
Value (d)
Average Percentage of Expert Consensus
(%)
Average Fuzzy Score
(A)
Result
Efficiency 0.3 33% 0.573 Rejected
Value 0.2 93% 0.693 Accept
Adequacy 0.2 100% 0.693 Accept
System
satisfaction 0.2 100% 0.693 Accept
Information
satisfaction 0.0 100% 0.600 Accept
Table 14 illustrates the summary on experts’ consensus for the factors of citizen’s satisfaction in the framework of mobile government services success. Five factors were accepted with one factor rejected. The accepted factors are value (93%), adequacy (100%), system satisfaction (100%), information satisfaction (100%), and overall satisfaction (93%). Meanwhile, efficiency factor is the one rejected since it did not fulfilled the three conditions previously stated. According to the finding, the main factors of citizen’s satisfaction are value, adequacy and system satisfaction (0.693 each) followed by overall satisfaction (0.680). The
last essential factor of citizen’s satisfaction is information satisfaction (0.600).
5.3.7 The Expert Consensus The Citizen’s Trust
8216
Table 15: Experts Consensus for the factors of Citizen’s Trust
Tringular Fuzzy
Numbers Defuzzication Value
Factors
Average Threshold
Value (d)
Average Percentage of Expert Consensus
(%)
Average Fuzzy Score
(A)
Result
Usability 0.3 47% 0.693 Rejected
Privacy 0.2 100% 0.720 Accept
Security 0.2 100% 0.707 Accept
Transparency 0.2 93% 0.693 Accept
Unambiguous 0.3 27% 0.631 Rejected
Responsiveness 0.2 93% 0.720 Accept
Tangible 0.3 20% 0.458 Rejected
Table 15 illustrates the summary on experts’ consensus for the factors of citizen’s trust in the framework of mobile government services success. Four factors were accepted with three factors rejected. The accepted factors are privacy (100%), security (100%), transaction transparency (93%), and responsiveness (93%). Meanwhile, usability (47%), unambiguous (27%), and tangible (20%) factor are the three rejected since it did not fulfilled the three conditions previously stated. According to the finding, the main factor of citizen’s trust is privacy and responsiveness (0.720 each) followed
by security (0.707). The last essential factor of citizen’s trust is transparency (0.693 each).
5.3.8 The Expert Consensus The Perceived M-Government Service Quality
[image:23.612.89.520.565.745.2]This study has proposed four factors for perceived m-government service quality; functionality of interactive environment, service reliability, citizen’s support, and service satisfaction. Table 16 describes the expert’s consensus on the factors of perceived m-government service quality.
Table 16: Experts Consensus for the factors of Perceived m-government Service Quality
Tringular Fuzzy
Numbers Defuzzication Value
Factors
Average Threshold Value (d)
Average
Percentage of Expert Consensus (%)
Average Fuzzy Score
(A)
Result
functionality of interactive environment
0.0 93% 0.787 Accept
8217
citizen’s support 0.1 100% 0.680 Accept
service
satisfaction 0.2 93% 0.680 Accept
Table 16 illustrates the summary on experts’ consensus for the factors of perceived m-government service quality in the framework of mobile government services success. All four factors were accepted. The experts have accepted all four proposed factors as they satisfy three conditions of Fuzzy Delphi Method. Maximum percentage of expert consensus was seen in this study particularly for service reliability (100%), and citizen’s support (100%), while a slightly lower consensus was observed for functionality of interactive environment (93%), and service satisfaction (93%). According to the finding, the main factor of perceived m-government service quality is functionality of interactive environment (0.787) followed by service reliability (0.720). The
last essential factors of perceived m-government service quality are citizen’s support and service satisfaction (0.680 each).
5.3.9 The Expert Consensus On The Perceived Effectiveness Of M-Government Services
[image:24.612.89.480.71.165.2]This study has proposed four factors for perceived effectiveness of m-government services; overall citizen’s trust, overall m-government service quality, overall risk, and overall m- government service effectiveness. Table 4.14 and 4.15 describe the expert’s consensus on the factors of perceived effectiveness of m-government services.
Table 17: Experts Consensus for the factors of Perceived Effectiveness of M-government Services
Tringular Fuzzy
Numbers Defuzzication Value
Factors
Average Threshold
Value (d)
Average Percentage of Expert Consensus
(%)
Average Fuzzy Score
(A)
Result
Overall citizen’s
trust 0.2 100% 0.707 Accept
Overall m-government service quality
0.2 100% 0.707 Accept
Overall risk 0.2 100% 0.693 Accept
Overall m- government
service effectiveness
0.1 100% 0.720 Accept
Table 17 illustrates the summary on experts’ consensus for the factors of perceived effectiveness of m-government services in the framework of mobile government services success. All four factors were accepted. The experts have accepted
[image:24.612.81.513.404.662.2]8218 According to the finding, the main factor of perceived effectiveness of m-government services is overall m- government service effectiveness (0.720) followed by overall citizen’s trust, and overall m-government service quality (0.707 each).
The last essential factor of perceived effectiveness of m-government services is overall risk (0.693). Figure 3 shows the final framework for evaluating the success of mobile government service
Citizen’s
System Quality
Service Quality Information
Quality
Citizen’s Satisfaction
Perceived M-Government
Service Quality
Perceived Effectiveness Citizen’s
Trust Frequency
f
Intension to reuse
Number of Transaction
Interactivit
Navigat i Integra
Reliabil Flexibi
Accessi
Trusworit
Availab Compl
Timeli Releva Accur
Assuran
Reliabili
Tangible
Conveni Responsi
Value
Adequa cy
Information ti f ti System satisfaction
Overall m-government
service lit
Overall risk Overall citizen’s
t t
Overall m-service effectivene Privac
Security
Transpa
Responsi
Interactive
Service R li bilit
Citizen’s S Service satisfaction
H
H H
New Dimensions Revised
Dimensions Figure 3: Proposed Theoretical Framework
(M-GSEF)
M-Government Success Evaluation Framework Based on DeLone & McLean,
H
H
H
H
H
H H11
H H
H H
H
[image:25.612.68.558.155.722.2]